- STATISTICAL RELEASE
Euro area pension fund statistics: second quarter of 2020
28 September 2020
- Total assets of euro area pension funds amounted to €2,939 billion in second quarter of 2020, €168 billion higher than in first quarter of 2020
- Total pension entitlements of euro area pension funds rose to €2,708 billion in second quarter of 2020, up €100 billion from first quarter of 2020
- Main balance sheet items for euro area countries are published for the first time
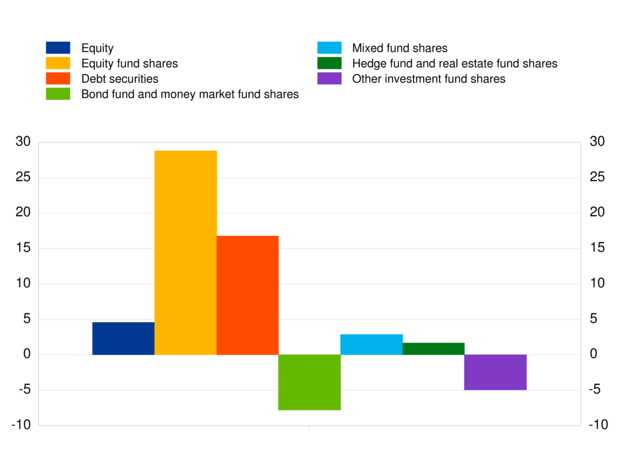
Total assets of euro area pension funds increased to €2,939 billion in the second quarter of 2020, from €2,771 billion in the first quarter of 2020. Investment fund shares accounted for 44.8% of the pension funds sector's total assets in the second quarter of 2020. The second largest category of holdings was debt securities (25.5%), followed by equity (9.0%) (see respective transactions in Chart 1).
Holdings of investment fund shares increased to €1,316 billion at the end of the second quarter of 2020 from €1,233 billion at the end of the previous quarter. Net purchases of investment fund shares amounted to €21 billion in the second quarter of 2020, while price and other changes amounted to €62 billion. Looking at the main type of investment fund shares, equity fund shares totalled €407 billion, with net purchases of €29 billion.
Turning to pension funds' holdings of debt securities, these increased to €750 billion at the end of the second quarter of 2020 from €719 billion at the end of the previous quarter. Net purchases of debt securities amounted to €17 billion in the second quarter of 2020, while price and other changes amounted to €14 billion. Looking at equity on the assets side, euro area pension funds' holdings increased to €264 billion at the end of the second quarter of 2020, from €230 billion at the end of the previous quarter. Net purchases of equity stood at €5 billion in the second quarter of 2020, while price and other changes stood at €29 billion.
Chart 1
Transactions in main assets of euro area pension funds' in the second quarter of 2020
(quarterly transactions in EUR billions; not seasonally adjusted)

In terms of the main liabilities, total pension entitlements of pension funds amounted to €2,708 billion in the second quarter of 2020, up from €2,608 billion in the first quarter of 2020. Defined benefit pension schemes amounted to €2,251 billion, accounting for 83.1% of total pension entitlements. Defined contribution pension schemes totalled €458 billion, accounting for 16.9% of total pension entitlements in the second quarter of 2020. Net purchases of defined benefit schemes amounted to €22 billion in the second quarter of 2020, while those of defined contribution schemes came to €7 billion. Price and other changes of total pension entitlements amounted to €71 billion.
The pension fund sector is highly concentrated in the euro area, with funds in Germany and Netherlands accounting for more than 80% of the total assets. The total assets of euro area pension funds are equivalent to roughly one-quarter of euro area GDP. However, total assets of pension funds resident in the Netherlands represent approximately 200% of national GDP, while in some other countries, such as France, no institution currently meets the criteria to be classified as a pension fund under the European System of Accounts (ESA 2010). This contrast mirrors among others differences in countries’ pension systems. In France, private pension schemes are at present channelled predominantly through insurance corporations, while in the Netherlands occupational pension schemes play a prominent role in the pension system.
For queries, please use the statistical information request form.
Notes:
- "Defined benefit schemes" include hybrid schemes.
- "Investment funds" includes money market funds and non-money market funds.
- Hyperlinks in the main body of the statistical release and in the annex table lead to data that may change with subsequent releases as a result of revisions. Figures shown in the annex table are a snapshot of the data as at the time of the current release.
-
28 September 2020


