Bank mergers and acquisitions in the euro area: drivers and implications for bank performance
Published as part of the Financial Stability Review, November 2021.
Bank mergers and acquisitions (M&As) have been subdued in the euro area since the global financial crisis. Most M&A activity has had a domestic focus and has involved smaller targets, with larger and sounder acquirers acting as consolidators. Consolidation seems on average to have had a moderately positive impact on the profitability of the banks involved, although high levels of variance reveal the presence of large execution and design risks amid low overall returns on capital in the banking sector. Improved post-transaction profitability can be linked to targets’ lower cost efficiency, liquidity and capitalisation. Cross-border M&A transactions have been concentrated within a few small groups of euro area countries, supported by prior financial links and geographical proximity. Such transactions tend to be followed by a stronger improvement in profitability than domestic mergers, although this effect has diminished since the global financial crisis.
1 Introduction
Bank mergers and acquisitions are often regarded as an option for reducing overcapacity and weak profitability in the euro area banking sector. The euro area banking market has become increasingly concentrated (see Chart B.1, panel a), and a third of its banking groups – mainly the smallest banks – have disappeared since the global financial crisis. Despite this, the sector continues to struggle with weak profitability and excess capacity, with too many undersized banks and a costly physical banking infrastructure.[1] Some measures of bank efficiency lag behind those of other advanced economies too (see Chart B.1, panel b). The efficiency and stability of the banking system would benefit from further consolidation[2] which – as several policymakers have noted – should be driven by market forces, with each proposed transaction assessed individually.[3] Against this background, this special feature reviews recent trends in the consolidation of the euro area banking sector, examines the characteristics and drivers of bank M&A transactions, and analyses the impact of bank mergers and acquisitions on the performance of euro area banks.
Chart B.1
Consolidation has led to a more concentrated market since the global financial crisis, but there is more room for efficiency gains
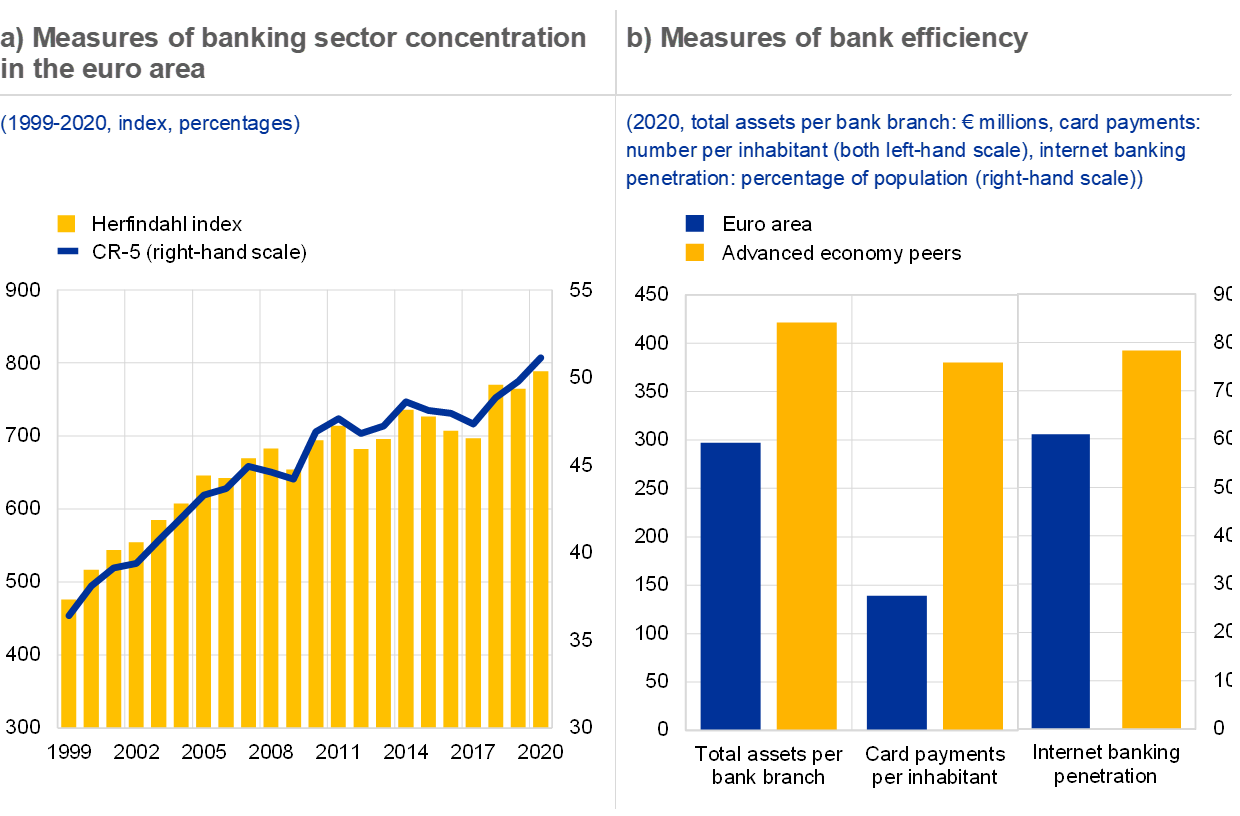
Sources: Bank for International Settlements, Federal Deposit Insurance Corporation, Norges Bank, ECB and ECB calculations.
Notes: Panel a: the Herfindahl index is a measure of bank size relative to the sector, computed as the sum of the squared individual bank asset shares of euro area banking system assets. Higher values indicate a higher degree of concentration. The concentration ratio (CR-5) refers to the weighted average of concentration ratios of national banking sectors in the euro area. Panel b: the category “advanced economy peers” comprises Denmark, Norway, Sweden, the United Kingdom and the United States.
2 Developments in the euro area
M&A activity slowed markedly in the euro area banking sector in the wake of the global financial crisis. In line with developments globally, the value of M&A transactions, proxied by the total assets of M&A targets, fell by about two-thirds between the pre-crisis decade and the period since 2008 (see Chart B.2, panel a). Large transactions have become particularly uncommon, while the drop in the total number of transactions has been less steep. It has also become more difficult to finalise M&A transactions in the aftermath of the global financial crisis. On average, one in three attempted transactions has ended without a deal in the post-crisis period, up from one in six in the pre-crisis decade (see Chart B.2, panel b). This highlights the difficulties euro area banks face in finding an attractive match in an increasingly challenging operating environment that is characterised by low interest rates, low returns on capital and the ongoing digital transformation of the financial industry. Only recently has bank M&A activity started to recover, although it remains below pre-crisis levels.
Chart B.2
Bank M&A activity has remained muted since 2008 in terms of both deal values and numbers, with the share of failed deals increasing
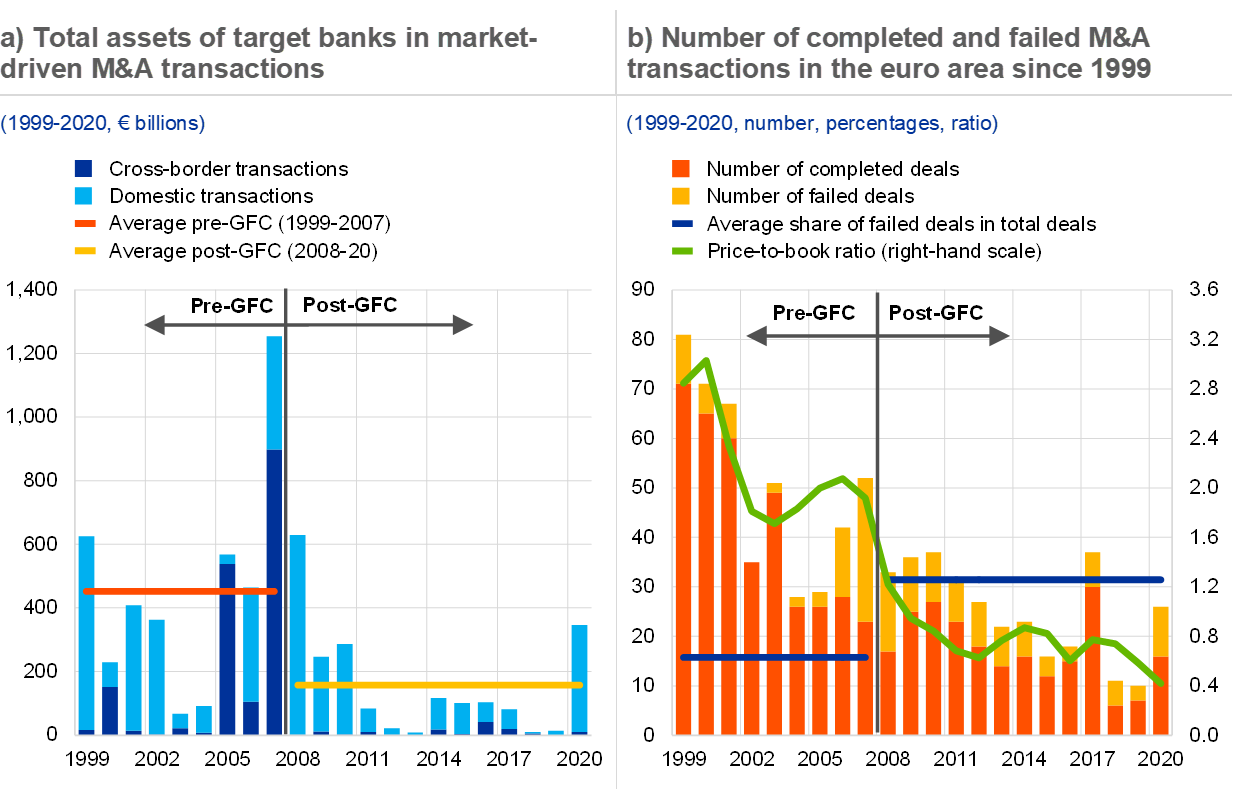
Sources: Dealogic, Orbis Bank Focus, Refinitiv and ECB calculations.
Notes: Relevant M&A transactions exclude the acquisition of assets, repurchases, privatisations, leveraged buyouts, joint ventures and restructurings. They meet the following criteria: (1) the acquired stake is above 10%, corresponding to a qualifying holding; (2) the initial stake is below or equal to 50%; and (3) the final stake is above 50%. In cases where multiple banks are involved in a deal as target and/or acquirer, at least one of the targets and/or acquirers have to be domiciled within the euro area. The transactions are reported by the year in which they were announced. The periods before and after the global financial crisis (GFC) are defined as 1999-2007 and 2008-20 respectively. Panel a: total assets refer to the last available observation prior to the year in which the merger was completed. Data on total assets of the target are available for 350 out of 603 deals reported by Dealogic for 1999-2020. Panel b: the price-to-book ratio shown refers to the median of listed euro area banks’ price-to-book ratios at the end of each year.
Larger institutions and banks with stronger fundamentals have played a dominant role as consolidators of the banking market. From the acquirer perspective, medium-sized and large institutions have accounted for around 60% of all bank M&As in the euro area (see Chart B.3, panel a), predominantly targeting smaller institutions. This may indicate that targets have been selected to complement the existing business model of the acquirer rather than to combine two institutions with similar balance sheet footprints. The preference for smaller banks might also reflect disincentives for increasing the size of large domestic institutions in the capital buffer framework. Moreover, most bank M&A deals since the global financial crisis have contained at least one bank perceived by investors to be stronger than the median bank. Around 15% of all deals (mostly domestic deals) seem to have involved weaker institutions to the extent that lower bank valuations and weaker bank profitability are indicative of less solid bank fundamentals.
Bank M&A activity in the euro area has mainly focused on transactions within national markets. Around 80% of all completed deals in the euro area have been domestic. Italy and Germany, which have two of the least concentrated banking sectors within the euro area, have witnessed the largest number of transactions, but very few of these have reached beyond national borders. Cross-border activity has been less frequent since the global financial crisis, comprising rather small deals involving mainly Belgian, French and Dutch banks (see Chart B.3, panel b).
Chart B.3
Domestic M&A deals predominate and often involve a large acquirer and at least one strong bank, while cross-border M&A activity varies markedly across countries
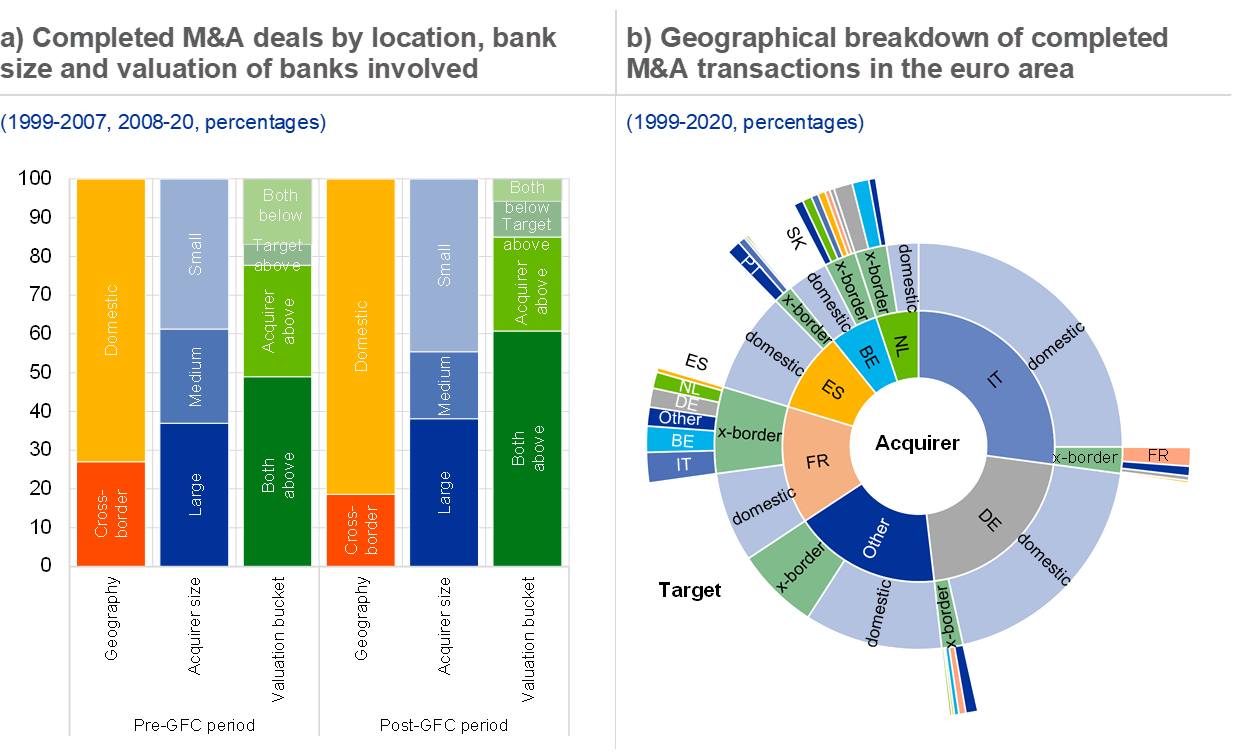
Sources: Dealogic, Orbis Bank Focus, Refinitiv and ECB calculations.
Notes: Panel a: cross-border deals refer to transactions within the euro area. Acquirer size looks at the total assets of the acquirer in the year in which the deal was announced. An acquirer is classified as small with total assets of less than €5 billion, medium-sized with assets of €5-30 billion, and large with assets in excess of €30 billion. Valuation buckets are obtained by running a regression of the price-to-book ratio on the return on equity (ROE) for a sample of 27 listed euro area banks. Using the resulting coefficients, an imputed price-to-book ratio for each acquirer and target involved in a deal is computed using the ROE for the year in which the deal was announced, to also cover non-listed banks which do not have a price-to-book ratio. The imputed price-to-book ratio for each bank is compared with a median computed using a balanced sample of 564 euro area banks with balance sheet data available since 1996. The periods before and after the global financial crisis (GFC) are defined as 1999-2007 and 2008-20 respectively.
3 Drivers of bank mergers
Studies have found that bank mergers and acquisitions follow diverse rationales and have no single dominant motivation. These studies, mostly focused on the 1990s and early 2000s, indicate that mergers often aim at improving profitability and efficiency. More profitable banks were more likely to bid for other, weaker banks, as M&A targets.[4] This also held for cross-border mergers,[5] which were moreover found to occur more frequently when countries were closely linked by a common language or trade, for instance.[6] Banks also engaged in M&As to gain market share and market power, or to diversify revenues.[7] European studies support most of these rationales, finding in particular that smaller and less efficient banks were more likely to be acquired.[8]
Chart B.4
Cross-border deals often mirror existing financial linkages between two countries
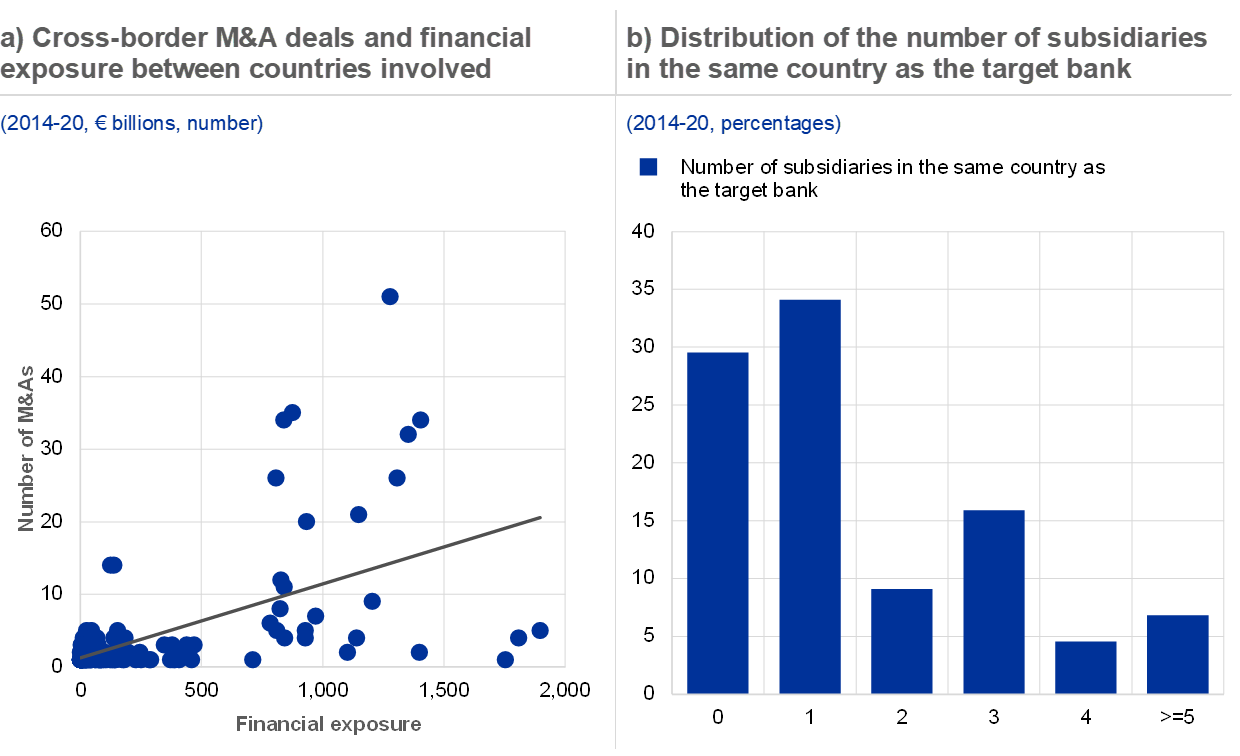
Sources: Dealogic, ECB supervisory data and ECB calculations.
Note: Based on a sample of acquirer and target banks domiciled in all EU countries and the United Kingdom.
Empirical analysis shows that cross-border bank M&A transactions in the euro area tend to follow existing financial links. A gravity model was used to evaluate the determinants of M&A transactions in Europe based on data covering 385 transactions over the period from 2014 to 2020.[9] Stronger links through bilateral interbank loans and securities holdings are associated with a higher number of cross-border M&As (see Chart B.4, panel a). Banks also often tend to acquire targets in countries where they already have a physical presence through subsidiaries,[10] while entry into new countries seems relatively less frequent (see Chart B.4, panel b).
Chart B.5
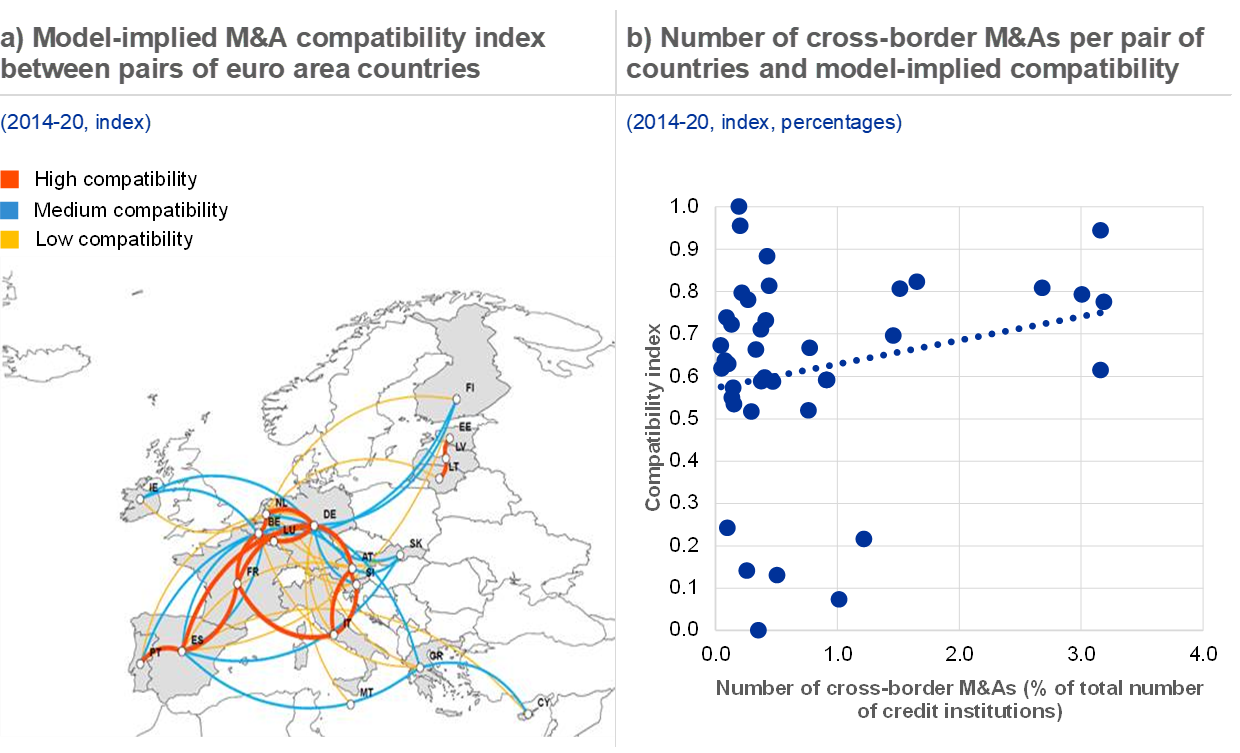
Cross-border transactions are likely to emerge within clusters of euro area countries, but actual transactions do not always follow model-implied compatibility
Sources: CEPII[11], Dealogic, ECB supervisory data, Refinitiv and ECB calculations.
Notes: Panel a: index calculated using the coefficients of a gravity equation and averaged over 2014-20. Following the literature,[12] the gravity equation estimates, at the macro level, the impact of bilateral bank interlinkages, bilateral trade, bilateral migration, distance, common border, common language, common religion, common origin of legal system and difference of time zone on the number of bilateral M&As, using country-year fixed effects. The coefficients obtained are then used to estimate the M&A compatibility of countries and to build the index for each pair of countries. The index is scaled such that the highest compatibility has a value of one and the lowest zero. Links represent the 45 highest values in the index. The values from 1 to 15 are shown in red, from 16 to 30 in blue and from 31 to 45 in yellow. Panel b: the x-axis represents the sum of M&As by pair of countries divided by the sum of credit institutions in the two countries.
Cross-border transactions are more likely to occur within clusters of euro area countries. An M&A compatibility index was constructed using a gravity equation which captures the impact of financial, trade, and cultural linkages on the frequency of bank M&As over the period from 2014 to 2020. It shows that mergers between banks operating in some core euro area countries, including Belgium, Germany, the Netherlands and Austria, are the most probable constellation. Consolidation is deemed likely within two further clusters: French banks are thought likely to engage with banks in neighbouring countries, and Spanish banks are seen as a good fit with their Portuguese peers (see Chart B.5, panel a). By contrast, banks operating in physically distant countries are not so suitable as merger partners. However, the actual frequency of cross-border mergers involving some country pairs seems to lie significantly below model-implied potential (see Chart B.5, panel b). This suggests that factors not captured by the compatibility index, such as the prominence of cooperative and savings banks in a given country, may impede M&A activity, in spite of the strong financial links already existing between the countries involved.
4 Impact on financial performance
While the aggregate effects of mergers on bank performance seem mixed in the literature, they are conditional on sound execution and strategic fit. US studies provide only partial support for M&A-driven improvements in bank profitability or efficiency.[13] A similar picture is painted by many European studies. For example, an analysis of the period prior to the global financial crisis finds that M&A transactions had a moderate but positive impact on the profitability of the banks involved. It also underscores the role of strategic similarities which generate economies of scale as a success factor in bank M&As, while integration of dissimilar banks often proves costly.[14] The positive impact of M&As also appears to be more pronounced when transactions are executed in a financial crisis,[15] as distressed valuations may prove opportune to a well-positioned bidder. At the same time, other studies find that M&As have a slightly negative impact on profitability but a positive impact on cost efficiency. This is interpreted as a sign that cost savings are passed on to customers in a competitive banking market.[16]
Bank profitability following cross-border mergers seems to differ from that following domestic mergers, depending on the timing of the transactions. Mergers completed in the late 1980s and early 1990s tended to generate no clear improvement in ROE, while later cross-border mergers seem to have delivered a superior performance than domestic mergers.[17] Although poor bank performance following cross-border mergers is often a result of problems preceding the transactions, it may also reflect an excessively optimistic price, poor execution and an inability to change the strategic course of the target.[18]
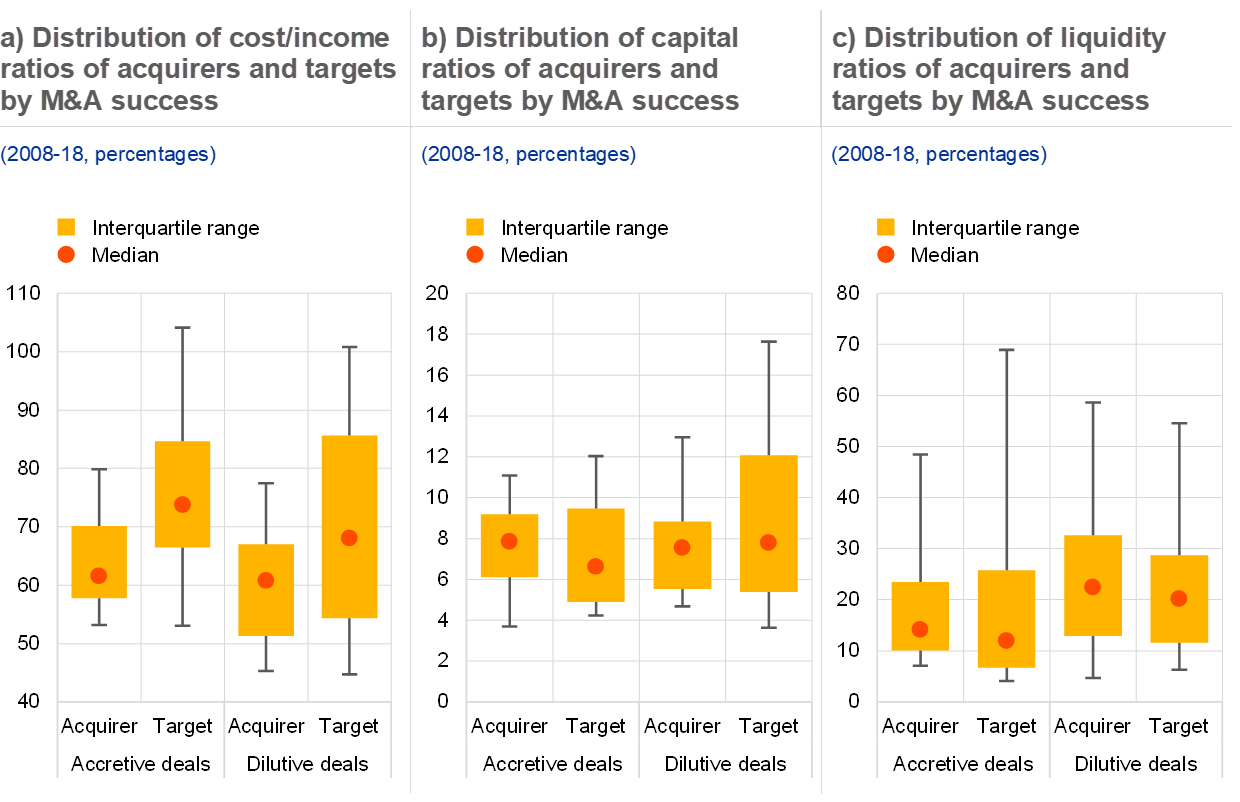
M&A transactions involving banks with weaker capital and liquidity positions and higher cost inefficiencies seem to yield higher post-merger profitability. Before the global financial crisis, ROE improved following about 51% of transactions, rising slightly to 57% after the global financial crisis, as investors became more selective about approving mergers. Mergers involving more cost-efficient banks tend to be less likely to generate improved profitability over a two-year horizon (see Chart B.6, panel a). This indicates that M&As may serve as a catalyst for cost synergies which may be absent from transactions between highly efficient banks. While the link between the capitalisation of M&A participants and merger success is less clear, in the case of profitability-enhancing deals the median capital ratio of the acquirer is higher than that of the target (see Chart B.6, panel b). Finally, M&A transactions involving banks with lower levels of liquidity appear to translate into positive profitability effects (see Chart B.6, panel c), suggesting that higher levels of bank liquidity may deter banks from exploiting business opportunities.
Chart B.6
M&A transactions involving banks with weaker capital and liquidity positions and higher cost inefficiencies seem to yield higher post-merger profitability
Sources: Dealogic, Orbis Bank Focus, ECB and ECB calculations.
Note: Accretive deals are classified as those which resulted in an increase in the ROE of the merged bank over a two-year horizon after the M&A transaction, relative to weighted average ROE, after accounting for the change in the aggregate ROE of the sector. The remaining deals are classified as dilutive. Horizontal lines on the whiskers denote the range between the 10th and the 90th percentile of the distribution.
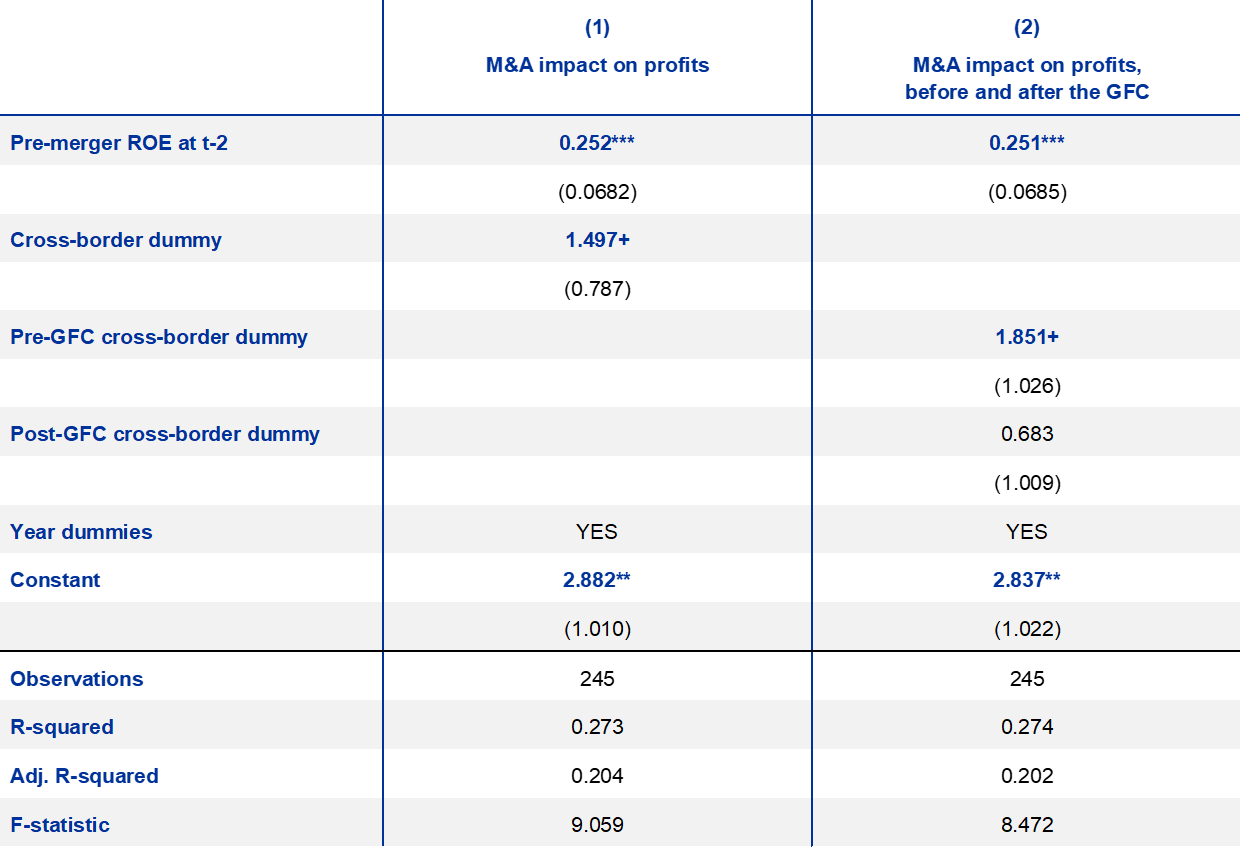
Econometric analysis suggests that on average M&As lead to an improvement in the profitability of the merged entity. Following the methodology applied by Beccalli and Frantz (see footnote 16), the findings indicate that M&A transactions were followed by a statistically significant increase in the ROE of the merged bank after two years, relative to the weighted average of the acquirer and target, and the effect is larger for cross-border mergers (see cross-border dummies reported in Table B.1). However, large variance within this effect indicates that the risk to an M&A’s success may be sizeable. The effect of cross-border mergers seems to have waned over time too.
Table B.1
Cross-border M&A deals are followed by a slight improvement in bank profitability
Regression results explaining the average ROE of the merged bank two years after an M&A
(regression coefficients, standard errors)
Sources: ECB calculations based on Dealogic, Orbis Bank Focus and ECB data.
Notes: Standard errors in parentheses. Significance levels: + p<0.10, * p<0.05, ** p<0.01, *** p<0.001. In line with Beccalli and Frantz (see footnote 16), constants and dummies are interpreted as the average change in ROE following an M&A transaction. GFC: global financial crisis (see notes to Chart B.2).
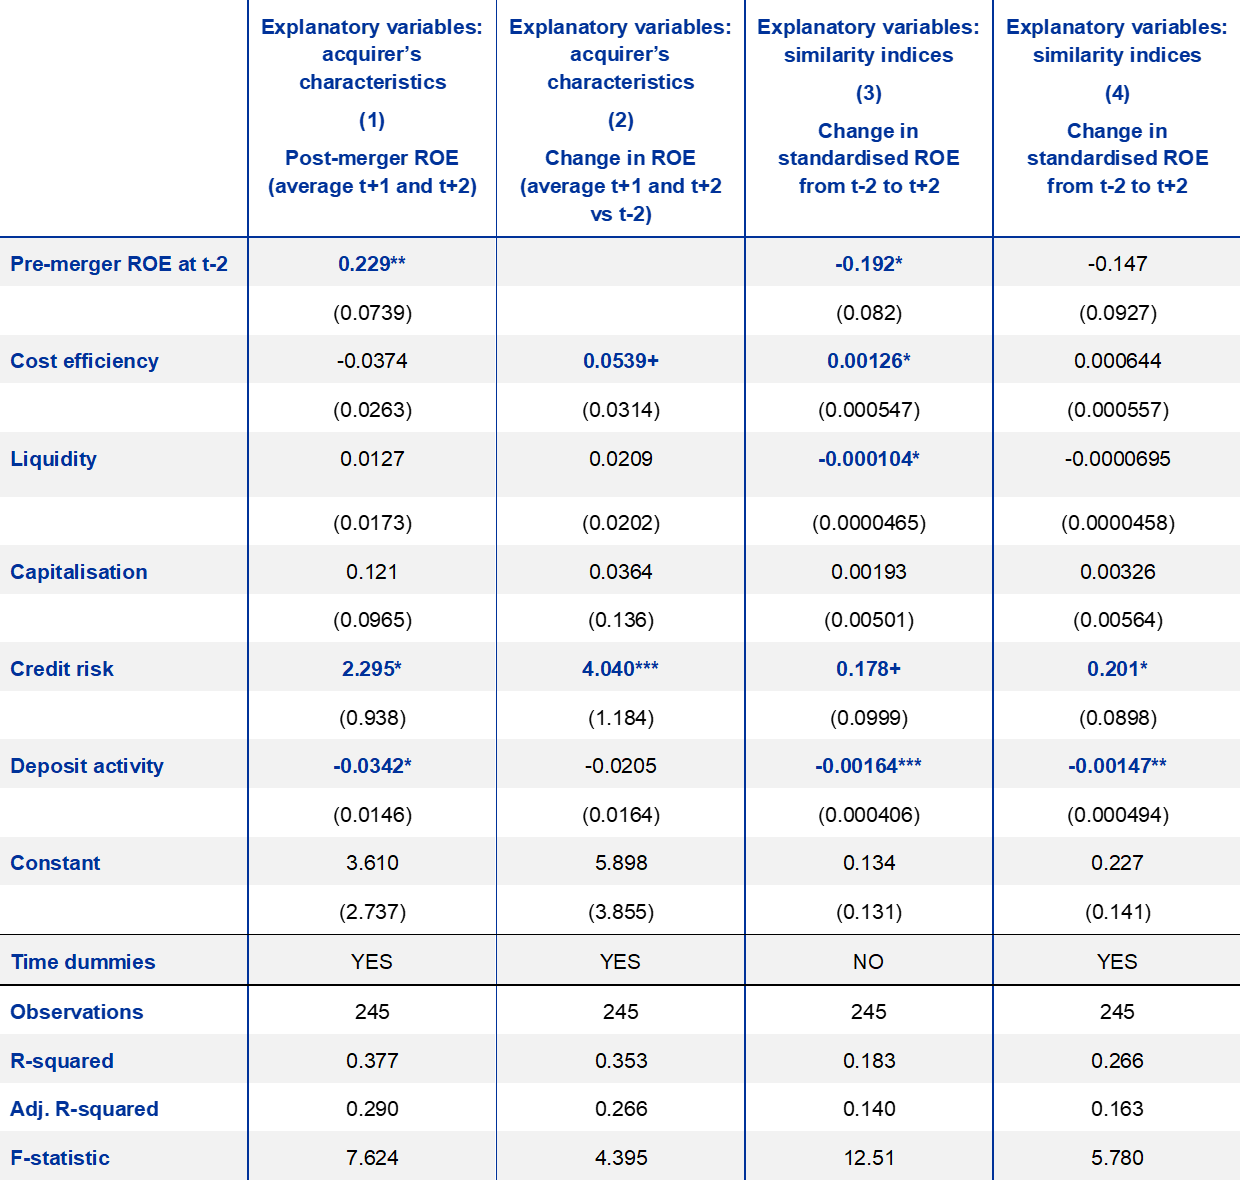
Credit risk and funding structures seem relevant to explaining the improvement in bank profitability after a merger. A study of pre- and post-merger performance in the euro area before 2001 finds that domestic mergers performed better when participating banks were similar, as measured using a similarity index defined as the distance between normalised financial variables of the two banks. However, cross-border mergers enhanced profitability when banks followed diverse lending and credit risk strategies.[19] When mergers over the last two decades are examined, stronger profitability improvements are found for transactions in which one of the sides is burdened by high levels of non-performing loans (see Table B.2). This may point towards acquirers having better capacity to manage credit risk. When two participating banks differ in terms of funding structure, and the acquirer is more reliant on deposit funding, then historically the performance of the combined bank was marginally weaker.
Table B.2
Credit risk and funding structures are associated with higher post-merger profitability
Effect of M&A on profitability depending on characteristics of participating banks
(regression coefficients, standard errors)
Sources: ECB calculations based on Dealogic, Orbis Bank Focus and ECB data.
Notes: Standard errors in parentheses. Significance levels: + p<0.10, * p<0.05, ** p<0.01, *** p<0.001. Similarity indices measure how close banks are to each other in terms of lending and funding strategies, and risk profiles. They are computed by first normalising the bank financial variables and then, for each pair of merging banks, taking the square root of the squared difference between the normalised variables, in line with Altunbas, Y. and Marqués-Ibañez, D., op. cit. The higher the index value, the less similar the two banks are.
5 Conclusions
Bank M&As have recently shown signs of recovery in the euro area after more than a decade of subdued activity. Transactions have focused on consolidation within national borders, and cross-border transactions have remained limited. Larger institutions and banks with stronger fundamentals appear to have played a dominant role as consolidators of the banking market. Cross-border transactions are also likely to follow existing financial links and emerge within clusters of euro area countries.
The empirical results presented in this special feature imply that M&As may lift bank profitability. While they are not the only solution that would raise euro area bank profitability to levels sufficient to cover the cost of capital, M&As have the potential to substantially boost bank returns on equity. However, profitability outcomes vary greatly, underscoring the need to design and execute such transactions well and to assess proposed transactions on their own merit. At the same time, assessment of M&A transactions should also consider the systemic footprint of the combined entity. The room for improving profitability seems larger in cross-border transactions, as well as where participating banks are less cost efficient and targets are burdened by high levels of non-performing loans.
Completion of the banking union, which would address one of the key sources of financial fragmentation, could unlock the potential of cross-border M&A transactions. Although appealing from a profitability perspective, such transactions may be impeded by the limited financial integration of the euro area (see Box A). Analysis of the drivers of cross-border M&As reveals that the single European market remains disjointed, as transactions have been clustered within a few small groups of neighbouring countries. While the supervisory approach to bank mergers has been clarified by the ECB,[20] further harmonisation of the regulatory and supervisory framework could help to overcome the fundamental drivers of fragmentation.
Box A
O-SII buffer calibration and cross-border bank mergers
Buffer requirements for systemically important banks should adjust as the systemic risk of the institution changes, including after a merger or acquisition. Other systemically important institutions (O-SIIs), which are banks considered crucial for the financial system of a Member State or the Union, are required to hold capital buffers to increase their resilience. The O-SII buffer is determined as a function of a bank’s systemic relevance, as captured by the O-SII score, defined in the EBA guidelines[21] as the average of the bank’s size, importance, complexity and interconnectedness scores, as compared to its domestic banking sector. The buffer’s calibration is reviewed every year; O-SII buffers currently represent up to 2.5% of risk-weighted assets.
However, some features of the current calibration regime could unintentionally create disincentives for cross-border mergers. While one of the objectives of the O-SII buffers is to discourage banks from expanding so much that they become too big to fail, this box shows that the O-SII requirements for cross-border bank mergers depend crucially on the location of the head office. The buffer size may be affected by country-specific heterogenous buffer settings and surcharges for cross-border exposure within the banking union.[22]
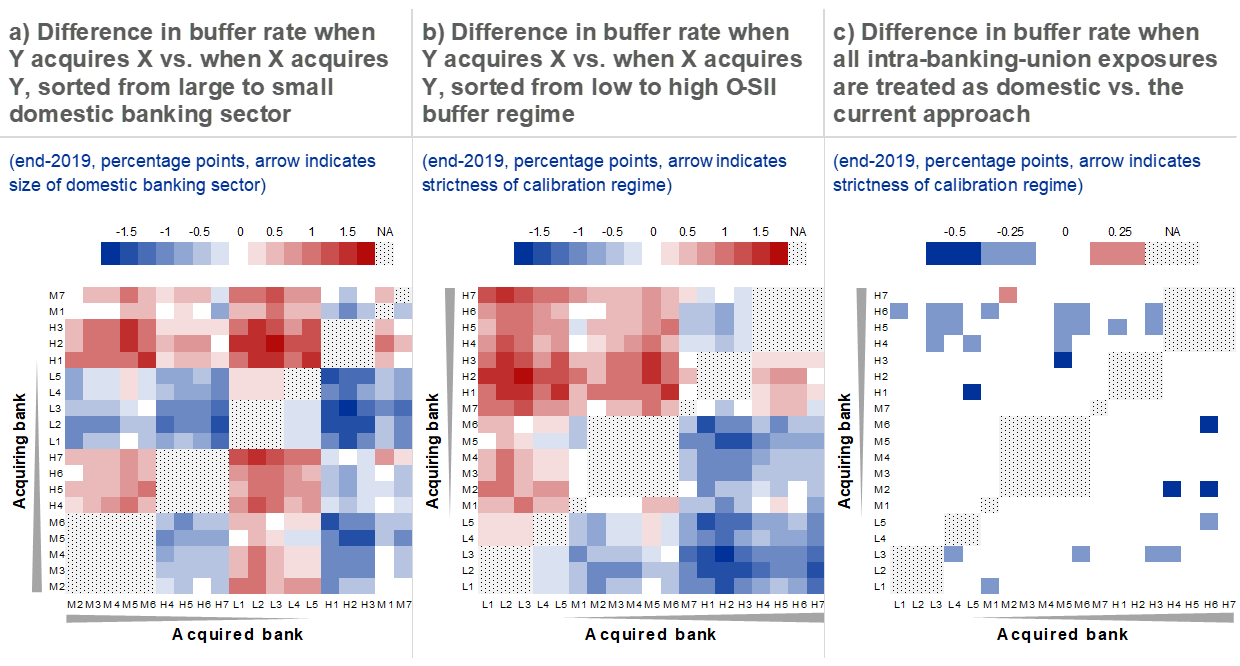
The O-SII buffer requirement for a merged bank can vary significantly, depending on the direction of the merger. There are two country-specific factors that influence the size of the combined bank’s O-SII buffer: the relative size of the acquirer’s banking sector and national buffer-setting practices. The effects of a merger are stronger for acquirers coming from smaller countries, where a large foreign acquisition has a relatively high impact on the score of the combined bank, or for acquirers coming from countries where buffers are set at relatively high levels. The impact of these factors is presented in heat maps (see Chart A, panels a and b) which show the difference in O-SII buffer for a combined bank, depending on which bank is the acquirer. The size differential between the two banking sectors is not systematically aligned with the increase in the buffer rate (see Chart A, panel a). By contrast, buffers are systematically higher when the acquiring country has a stricter calibration regime (see Chart A, panel b). For the largest banks under European banking supervision, the difference in O-SII buffer rate in a hypothetical cross-border merger can be as high as 1.75 percentage points, depending on the direction of the merger. In the banking union, such buffer-setting practices give an advantage to acquirers based in countries where O-SII buffers are set low.
Chart A
O-SII buffers of merged banks depend on the direction of cross-border mergers, and may increase disproportionally for some pairs of banks due to surcharges on intra-banking-union exposure
Sources: National authorities, ECB supervisory data and ECB calculations.
Notes: Panels a) and b) show the difference in O-SII buffer of a merger, depending on which bank was the acquirer. Panel a) is sorted from big to small banking sector, while panel b) is sorted from countries which set low O-SII buffers to countries with high O-SII buffers. Taking the upper left corner in panel a) as an example, the merger between bank M7 and bank M3 has an O-SII buffer which is 0.5 percentage points higher with bank M7 as the acquirer than bank M3 as the acquirer. If banking sector size or the buffer-setting regime were crucial factors determining post-merger O-SII buffers, differences in buffers should be lowest on the diagonal and increase towards the upper left and lower right. Banks are labelled based on the highest possible O-SII buffer in their home country (high: Germany, Netherlands; medium: Belgium, France, Finland; low: Spain, Italy). Domestic mergers are greyed out. Panel c) shows the difference in the post-merger O-SII buffer rates depending on whether the intra-banking-union exposure was treated as domestic exposure or not.
The sample includes the 19 largest banks under European banking supervision in terms of size, at the highest level of consolidation, excluding subsidiaries. O-SII scores are approximated based on FINREP data from end-2019. As the bank sample available to the authors is not complete, where possible the denominator for each category is obtained by regressing the category score from the national O-SII notification on the values from the sub-categories that make up the respective category. If the standard error is larger than 2% of the estimate, a sample-based denominator is used instead, where the sample consists of all banks in the country at the highest level of consolidation. To account for discrepancies between reported scores and calculated scores, the estimated merged score and the SGA score are obtained by applying the percentage change between the calculated non-merged total score and the merged total and SGA score respectively to the reported score. The payments indicator is excluded from the calculation as it is not available from FINREP, and a 50% weight is applied to both private sector deposits from depositors in the EU and private sector loans to recipients in the EU to calculate the importance sub-score. The increase in buffer rates is estimated using methodologies disclosed by the national authorities.
While having less impact than asymmetric O-SII buffer-setting practices, the link between cross-border exposure and the level of the buffer may also be an impediment to some cross-border mergers. A bank’s cross-border exposure, which includes non-domestic exposure within countries participating in European banking supervision, forms one-sixth of the overall O-SII score. Cross-border mergers can therefore inflate the total score of the combined bank more than a domestic merger, as the previous domestic exposure of the acquired bank will become a cross-border exposure. This makes cross-border transactions less attractive than domestic transactions.[23] Under a single rulebook, a single supervisor and a single resolution authority responsible for systemically important banks, however, cross-border exposures within the banking union may no longer be a valid indicator of greater complexity. This has already been recognised by the European legislators in CRD V in the context of globally systemically important institutions.[24] Should that be considered to warrant all exposures towards countries participating in European banking supervision being treated on a par with domestic exposures, the O-SII buffers for some hypothetical mergers would decrease, in some cases by up to 0.5 percentage points (see Chart A, panel c).
- Gardó, S. and Klaus, B., “Overcapacities in banking: measurements, trends and determinants”, Occasional Paper Series, No 236, ECB, November 2019.
- See the box entitled “Market power, competitiveness and financial stability of the euro area banking sector”, Financial Stability Review, ECB, November 2019.
- Fernandez-Bollo, É., Andreeva, D., Grodzicki, M., Handal, L. and Portier, R., “Euro area bank profitability and consolidation”, Financial Stability Review, Banco de España, Vol. 40, 2021, pp. 83-110; Enria, A., Introductory statement at the press conference on the results of the 2019 SREP cycle, Frankfurt, 28 January 2020.
- Berger, A., Demsetz, R. and Strahan, P., “The consolidation of the financial services industry: Causes, consequences, and implications for the future”, Journal of Banking & Finance, Vol. 23, Issue 2-4, 1999, pp. 135-193; Focarelli, D., Panetta, F. and Salleo, C., “Why Do Banks Merge?”, Journal of Money, Credit and Banking, Vol. 34, No 4, 2002, pp. 1047-1066.
- Focarelli, D. and Pozzolo, A.F., “The patterns of cross-border bank mergers and shareholdings in OECD countries”, Journal of Banking & Finance, Vol. 25, Issue 12, 2001, pp. 2305-2337; Caiazza, S., Pozzolo, A.F. and Trovato, G., “Do domestic and cross-border M&As differ? Cross-country evidence from the banking sector”, Applied Financial Economics, Vol. 24, Issue 14, 2014, pp. 967-981.
- Buch, C. and DeLong, G., “Cross-border bank mergers: What lures the rare animal?”, Journal of Banking & Finance, Vol. 28, No 9, 2004, pp. 2077-2102; Gulamhussen, M., Hennart, J.-F. and Pinheiro, C., “What drives cross-border M&As in commercial banking?”, Journal of Banking & Finance, Vol. 72(S), 2016, pp. 6-18.
- Amel, D. and Rhoades, S., “Empirical Evidence on the Motives for Bank Mergers”, Eastern Economic Journal, Vol. 15, Issue 1, 1989, pp. 17-27; Elsas, R., Hackethal, A. and Holzhäuser, M., “The anatomy of bank diversification”, Journal of Banking & Finance, Vol. 34, Issue 6, 2010, pp. 1274-1287. Other literature cautions that managerial incentives can be a powerful driver of M&A activity; see, for instance, Hadlock, C., Houston, J. and Ryngaert, M., “The role of managerial incentives in bank acquisitions”, Journal of Banking & Finance, Vol. 23, Issue 2-4, 1999, pp. 221-249.
- Beccalli, E. and Frantz, P., “The Determinants of Mergers and Acquisitions in Banking”, Journal of Financial Services Research, Vol. 43, Issue 3, 2013, pp. 265-291; “Cross-border mergers and acquisitions in the EU banking sector: drivers and obstacles”, Financial Stability Review, ECB, November 2017, pp. 154-157.
- ECB supervisory data are available only as of 2014, when the Single Supervisory Mechanism became operational. For methodological details and further results, see Lebastard, L., “Finance exposure and bank mergers – Micro and macro evidence from the EU”, forthcoming, 2022.
- A similar conclusion was reached, for central and eastern European countries, by Lanine, G. and Vander Vennet, R., “Microeconomic determinants of acquisitions of Eastern European banks by Western European banks”, The Economics of Transition, Vol. 15, Issue 2, 2007, pp. 285-308.
- CEPII gravity database (the latest data point is for 2019). See also Head, K., Mayer, T. and Ries, J., “The erosion of colonial trade linkages after independence”, Journal of International Economics, Vol. 81, Issue 1, 2010, pp. 1-14; Head, K. and Mayer, T., “Gravity Equations: Workhorse, Toolkit, and Cookbook”, in Gopinath, G., Helpman, E. and Rogoff, K. (eds.), Handbook of International Economics, Vol. 4, Elsevier, 2014, pp. 131-195.
- Di Giovanni, J., “What drives capital flows? The case of cross-border M&A activity and financial deepening”, Journal of International Economics, Vol. 65, Issue 1, 2005, pp. 127-149; Gulamhussen, M., Hennart, J.-F. and Pinheiro, C., op. cit.
- Rhoades, S., “A Summary of Merger Performance Studies in Banking, 1980-93, and an Assessment of the ‘Operating Performance’ and ‘Event Study’ Methodologies”, Staff Studies, No 167, Board of Governors of the Federal Reserve System, 1994; DeLong, G. and DeYoung, R., “Learning by Observing: Information Spillovers in the Execution and Valuation of Commercial Bank M&As”, Journal of Finance, Vol. 62, Issue 1, 2007, pp. 181-216. The literature reviewing the effects of bank mergers and M&A announcements on stock market valuations usually finds that shareholders of target banks tend to benefit from M&A news while shareholder gains of the acquirer are at best limited and often negative.
- Altunbas, Y. and Marqués-Ibañez, D., “Mergers and acquisitions and bank performance in Europe: the role of strategic similarities”, Journal of Economics and Business, Vol. 60, Issue 3, 2008, pp. 204-222.
- Shen, C.-H., Chen, Y., Hsu, H.-H. and Lin, C.-Y., “Banking Crises and Market Timing: Evidence from M&As in the Banking Sector”, Journal of Financial Services Research, Vol. 57, Issue 3, 2020, pp. 315-347.
- Beccalli, E. and Frantz, P., “M&A operations and performance in banking”, Journal of Financial Services Research, Vol. 36, Issue 2, 2009, pp. 203-226; at the national level, M&A transactions were found to improve the cost efficiency of Spanish banks; see Castro, C. and Galán, J.E., “Drivers of Productivity in the Spanish Banking Sector: Recent Evidence”, Journal of Financial Services Research, Vol. 55, 2019, pp. 115-141.
- Vander Vennet, R., “The effect of mergers and acquisitions on the efficiency and profitability of EC credit institutions”, Journal of Banking & Finance, Vol. 20, Issue 9, 1996, pp. 1531-1558; Altunbas, Y. and Marqués-Ibañez, D., op. cit.
- Peek, J., Rosengren, E. and Kasirye, F., “The poor performance of foreign bank subsidiaries: were the problems acquired or created?”, Journal of Banking & Finance, Vol. 23, Issue 2-4, 1999, pp. 579-604.
- Altunbas, Y. and Marqués-Ibañez, D., op. cit.
- Guide on the supervisory approach to consolidation in the banking sector, ECB, January 2021.
- Guidelines on the criteria to determine the conditions of application of Article 131(3) of Directive 2013/36/EU (CRD) in relation to the assessment of other systemically important institutions (O-SIIs) (EBA/GL/2014/10), European Banking Authority, December 2014.
- O-SII buffers are only one of several potential obstacles. Other obstacles to cross-border integration embedded in the European regulatory framework were emphasised in Enria, A., “How can we make the most of an incomplete banking union?”, speech at the Eurofi Financial Forum, Ljubljana, 9 September 2021.
- The framework may further disincentivise mergers within the EU relative to acquisitions of non-EU banks, as two of the indicators used to calculate O-SII scores, total loans to and total deposits from the private sector, are geographically restricted to transactions with counterparties located in the EU.
- For more details, please refer to Fernandez-Bollo, É., Andreeva, D., Grodzicki, M., Handal, L. and Portier, R., “Euro area bank profitability and consolidation”, Financial Stability Review, Banco de España, No 40, 2021.


