Published as part of the ECB Economic Bulletin, Issue 1/2024.
This box analyses corporate vulnerabilities as derived from firm-level replies to the Survey on the Access to Finance of Enterprises (SAFE). A firm is considered vulnerable if it simultaneously reports lower turnover, lower profits, higher interest expenses and a higher or unchanged debt-to-assets ratio over the past six months.[1] The concept is particularly relevant when assessing the implications for the transmission of monetary policy as it provides strong signals on the financial health of firms.
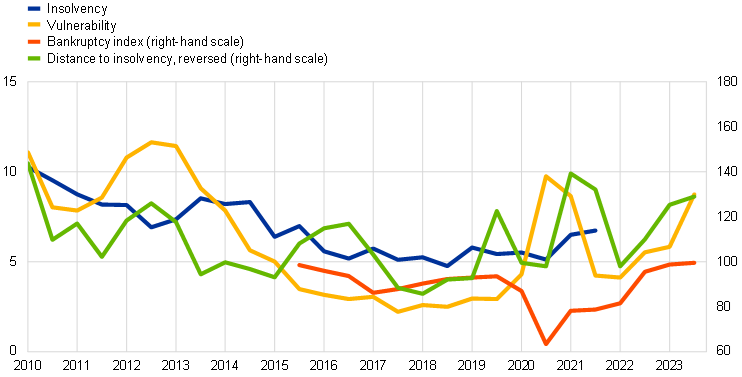
The share of financially vulnerable firms in the SAFE, which is broadly in line with the dynamics in corporate bankruptcies, has increased recently (Chart A). Corporate bankruptcies have been on the rise in the euro area since the second half of 2022. In the second and third quarters of 2023 the bankruptcy declarations index exceeded pre-pandemic levels, reaching its highest level since 2015, when the index first became available.[2] As bankruptcy is the legal process initiated when a firm has been declared insolvent, statistics on bankruptcy represent the tip of the iceberg of firms in financial difficulties. The scale and speed at which firms in financial difficulties become bankrupt also depends on the legislative system in place in each country.
Chart A
Evolution of bankruptcies, corporate insolvencies and vulnerability
(left-hand scale: percentages; right-hand scale: 2015=100)

Sources: ECB and European Commission (SAFE), Eurostat, BvD Orbis, LSEG and ECB calculations.
Notes: Vulnerable firms are defined as firms that simultaneously report lower turnover, decreasing profits, higher interest expenses and a higher or unchanged debt-to-assets ratio. Distance to insolvency is calculated as the inverse of the volatility of a firm’s return on equity based on a sample of large euro area listed firms. Lower values of the measure indicate that firms are closer to insolvency, anticipating future default. The chart displays an inverted distance to insolvency index (2015=100). The number of bankruptcies is shown as an index (2015=100). The insolvency indicator shows the percentage of firms in the SAFE sample which have negative profits and are unable to cover their losses with equity. The chart is plotted at biannual frequency, matching the frequency of the SAFE survey rounds.
In the second and third quarters of 2023, the share of vulnerable firms in the SAFE reached 9%, up from 6% in the previous survey wave. From a historical perspective, the dynamics of the SAFE financial vulnerability indicator are broadly aligned not only with bankruptcies but also with two other indicators of insolvency: (i) a solvency measure based on firm balance sheet data showing the share of firms unable to cover their losses with equity; and (ii) a market-based measure of distance to insolvency.[3],[4] Following the sovereign debt crisis, all indicators began improving from 2012 onwards. At the start of the COVID-19 pandemic in 2020, while the SAFE financial vulnerability indicator and both insolvency indicators were on the rise owing to deteriorating financial positions, firms were shielded from bankruptcy by the provision of government guarantees (in the literature, this is referred to as the “bankruptcy gap”).[5] More recently, like the evolution of bankruptcies and the SAFE financial vulnerability indicator, the distance to insolvency is also pointing to increased corporate distress, although it is lagging the other two indicators.
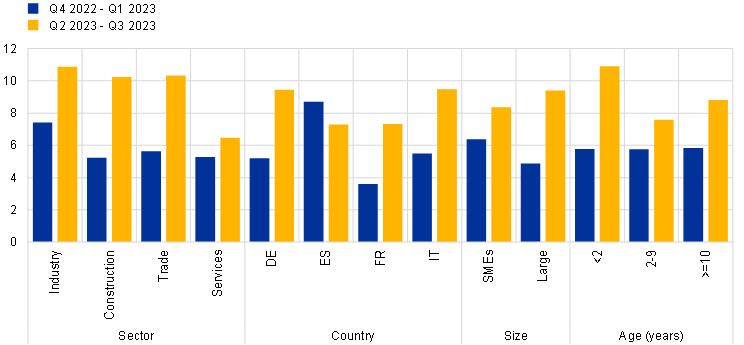
The rise in vulnerabilities in the SAFE in the second and third quarters of 2023 is driven mostly by firms in industry, construction and trade, and vulnerability increased more for large firms than for small and medium-sized enterprises (SMEs) (Chart B). There are substantial heterogeneities in vulnerability across economic sectors and countries and in relation to firm characteristics such as size and age. The share of vulnerable firms increased across all sectors relative to the previous survey round, albeit to varying degrees. It remained relatively low in the services sector (6%) in the second and third quarters of 2023, while reaching somewhat higher levels in industry (11%), construction (10%) and trade (10%). Across the four big euro area countries, Italy and Germany have the highest share of vulnerable firms (9%). Both of these countries have also seen a substantial increase in this share recently, reflecting their relatively high share of industrial firms. The share of vulnerable firms has increased more among large firms than among SMEs compared with the previous survey round, even though SMEs historically tend to be more financially fragile.[6] In addition, the share of vulnerable firms has increased more among young firms than among older firms recently.
Chart B
Heterogeneity in corporate vulnerability in the SAFE
(percentages)

Sources: ECB and European Commission (SAFE) and ECB calculations.
Notes: The bars show the share of vulnerable firms across sectors, countries, firm size and firm age in the last two rounds of the SAFE (Q4 2022-Q1 2023 and Q2 2023-Q3 2023).
Increases in interest expenses are important in explaining the likelihood of firms becoming vulnerable (Chart C). Reduced-form regressions are performed to investigate which balance sheet characteristics are most relevant to firms becoming vulnerable. The analysis suggests that, for the sample of firms in SAFE with balance sheet information for the period 2010-2021, on average a 1 percentage point increase in interest paid as a share of profits increases the probability of becoming vulnerable by 12%. Changes in debt, turnover or profits have a much smaller impact on the probability of becoming vulnerable. This suggest that increases in interest rates, which are needed to bring down inflation from very elevated levels, could affect economic activity via their impact on firms. In fact, as explained below, vulnerable firms invest less than non-vulnerable ones.
Chart C
Corporate vulnerability in SAFE and its drivers
(percentages)

Sources: ECB and European Commission (SAFE), BvD Orbis and ECB calculations.
Notes: The chart plots regression coefficients for average marginal effects, showing the impact of turnover, profits, interest expenses and debt on the probability of a firm becoming vulnerable. Interest expenses are measured as total interest paid over profits before tax; profits are measured as net income over sales; turnover is defined as sales over total assets; and debt is defined as total debt over total assets. Regressions contain country, time, firm size and industry fixed effects. Whiskers represent 95% confidence intervals. The sample covers SAFE firms with financial statements for the period 2010-2021.
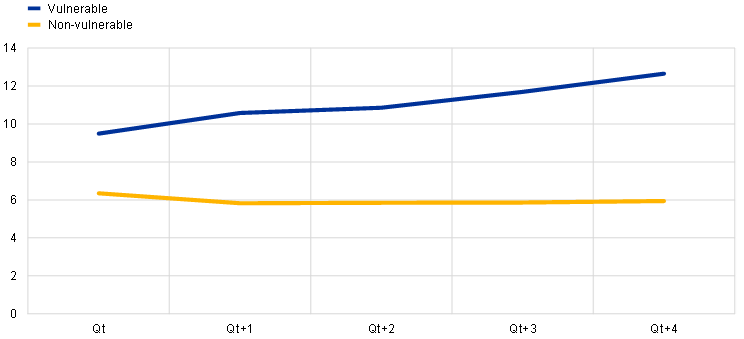
Vulnerable firms in the SAFE are more likely to have non-performing loans than non-vulnerable firms (Chart D). Looking at past survey rounds, on average, around 10% of vulnerable firms in the SAFE already had non-performing bank loans in the quarter in which they were surveyed and considered vulnerable. Following the progress of vulnerable firms for four quarters after they were identified as vulnerable in the survey shows that the share of vulnerable firms with non-performing loans increases, reaching on average up to 13% one year after the firm was identified as vulnerable. In contrast, only around 6% of non-vulnerable firms had non-performing loans across past survey waves, and this share stays stable in the quarters following the survey. This finding confirms that vulnerability weighs heavily on firms’ debt servicing capacity.
Chart D
Share of vulnerable and non-vulnerable firms with non-performing loans
(percentages)

Sources: ECB and European Commission (SAFE), AnaCredit and ECB calculations.
Notes: The chart shows the average share of vulnerable and non-vulnerable firms with non-performing exposures as reported in AnaCredit (the euro area credit register) over survey rounds 20 (October 2018-March 2019) to 27 (April 2022-September 2022). At Qt the chart shows the average share of firms with non-performing exposures for the last quarter of the respective survey round for vulnerable and non-vulnerable firms in the SAFE. These firms are then followed for four additional quarters after the initial survey round (Qt+1 to Qt+4).
Balance sheet data for firms in the SAFE confirm that vulnerability has implications for the future investment and employment decisions of firms (Chart E). By focusing on the sample of firms in SAFE with balance sheet information for the period 2010-2021, simple regressions controlling for firm fundamentals and a set of structural fixed effects show that vulnerability according to the SAFE indicator is associated with holding lower working capital. This confirms the short-term distress of vulnerable firms. Moreover, vulnerability is also associated with both lower future fixed investment and lower future employment. Relative to non-vulnerable firms, vulnerable firms have on average a 4 percentage point lower investment rate and a 5 percentage point lower growth in employment. This indicates that changes in the fragility of firms, as reported via firms’ own perceptions, are related to real economic outcomes.
Chart E
Corporate vulnerability in SAFE and firm outcomes
(percentage points)

Sources: ECB and European Commission (SAFE), BvD Orbis and ECB calculations.
Notes: The regressions show the impact of firm vulnerability in period t on working capital, fixed investment and employment in period t+1. Working capital is the difference between current assets and liabilities over total assets; investment is the change in fixed assets over total fixed assets; employment is the change in the number of employees over the total number of employees. Regressions include firm controls (profits over total assets and long-term debt over total debt) and country, wave, industry and firm size fixed effects. Whiskers represent 95% confidence intervals. The sample covers SAFE firms with financial statements for the period 2010-2021.
The aggregate SAFE financial vulnerability indicator is the survey-weighted share of vulnerable firms in the sample, where the weights ensure the representativeness of the results in each size class, economic activity and country for the underlying population of firms.
The bankruptcy declarations index is based on the absolute number of bankruptcies reported to Eurostat by EU Member States (on a voluntary basis until the fourth quarter of 2020 and on a mandatory basis since the first quarter of 2021). The base year for the index is 2015.
The insolvency indicator shows the percentage of firms in the SAFE sample which have negative profits and are unable to cover their losses with equity (see Lalinski, T. and Pal, R., “Efficiency and effectiveness of the COVID-19 government support: Evidence from firm-level data”, EIB Working Paper, No 6, European Investment Bank, June 2021). Owing to the publication lag for balance sheet data, the latest available year with full coverage of enterprises for this indicator is 2021.
Distance to insolvency is calculated as the inverse of the volatility of a firm’s return on equity based on a sample of large euro area listed firms. For more detail, see Ampudia, M., Busetto, F. and Fornari, F., “Chronicle of a death foretold: does higher volatility anticipate corporate default?”, Working Paper Series, No 2749, ECB, November 2022.
See Banerjee, R., Noss, J. and Vidal Pastor, J.M., “Liquidity to solvency: transition cancelled or postponed?”, BIS Bulletin, No 40, Bank for International Settlements, March 2021.
In general, SMEs are considered more fragile as their activities are less diversified and flexible and they are less capital intensive and therefore more reliant on external financing. See Udell, G., “SME Access to Finance and the Global Financial Crisis”, Journal of Financial Management, Markets and Institutions, Vol. 8, No 1, 2040003, August 2020.


