
1 Overview of the results
This report presents the main results of the 36th round of the Survey on the Access to Finance of Enterprises (SAFE) in the euro area, which was conducted between 27 August and 3 October 2025. In this survey round, firms were asked about economic and financing developments over two different reference periods. Around half of firms were asked about changes in the period between April 2025 and September 2025. The remainder, all from the 12 largest euro area countries, were asked about changes in the period between July and September 2025.[1] Altogether, the sample comprised 10,225 firms in the euro area, of which 9,527 (93%) had fewer than 250 employees.[2]
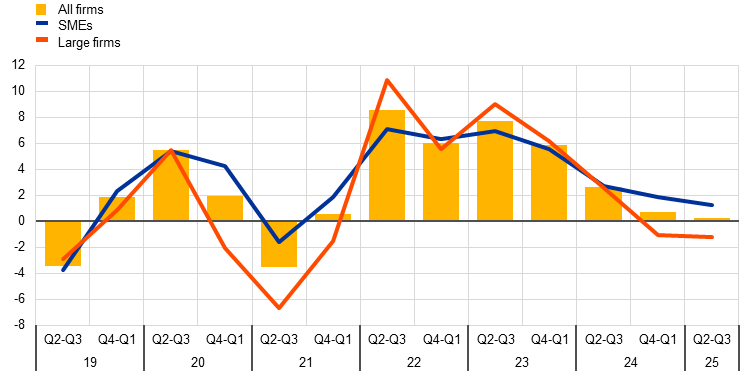
An indicator of overall firms’ financing conditions constructed using firms’ responses shows a slight tightening (Chart A in this section). The indicator reflects firms’ perceptions of price terms and conditions of financing, including changes in bank interest rates and other bank-related costs such as charges, fees and commissions. It is one of three “principal components” capturing how euro area firms view overall financing conditions, alongside non-price terms and conditions and their broader financial position.[3] In this survey round, the indicator’s sharp decline from the peak in 2023 came to an end, showing a slight tightening in firms’ overall financing conditions in the third quarter of 2025. Across firm sizes, both SMEs and large firms reported a tightening impulse, reversing the easing observed among large firms in the previous quarter.
The survey results indicate that bank lending conditions have tightened marginally, with firms reporting a small net increase in interest rates charged on bank loans, following significant declines in the previous two waves. A net 2% of firms reported an increase in bank interest rates, compared with 14% reporting a decline in the previous quarter (Chart 1 in Section 2). In this quarter, large firms indicated a decline in interest rates in net terms (‑3%, from ‑31% in the previous round), while small and medium-sized enterprises (SMEs) indicated a small net tightening in bank loan interest rates (5%, from 2% in the previous round). In net terms, both large and small firms reported a further slight tightening in other loan conditions related to both price and non-price factors.
Chart A
Change in price terms and conditions as perceived by euro area firms
 |
|---|
Base: Firms that applied for a bank loan.
Notes: Indicator derived from factor analysis. For details of the analysis see footnote 2. The indicator is based on firm-level survey replies from 2019 to the third quarter of 2025, using the replies on changes in the previous six months up to the third quarter of 2023 and on changes in the previous three months thereafter. The aggregate indicators are the average of firm-level scores, weighted by size, economic activity and country. Positive values indicate a deterioration in firms’ financing conditions. The individual scores have a range of between -100 and 100.
Firms reported broadly unchanged needs for and availability of bank loans (Table 1, columns 2, 6, and 10 at the end of this section and Chart 2 in Section 2). In the third quarter of 2025, firms indicated unchanged needs for bank loans (net 0% compared with -1% in the previous quarter), while a net 1% of firms reported a decline in bank loan availability (down from 1% reporting an improvement in the previous quarter). As a result, the euro area bank loan financing gap indicator – an index capturing the difference between changes in needs and availability – stood at a net ‑1% (from a net 1% in the previous quarter). Looking ahead, firms expect the availability of external financing to remain broadly unchanged over the next three months, marking a less optimistic outlook than in the previous survey round.
Firms continued to perceive the general economic outlook to be the main factor constraining the availability of external financing (Chart 7 in Section 2). In the third quarter of 2025, a net 19% of firms reported that a worsening in the general economic outlook had negatively affected the availability of external financing, from a net 17% in the second quarter of 2025. Firms reported a somewhat more negative impact of their firm-specific outlook on financing availability.
Financing from external and internal sources continued to be used primarily for fixed investment and for inventories and working capital (Chart 5). Fixed investment remained the most common use of financing (39% of firms), particularly among large firms, while usage among SMEs showed a slight decline (28%, down from 31%). Financing for inventories and working capital remained broadly stable (a net 37% of firms), suggesting no significant supply constraints. Overall, the purposes of financing remained consistent with the previous survey round.
Firms remained optimistic about banks' willingness to lend, but less so than in the previous survey round (Chart 8 in Section 2). On balance, 2% of firms reported an improvement in banks’ willingness to lend, down from 6% in the previous survey round. This decline was driven both by SMEs and large firms.
The share of firms applying for bank loans fell, mainly due to high levels of internal funds (Chart 9 in Section 2). In the third quarter of 2025, the share of bank loan applications fell to 17%, 6 percentage points lower than in the previous quarter. The most frequently cited reason reported for not applying for a bank loan was that firms considered their internal funds to be sufficient to support their business plans.
The percentage of firms reporting obstacles to obtaining a bank loan continued to stand at low levels. 5% of firms that considered bank loans relevant for their firm faced obstacles when seeking to obtain a loan, unchanged from the previous quarter (Table 1, columns 11 and 12 in this section, and Chart 10 in Section 2).
Over the last three months firms reported no change in turnover but continue to have optimistic turnover expectations for the next quarter. On balance, firms reported no change in turnover in the third quarter of 2025, after a net 8% signalled increases in the previous quarter (Chart 11 in Section 3). Large firms indicated improvements in turnover, while SMEs signalled declines. Firms, especially large ones, continue to have optimistic turnover expectations in the third quarter of 2025.
Firms continued to signal a deterioration in profits. A net 13% of firms reported a decline in profits in the third quarter of 2025, similar to the second quarter. The decline was more widespread among SMEs than among large firms.
Over the past three months, the share of financially vulnerable firms was low and similar to that reported in the previous quarter (Chart 12 in Section 3). Only 3% of firms experienced significant difficulties in managing their businesses and servicing their debts during this period.
More enterprises reported an increase in investment over the last three months, but they were slightly less optimistic about future developments in investment (Chart 13 in Section 3). A net 8% of firms indicated a rise in investment in the third quarter of 2025 (up from a net 3% in the previous quarter). This is close to their expectations a quarter earlier. Across size classes, a net 5% of SMEs reported an increase in investment (from 4% in the previous quarter). In net terms, substantially more large firms indicated an increase in investment than in the previous quarter (a net 14%, up from 1%). Looking ahead, firms are slightly less optimistic about raising future investment than they were in the previous quarter. A net 8% of firms expect an increase in investment in the fourth quarter of 2025 (5% of SMEs and 14% of large firms), compared with 10% in the previous quarter.
The availability of skilled labour, production and labour costs remain major concerns limiting production (Chart 14 in Section 3). Over the past six months, the availability of skilled labour continued to be the most widely reported major concern (signalled by 63% of firms). Firms also highlighted finding customers (53%) and competition (45%) as major concerns, signalling that trade policy uncertainty was affecting their business decisions. Across size classes, large firms tended to be more concerned than SMEs, particularly about factors closely related to the ongoing uncertainty surrounding trade policy.
Firms expected stronger increases in selling prices, wages and non-labour input costs over the next 12 months (Charts 15-17 in Section 3). Selling prices are expected to rise by 2.9% on average over the next 12 months, up from 2.5% in the previous survey round, while expectations for wage increases stood at 3.0% (up from 2.8%). Across firm sizes, SMEs continued to report higher expectations for selling prices, wages and non-labour input costs than large firms. Comparing developments across sectors, firms in construction and services expected larger selling price increases than firms in trade and industry. The average expected employment growth was slightly lower than in the previous round (0.9%, from 1.3%).
Euro area firms’ median inflation expectations remained at 2.5% for the one-year horizon and at 3% for the three and five-year horizons (Chart 18 in Section 3.4). Across size classes, large firms increased their median one-year-ahead inflation expectations to 2.4%, from 2.2% in the previous survey round, while SMEs continued to report a figure of 2.9%. For the three-year horizon, SMEs did not revise their expectations (stable at 3.1%), while large firms slightly decreased their expectations (to 2.5%, down from 2.6% in the previous survey round). SMEs raised their inflation expectations to 3.8% (from 3.2%) for the five-year horizon, while for large firms they decreased (to 2.7%, down from 2.9%).
The balance of risks around their long-term inflation outlook is similar to the previous round (Chart 20 in Section 3.4). In total, 53% of firms perceived upside risks to their own inflation outlook five years ahead (up from 52%), while 33% perceived risks to be balanced and 14% saw risks to the downside. For both large firms and SMEs, risks remain clearly tilted to the upside.
Table 1
Latest developments in SAFE country results for euro area firms
(net percentages and percentages of respondents)
Needs | Availability | Financing gap (bank loans) | Financing obstacles | Vulnerable firms | ||||||||||
|---|---|---|---|---|---|---|---|---|---|---|---|---|---|---|
Bank loans | Credit lines | Bank loans | Credit lines | |||||||||||
(1) | (2) | (3) | (4) | (5) | (6) | (7) | (8) | (9) | (10) | (11) | (12) | (13) | (14) | |
Q2 2025 | Q3 2025 | Q2 2025 | Q3 2025 | Q2 2025 | Q3 2025 | Q2 2025 | Q3 2025 | Q2 2025 | Q3 2025 | Q2 2025 | Q3 2025 | Q2 2025 | Q3 2025 | |
Euro area | -1 | 0 | 7 | 8 | 1 | -1 | 2 | 1 | -1 | 1 | 5 | 5 | 3 | 3 |
BE | -1 | -3 | 4 | 11 | -3 | -7 | -2 | -1 | 2 | 3 | 3 | 2 | 3 | 8 |
DE | -8 | -1 | 10 | 16 | -6 | -12 | -5 | -4 | 2 | 8 | 6 | 6 | 2 | 3 |
IE | 3 | 2 | 19 | 13 | 3 | 3 | 14 | 9 | -5 | -1 | 2 | 8 | 6 | 3 |
GR | 14 | 13 | 11 | 13 | 14 | 12 | 5 | 8 | 0 | -1 | 10 | 11 | 2 | 2 |
ES | -6 | 1 | 9 | 8 | 14 | 10 | 13 | 7 | -12 | -6 | 3 | 5 | 2 | 2 |
FR | 4 | -1 | 3 | 0 | -2 | 1 | -5 | 1 | 3 | 0 | 4 | 3 | 5 | 3 |
IT | 7 | 8 | 6 | 3 | 6 | 7 | 9 | 3 | 0 | 0 | 4 | 3 | 2 | 4 |
NL | -16 | -18 | -3 | -2 | -1 | -3 | 3 | 5 | -8 | -8 | 3 | 2 | 2 | 3 |
AT | -8 | -4 | 3 | 4 | 6 | -3 | 8 | -1 | -10 | 0 | 4 | 2 | 2 | 4 |
PT | -5 | -2 | 3 | 0 | 6 | 11 | 3 | 9 | -4 | -8 | 6 | 4 | 2 | 3 |
SK | -4 | 6 | 13 | 10 | 5 | -4 | 1 | -4 | -7 | 5 | 7 | 10 | 4 | 11 |
FI | 9 | 3 | 12 | 16 | -16 | -18 | -14 | -24 | 12 | 12 | 16 | 19 | 6 | 6 |
Notes: For the “financing gap”, see the notes to Chart 2; for “financing obstacles”, see the notes to Chart 10; for “vulnerable firms”, see the notes to Chart 12. “Q2 2025” refers to round 35 (April-June 2025) and “Q3 2025” refers to round 36 (July-September 2025). Financing obstacles and vulnerable firms refer to the percentages of respondents, while the other indicators in the table are expressed in net percentages.
2 Firms’ financing conditions
2.1 Firms reported a small net tightening in the interest rates on bank loans
In this survey round, firms observed a small net tightening in bank loan interest rates and a continued tightening of other loan conditions (Chart 1). In the third quarter of 2025 a net 2% of firms reported an increase in bank loan interest rates, while a net 14% of firms indicated a decrease in interest rates in the previous quarter. Few large firms indicated a net decline in interest rates (3%, down from 31% in the previous round), while SMEs indicated a small net tightening in bank loan interest rates (5%, down from 2% in the previous round). Meanwhile, a net 23% of firms (from 16% in the second quarter of 2025) reported an increase in other financing costs, such as charges, fees and commissions, and a net 16% of firms (from 11% in the previous quarter) reported stricter collateral requirements. The share of large firms indicating stricter collateral requirements increased, while that of SMEs remained unchanged. For firms reporting on the past six months, the net percentages of firms indicating increasing interest rates (5%, from 11% that were reporting decreases in the previous six months) and increases in other costs (in net terms, 23%, from 22%) were similar to those for firms reporting on the previous three months.
Chart 1
Changes in the terms and conditions of bank financing for euro area firms
(net percentages of respondents)

Base: Firms that had applied for bank loans (including subsidised bank loans), credit lines, or bank or credit card overdrafts. The figures refer to rounds 27 to 36 of the survey (April-September 2022 to April-September 2025).
Notes: Net percentages are the difference between the percentage of enterprises reporting an increase for a given factor and the percentage reporting a decrease. The data included in the chart refer to Question 10 of the survey. The grey panels represent responses to the same question for three-monthly reference periods, whereas the white panels relate to six-monthly reference periods.
2.2 Broadly unchanged needs and availability left the bank loan financing gap unchanged
Firms indicated unchanged needs for bank loans (Chart 2). In the third quarter of 2025, firms reported unchanged needs for bank loans (a net 0%, compared with -1% in the previous quarter), with large firms indicating increasing needs (a net 3%, from a net 2% indicating a decrease in the previous quarter) while SMEs’ reported needs were broadly unchanged (a net ‑2%, from 1% indicating decreasing needs in the previous quarter).
The availability of bank loans perceived by firms was broadly unchanged as well (Chart 2). The net percentage of firms reporting a decline in the availability of bank loans was 1% (from 1% indicating an increase in the previous quarter). SMEs observed a small decline in the availability of bank loans (a net -2%, down from a net 1% perceiving an increase in the previous quarter), while large firms saw availability as unchanged (a net 0%). These developments are echoed by the slight net tightening of credit standards in loans or credit lines granted to firms in the third quarter of 2025, as highlighted in the euro area bank lending survey during the same period. Accordingly, the bank loan financing gap indicator – an index capturing the difference between changes in needs and availability – was broadly unchanged (a net 1%, compared with a net -1% of firms experiencing a decrease in the financing gap in the previous quarter). Across size classes, both SMEs and large firms indicated that bank loan availability exceeded their needs, resulting in a positive financing gap of 1%. Firms reporting over the last six months appear to be more optimistic about changes in bank loan availability although they also report lower needs. As a result, the financing gap for the past six months stands at -1%.
Chart 2
Changes in euro area firms’ financing needs and the availability of bank loans
(net percentages of respondents)

Base: Firms for which the instrument in question is relevant (i.e. they have used it or considered using it). Respondents replying “not applicable” or “don’t know” are excluded. The figures refer to rounds 27 to 36 of the survey (April-September 2022 to April-September 2025).
Notes: The financing gap indicator combines both financing needs and the availability of bank loans at firm level. The indicator of the perceived change in the financing gap takes a value of 1 (-1) if the need increases (decreases) and availability decreases (increases). If firms perceive only a one-sided increase (decrease) in the financing gap, the variable is assigned a value of 0.5 (-0.5). A positive value for the indicator points to a widening of the financing gap. Values are multiplied by 100 to obtain weighted net balances in percentages. The data included in the chart refer to Questions 5 and 9 of the survey. The grey panels represent responses to the same question for three-monthly reference periods, whereas the white panels relate to six-monthly reference periods.
Firms reported increasing needs for trade credit, albeit less so than in the previous quarter, with some increases in availability (Chart 3). A net 1% of companies reported a higher need for trade credit, down from a net 7% in the previous quarter. At the same time, a net 2% of firms (down from 5% in the previous quarter) signalled increased trade credit availability.
More firms reported an increased need for credit lines, while availability remained broadly unchanged (Chart 3). In this survey round, a net 8% of firms reported an increased need for credit lines (from a net 7% in the second quarter of 2025), while continuing to signal broadly unchanged credit line availability (a net 1%).
Chart 3
Changes in euro area firms’ financing needs and the availability of trade credit and credit lines
(net percentages of respondents)

Base: Firms for which the instrument in question is relevant (i.e. they have used it or considered using it). Respondents replying “not applicable” or “don’t know” are excluded. The figures refer to rounds 27 to 36 of the survey (April-September 2022 to April-September 2025).
Notes: For a description of the indicator, see the notes to Chart 2. The data included in the chart refer to Questions 5 and 9 of the survey. The grey panels represent responses to the same question for three-monthly reference periods, whereas the white panels relate to six-monthly reference periods.
The composite financing gap indicator – which includes bank loans, credit lines and trade credit as well as debt securities and equity – remained broadly unchanged (Chart 4). A net 0% of firms signalled a change in the composite financing gap, from a net 1% in the previous six months, which covered the fourth quarter of 2024 and the first quarter of 2025. This small decline reflects smaller, albeit still positive, financing gaps for all financial instruments, except for bank loans, which showed a net -1%. Across size classes, SMEs indicated a positive composite financing gap of 1%, while large firms reported a gap of -1%, as in the previous six months.
Chart 4
Changes in the composite financing gap for euro area firms
(net percentages of respondents)
Base: All firms.
Notes: The financing gap indicators combine both financing needs and the availability of bank loans, trade credit, equity, debt securities and credit lines at firm level. For each of the five financing instruments, the indicator of the perceived change in the financing gap takes a value of 1 (-1) if the need increases (decreases) and the availability decreases (increases). If firms perceive only a one-sided increase (decrease) in the financing gap, the variable is assigned a value of 0.5 (-0.5). The composite financing gap is computed at firm level by adding together the financing gaps for each relevant source of financing and then dividing this total by the number of these sources. A positive value for the indicator points to an increase in the financing gap. Values are multiplied by 100 to obtain weighted net balances in percentages. The data included in the chart refer to Questions 5 and 9 of the survey. The latest observation is for round 36 (April 2025-September 2025) of the survey.
2.3 Firms used financing primarily for fixed investment and for inventories and working capital
Financing from external and internal sources continued to be used primarily for fixed investment, as well as for inventories and working capital (Chart 5). Fixed investment remained the most common purpose of financing, cited by 39% of firms, unchanged from the previous quarter. This was followed by inventories and working capital, as reported by 37% of firms, slightly down from the figure of 39% in the previous round. Large firms were more likely to use external financing for fixed investment, with their share increasing from 54% to 57% compared with the previous survey round. By contrast, the share of SMEs using financing for fixed investment declined slightly from 31% to 28%. The proportion of firms using financing for inventories and working capital remained broadly stable, suggesting no major supply bottlenecks. Overall, the usage of financing among firms reporting on the past six months was similar to that of firms reporting on the past three months.
Chart 5
Purpose of financing as reported by euro area firms
(percentages of respondents)

Base: All firms. The figures refer to rounds 27 to 36 of the survey (April-September 2022 to April-September 2025).
Note: The data included in the chart refer to Question 6A of the survey.
2.4 Firms expect the availability of external financing to remain broadly unchanged
Looking ahead, firms expect the availability of external financing to remain broadly unchanged over the next three months, marking a less optimistic outlook than in the previous survey round (Chart 6). A net 0% of firms anticipate improved access to bank loans (down from 4% in the previous quarter) and a net 1% foresee better availability of credit lines and trade credit, compared with 5% and 3% in the previous quarter. Expectations of external financing availability were broadly unchanged across firm sizes. Over the next six months, firms remain generally optimistic, except for bank loans and credit lines, where a net 1% of SMEs expect a deterioration, possibly reflecting concerns about weakening business activity.
Chart 6
Changes in euro area firms' expectations regarding the availability of financing
(net percentages of respondents)

Base: Firms for which the instrument in question is relevant (i.e. they have used it or considered using it). The figures refer to rounds 27 to 36 of the survey (April-September 2022 to April-September 2025).
Notes: See the notes to Chart 1. The data included in the chart refer to Questions 9 and 23 of the survey. The expectation line has been shifted forward by one period to allow for direct comparison with realisations. The grey panels represent responses to the same question for three-monthly reference periods, whereas the white panels relate to six-monthly reference periods.
2.5 Enterprises perceived the general economic outlook as weighing on the availability of external finance
Firms continued to view the general economic outlook as the main factor constraining the availability of external financing (Chart 7). In the third quarter of 2025, a net 19% of firms reported that a worsening general economic outlook had negatively affected the availability of external financing, compared with a net 17% in the second quarter of 2025. SMEs remained more pessimistic than large firms, with a net 20% citing a negative impact from the general economic outlook (up from 18%), compared with a net 18% among large firms (up from 15%). At the same time, a net 6% of firms indicated that the impact of their firm-specific outlook, in terms of sales and profits, on the availability of external financing was worsening (up from 3% in the previous survey round). By firm size, SMEs (a net 7%) and large firms (a net 2%) both reported a less favourable influence from their individual business outlook, reflecting a more pessimistic assessment than in the previous quarter. Firms continued to signal an improvement in the impact of their own capital position (a net 8%, from a net 10% in the previous quarter) and creditworthiness on the availability of external financing (a net 13%, slightly up from 12% in the previous quarter), mainly driven by large firms (Chart 8). Overall, firms reported a similar overall sentiment as regards the factors affecting the availability of external finance over the past six months.
Chart 7
Changes in factors that have an impact on the availability of external financing for euro area firms (general economic outlook, firm-specific outlook and firms’ own capital)
(net percentages of respondents)

Base: All firms. The figures refer to rounds 27 to 36 of the survey (April-September 2022 to April-September 2025).
Notes: See the notes to Chart 1. The data included in the chart refer to Question 11 of the survey. The grey panels represent responses to the same question for three-monthly reference periods, whereas the white panels relate to six-monthly reference periods.
Firms were less optimistic about the increase in banks' willingness to lend than in the previous round (Chart 8). On balance, 2% of firms reported an improvement in banks’ willingness to lend, down from 6% over the previous quarter. A net 3% of SMEs (down from 6%) reported an improvement in banks’ attitudes towards them, whereas large firms indicated that attitudes of banks remained unchanged. Firms were also less optimistic about the willingness of business partners to provide trade credit (a net 4%, down from a net 8% in the previous survey round). In the current survey round, a net 4% of both SMEs and large firms reported an improvement in their perception of the willingness of their trading partners to provide credit, although this figure was lower than in the previous quarter (a net 8% and 9% respectively). Among the sample of firms reporting on the past six months, the continued increase in the reported willingness of banks to provide credit was predominantly due to the more positive perceptions of large firms.
Chart 8
Changes in factors that have an impact on the availability of external financing for euro area firms (firm’s credit history, willingness of banks to lend and willingness of suppliers to provide trade credit)
(net percentages of respondents)

Base: All firms; for the category “willingness of banks to lend”, firms for which at least one bank financing instrument (credit line, bank overdraft, credit card overdraft, bank loan or subsidised bank loan) is relevant. The figures refer to rounds 27 to 36 of the survey (April-September 2022 to April-September 2025).
Notes: See the notes to Chart 1. The data included in the chart refer to Question 11 of the survey. The grey panels represent responses to the same question for three-monthly reference periods, whereas the white panels relate to six-monthly reference periods.
2.6 Bank loan applications declined further, with financing obstacles broadly unchanged
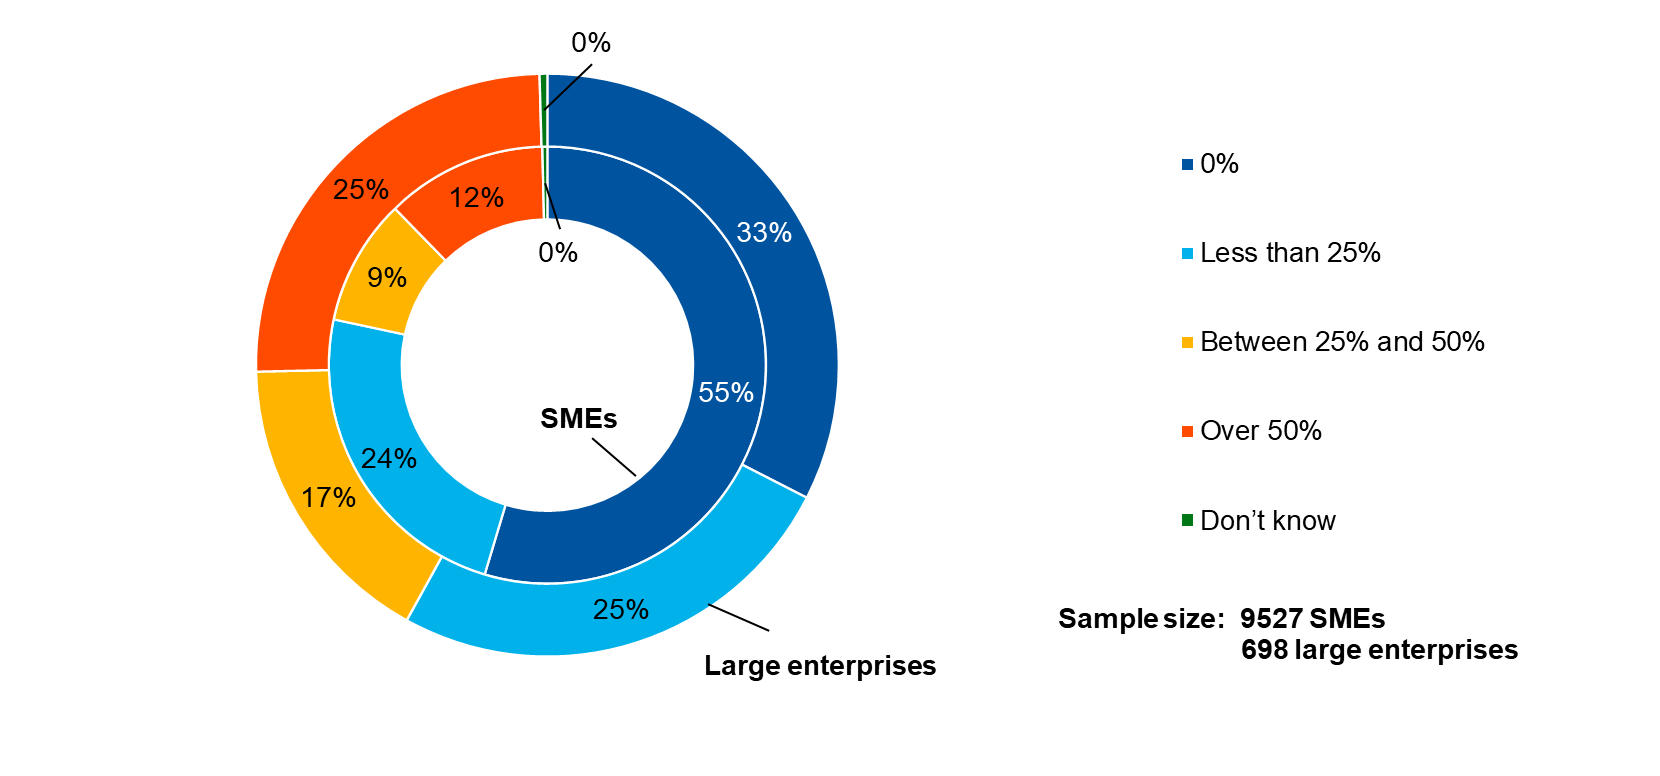
The share of firms that reported having applied for bank loans decreased further compared with in the previous survey round (Chart 9). In the third quarter of 2025, the share of bank loan applications fell to 17%, 6 percentage points lower than in the previous quarter. The decline was broad-based across firm sizes, with applications decreasing to 15% among SMEs (from 18%) and to 22% among large firms (from 31%). The share of firms reporting that they were discouraged from applying for bank loans remained unchanged at 3% (Chart 10). The main reason cited for not applying continued to be the availability of sufficient internal funds to finance business plans, reported by 55% of firms (up from 49% in the previous round). This pattern was consistent across firm sizes. When reporting on developments over the previous six months, 27% of firms indicated that they had applied for bank loans, with applications more prevalent among large firms (38%) than among SMEs (19%).
Chart 9
Applications for bank loans by euro area firms
(percentages of respondents)

Base: Firms for which bank loans (including subsided bank loans) are relevant. The figures refer to rounds 27 to 36 of the survey (April-September 2022 to April-September 2025).
Notes: The data included in the chart refer to Question 7A of the survey. The grey panels represent responses to the same question for three-monthly reference periods, whereas the white panels relate to six-monthly reference periods.
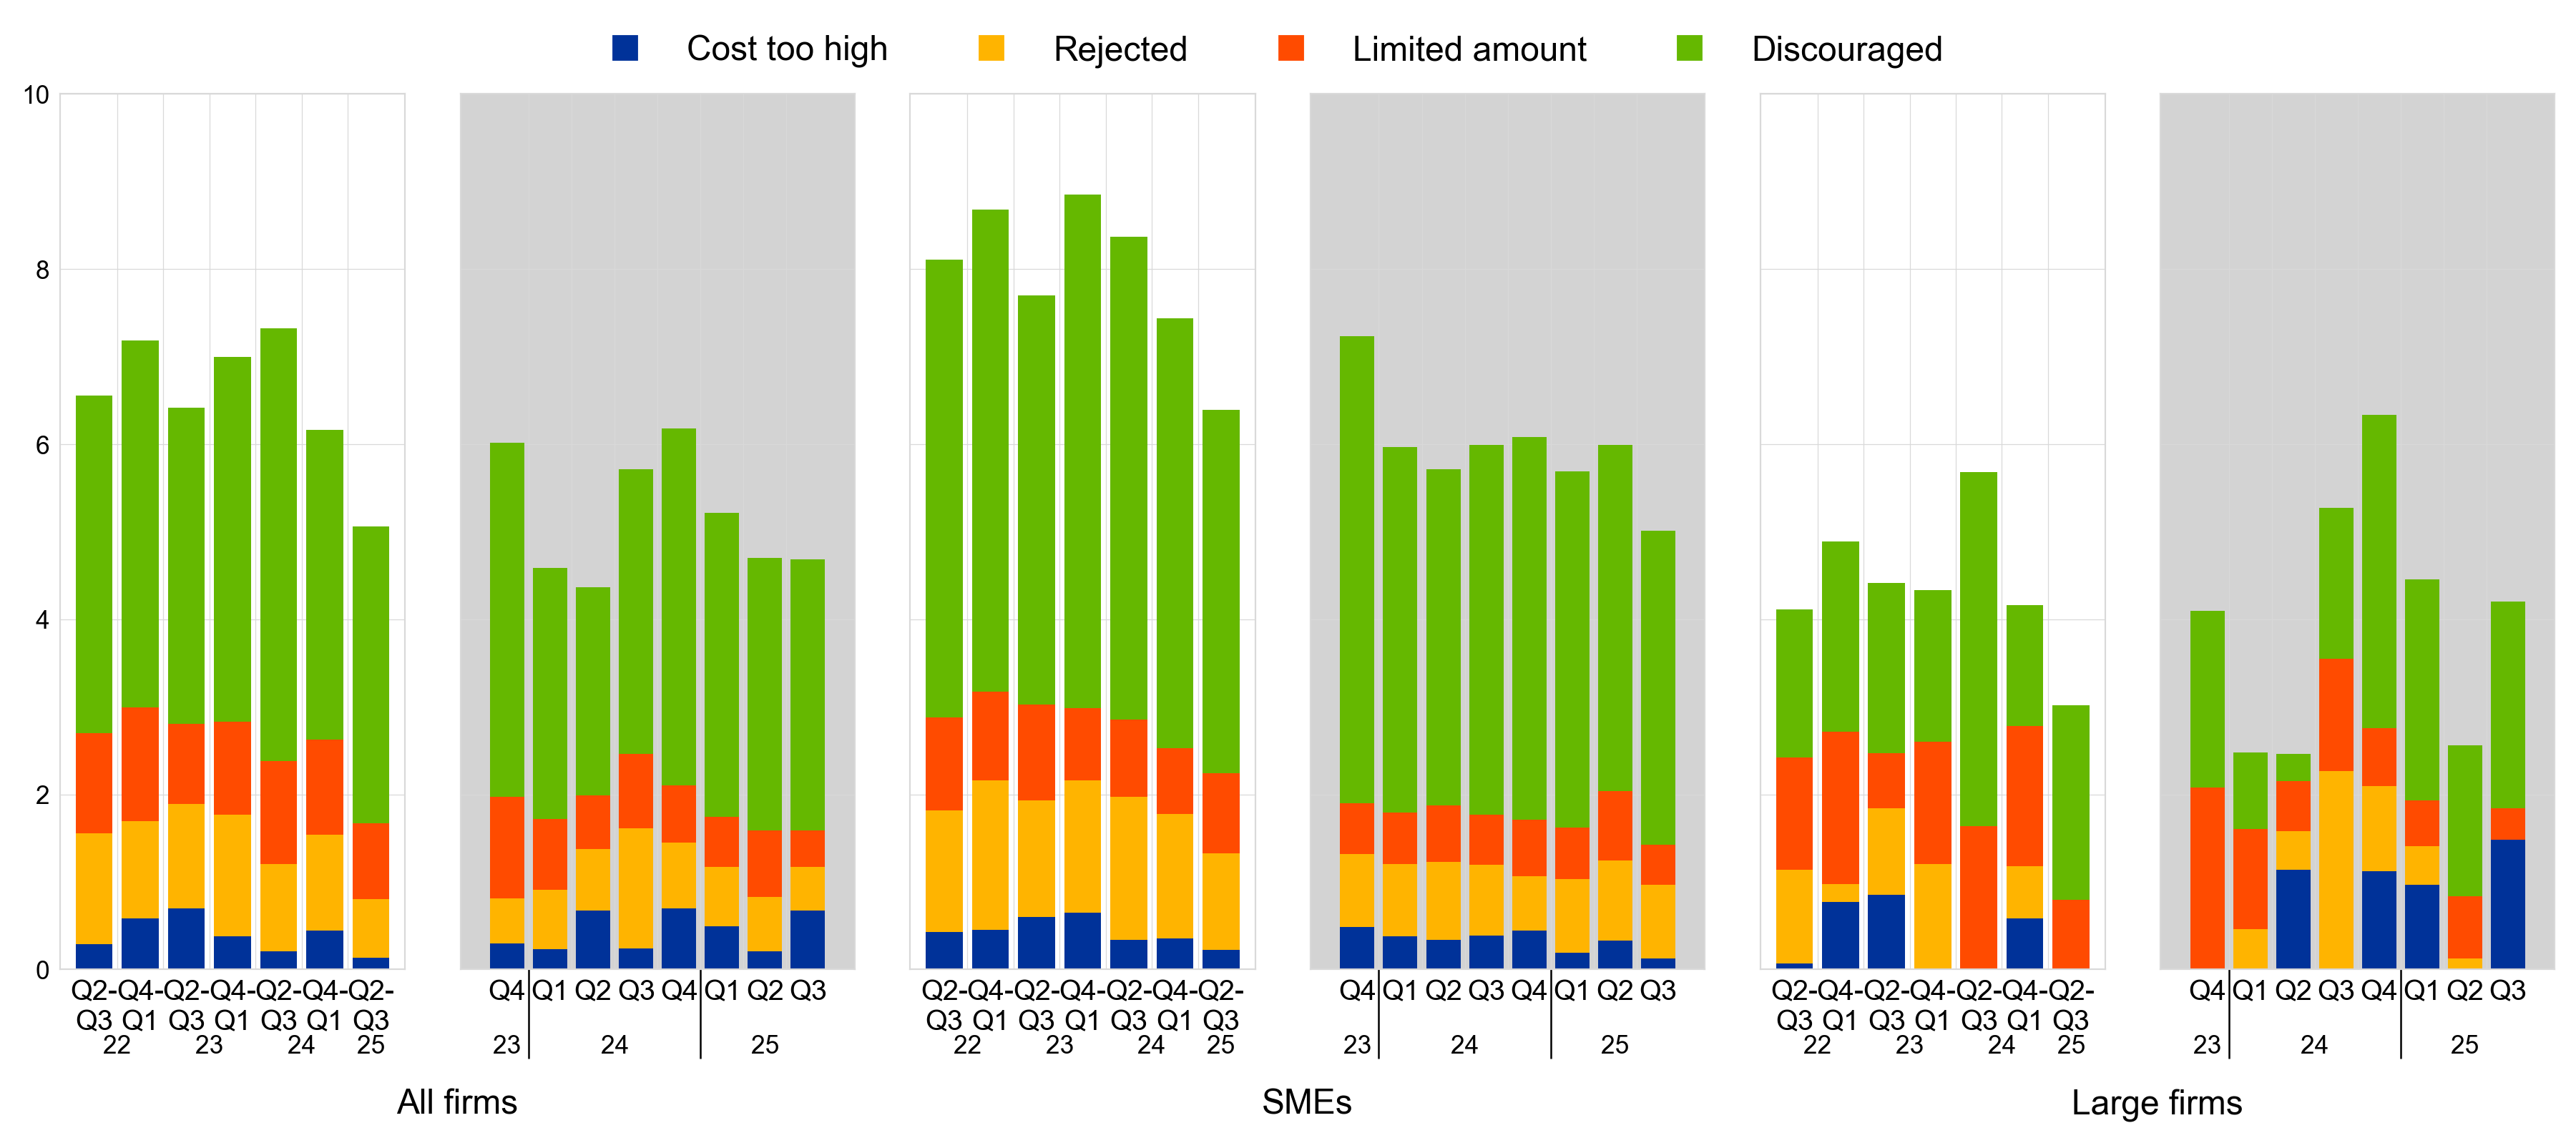
The share of firms reporting obstacles to obtaining a bank loan remained broadly unchanged at low levels (Chart 10). 5% of firms that considered bank loans relevant for their enterprise faced obstacles when seeking to obtain a loan. Discouraged borrowers, i.e. firms that did not apply for bank loans even if they needed them, continued to account for the largest share of firms facing financing obstacles (3%, unchanged from the previous quarter). SMEs reported less discouragement, whereas a higher share of large firms were discouraged from applying or considered borrowing costs to be too high.
Chart 10
Obstacles to obtaining a bank loan
(percentages of respondents)
Base: Firms for which bank loans (including subsidised bank loans) are relevant. The figures refer to rounds 27 to 36 of the survey (April-September 2022 to April-September 2025).
Notes: Financing obstacles are defined here as the total of the percentages of firms reporting (i) loan applications that resulted in an offer that was declined by the enterprise because the borrowing costs were too high, (ii) loan applications that were rejected, (iii) a decision not to apply for a loan for fear of rejection (discouraged borrowers), and (iv) loan applications for which only a limited amount was granted. The grey panels represent responses to the same question for three-monthly reference periods, whereas the white panels relate to six-monthly reference periods. The data included in the chart refer to Questions 7A and 7B of the survey.
3 The economic situation of euro area firms
3.1 Firms reported that turnover was broadly unchanged, while cost pressures remained high
Over the last three months, on balance, enterprises reported no changes in turnover (Chart 11). The balance of firms indicating higher turnover in the third quarter of 2025 fell to 0%, down from 8% in the second quarter. Differences across size classes persisted: large firms continued to report some improvement (a net 5%, down from 16% in the previous quarter), while SMEs indicated a decline (a net -4%, compared with a net 4% in the previous quarter). Looking ahead to the next quarter, firms remain optimistic, with a net 25% expecting higher turnover – a net 19% among SMEs and a net 36% among large firms (from 19% and 31% respectively). Among firms reporting on the past six months, large firms also remained more optimistic than SMEs about turnover over the next six months, with net balances of 33% and 19% respectively.
Firms continued to signal deteriorating profits in the third quarter of 2025. On balance, 13% of euro area firms reported a decline in profits, unchanged from the second quarter. The deterioration was more pronounced among SMEs, with a net 17% reporting lower profits (from -15% in the previous quarter), compared with a net 7% of large firms (from -8%).
In the third quarter of 2025, cost pressures related to materials, energy and labour costs increased further, albeit at a slower pace than in the previous quarter. A net 42% of firms indicated higher labour costs, down from 50% in the second quarter. Similarly, the share of firms experiencing increased material and energy costs declined to a net 41%, compared with 45% in the previous quarter. Both large firms and SMEs indicated slower growth in labour, material and energy costs compared with the previous period. Results over the past six months reaffirm the persistence of rising cost pressures on firms.
Interest expenses, however, remained broadly unchanged. A net 4% of SMEs reported higher interest expenses, whereas a net 7% of large firms indicated lower expenses. Over the past six months, interest expenses have risen for a smaller share of firms compared with the period spanning the first and second quarters of 2025.
Chart 11
Changes in the economic situation of euro area firms
(net percentages of respondents)

Base: All firms. The figures refer to rounds 27 to 36 of the survey (April-September 2022 to April-September 2025).
Notes: See the notes to Chart 1. The data included in the chart refer to Question 2 of the survey.
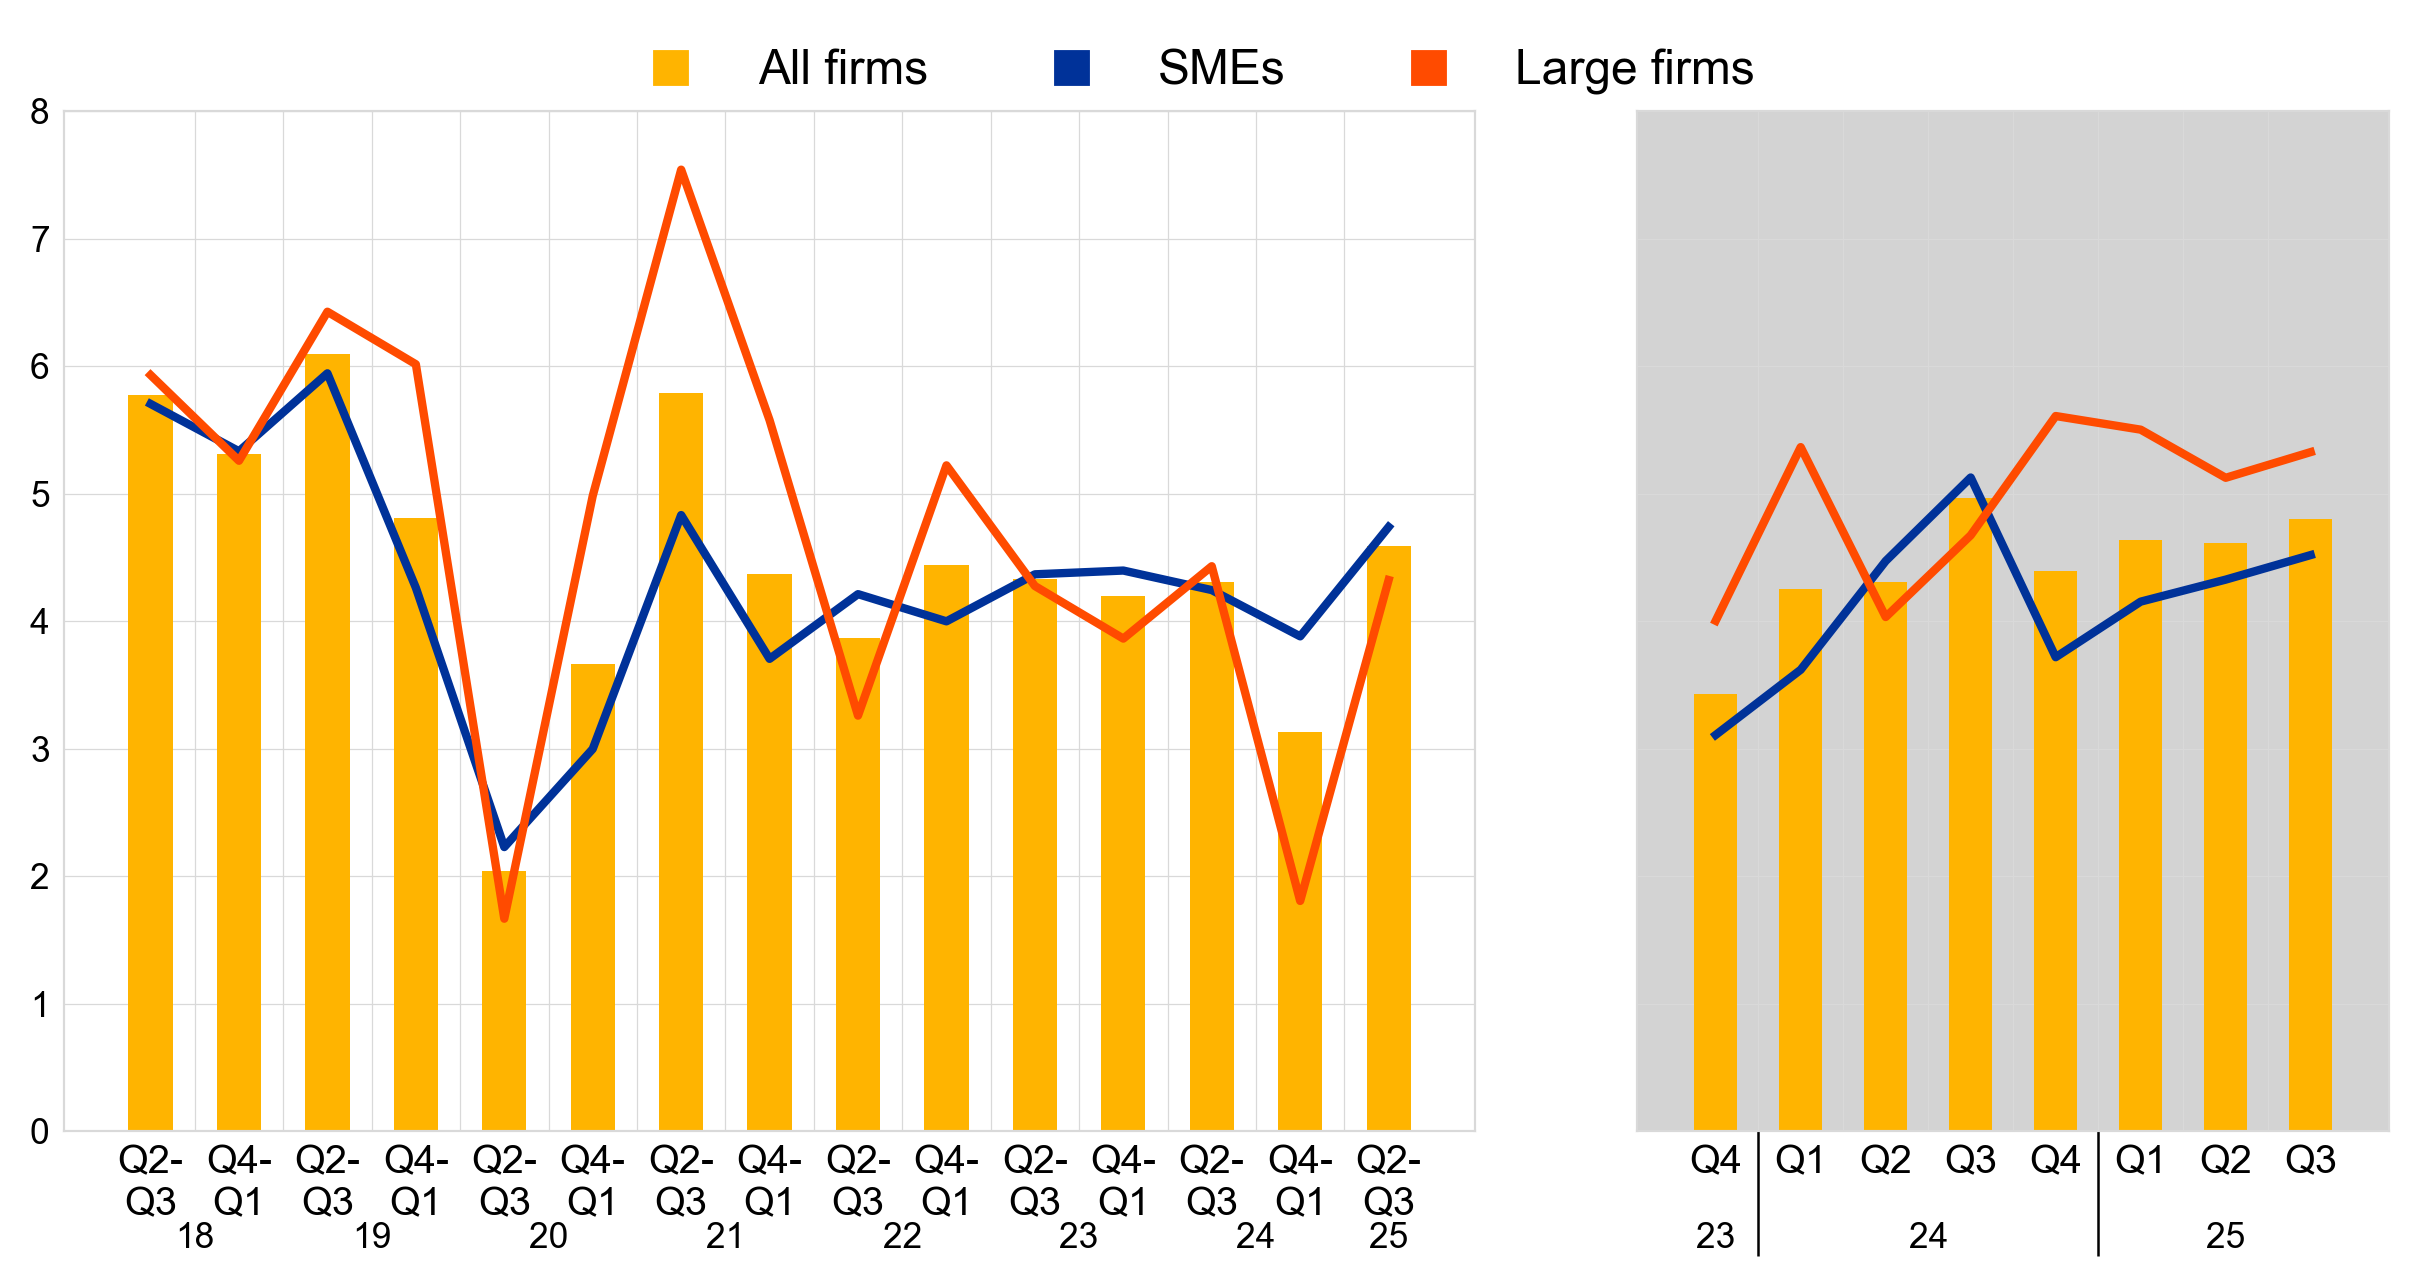
Over the past three months, the share of financially vulnerable enterprises was low, in line with the previous quarter (Chart 12). According to the financial vulnerability indicator, which evaluates firms' overall financial health, only 3% of euro area firms reported significant difficulties in managing operations or servicing debts, unchanged from the previous quarter.[4] Vulnerability levels were slightly higher among SMEs, with 4% classified as financially vulnerable, compared with just 2% of large firms. Over the same quarter, the proportion of financially resilient firms – those better equipped to withstand adverse shocks – stood at 5%, with no changes across size classes. Developments over the past six months were similar, even though the percentage of vulnerable large firms slightly increased with respect to the previous six months.
Chart 12
Vulnerable and financially resilient firms in the euro area
a) Vulnerable firms
(percentages of respondents)

b) Financially resilient firms
(percentages of respondents)
Base: All enterprises. The figures refer to rounds 19 to 36 of the survey (April-September 2018 to April-September 2025).
Notes: For a definition of “vulnerable firms” and “resilient firms”, see footnote 4. The data included in the chart refer to Question 2 of the survey. The grey panels represent responses to the same question for three-monthly reference periods, whereas the white panels relate to six-monthly reference periods.
3.2 Investment activity showed an uptick, with modest improvements expected in the fourth quarter of 2025
More enterprises reported an increase in investment over the past three months (Chart 13). A net 8% of firms indicated a rise in investment on fixed assets in the third quarter of 2025 (from a net 3% in the previous quarter). The net percentage of SMEs reporting an increase in investment was 5%, marginally up from 4% in the previous quarter. Large firms reported a much higher rise – a net 14%, from the low net 1% recorded in the second quarter. Overall, the reported dynamics across size classes align with the established observation that investment decisions exhibit lumpy behaviour.[5] However, the aggregate outcomes are significantly shaped by large firms due to their higher weights in the weighted total. Looking ahead, firms are less optimistic about raising future investment than they were in the previous quarter. A net 8% of firms expect to increase investment in the fourth quarter of 2025 (5% of SMEs and 14% of large firms).
Chart 13
Changes in realised and expected fixed investments of euro area enterprises
(net percentages of respondents)

Base: All firms. The figures refer to rounds 27 to 36 of the survey (April-September 2022 to April-September 2025).
Notes: See the notes to Chart 1. The bars refer to developments over the preceding six months and the lines to expectations over the next six months. The data included in the chart refer to Questions 2 and 26 of the survey. The question on expected investments was first included in the questionnaire covering the second and third quarters of 2023.The grey panels represent responses to the same question for three-monthly reference periods, whereas the white panels relate to six-monthly reference periods.
3.3 Euro area enterprises remained concerned about the cost of production and availability of skilled labour
Firms reported that the availability of skilled labour, production and labour costs continued to be major concerns limiting production (Chart 14). Over the past six months, the availability of skilled labour remained the most widely reported major concern (defined as a score of at least seven on a scale of one to ten) among euro area firms (signalled by 63% of firms), alongside production or labour costs (62%). In addition, firms were concerned about finding customers (53%) and about competition (45%). Across size classes, large firms tended to be more concerned than SMEs, particularly about factors closely related to the ongoing uncertainty surrounding trade policy. For instance, 70% of large firms flagged production or labour costs as a major issue, compared with 58% of SMEs, while 52% of large firms cited competition as a concern, versus 41% of SMEs.
A relatively low share of firms reported access to finance as a major concern for their businesses. Similar to the previous period, around 23% of firms reported access to finance as a key issue for their businesses. This trend was consistent across both large firms and SMEs.
Chart 14
Major concerns limiting production faced by euro area firms
(over the preceding six months; percentages of respondents)

Base: All firms. The figures refer to rounds 19 to 36 of the survey (April-September 2018 to April-September 2025).
Notes: A “major concern” is defined as a problem scoring at least seven on a scale of one to ten. The data included in the chart refer to Question 0b of the survey.
3.4 Firms expect a stronger increase in selling prices
Firms expect stronger increases in selling prices and wages over the next 12 months (Chart 15). Firms expect their selling prices to rise by 2.9% on average over the next 12 months, up from 2.5% in the previous survey round. The dispersion of selling price expectations remains stable, with almost one third of firms in the survey still not expecting prices to increase over the next year.[6] Expectations for wage increases have increased to 3.0%, on average, from 2.8% in the previous survey round.
Chart 15
Expectations for selling prices, wages, input costs and employees one year ahead
(percentage changes over the next 12 months)

Base: All firms. The figures refer to rounds 29 to 36 (September 2023 to September 2025) of the survey, with firms’ replies collected in the last month of the respective survey waves.
Notes: Mean and median euro area firm expectations of changes in selling prices, wages of current employees, non-labour input costs and number of employees for the next 12 months, along with interquartile ranges, using survey weights. The statistics are computed after trimming the data at the country-specific 1st and 99th percentiles. The data included in the chart refer to Question 34 of the survey.
Firms also reported somewhat higher expectations for growth in their non-labour input costs over the next year (Chart 15). The expected average increase in non-labour input costs is 3.8%, up from 3.4% in the previous survey. In the current survey round, the distribution of the expected average increase in non-labour input costs has narrowed compared to the previous survey round.
On average, firms expect employment to increase by 0.9% over the next year, while the median firm expects zero growth (Chart 15). The average expected employment growth was slightly lower than in the previous round, in which it stood at 1.3%. The distribution of expected changes in staffing levels has narrowed further.
Across firm sizes, SMEs continued to report higher expectations for selling prices, wages and non-labour input costs than large firms (Chart 16). On average, SMEs expect greater increases than large firms, both in their selling prices (3.3%, compared with 2.3% for large firms) and in non-labour input costs (4.4%, compared with 2.6% for large firms). SMEs’ expectations for wage costs over the next year stand at 3.2%, slightly higher than the figure of 2.9% reported in the previous survey round, while large firms expect 2.6%, as in the previous quarter. Employment growth expectations for the next 12 months have decreased for both SMEs and large firms (1% and 0.7% respectively, compared with 1.4% and 1.1% in last survey round).
Chart 16
Expectations for selling prices, wages, input costs and employees one year ahead, by size class
(percentage changes over the next 12 months)

Base: All firms. The figures refer to rounds 29 to 36 (September 2023 to September 2025) of the survey, with firms’ replies collected in the last month of the respective survey waves.
Notes: Weighted average euro area firm expectations of changes in selling prices, wages of current employees, non-labour input costs and number of employees for the next 12 months using survey weights. The statistics are computed after trimming the data at the country-specific 1st and 99th percentiles. The data included in the chart refer to Question 34 of the survey.
Comparing developments across sectors, firms in the construction and services sectors expect larger selling price increases than firms in trade and industry (Chart 17). Firms in the construction sector expect their selling prices to rise by 3.4% (up from 2.7% in the previous survey round), as do firms in the services sector (3.3%, up from 2.8%). Firms in the trade sector expect an average rise of 2.9% (up from 2.8% in the previous quarter) while firms in the industry sector expect a rise of 1.9% over the next year (up from 1.6% in the previous survey round). Wages are expected to grow by 3.3% in the construction sector, 3.2% in services, 2.9% in trade and 2.5% in industry over the next year (up from 2.8%, 3.1%, 2.8% and 2.3% in the respective sectors). Firms in the construction and services sectors expect non-labour input costs to grow at 4.1% over the next 12 months (up from 3.8% and 3.7% respectively), while the figures are 3.5% for trade (from 3.5%) and 3.1% for industry (from 2.5%). Expected increases in employment growth were slightly larger in the services sector (1.1%) and in construction (1.5%), while they were more modest in industry (0.5%) and trade (0.7%).
Chart 17
Average expectations for selling prices, wages and input costs one year ahead, by sector
(percentage changes over the next 12 months)

Base: All firms. The figures refer to rounds 29 to 36 (September 2023 to September 2025) of the survey, with firms’ replies collected in the last month of the respective survey waves.
Notes: Mean euro area firm expectations of changes in selling prices, wages of current employees, non-labour input costs and number of employees for the next 12 months, along with interquartile ranges, using survey weights. The statistics are computed after trimming the data at the country-specific 1st and 99th percentiles. The data included in the chart refer to Question 34 of the survey.
3.5 Firms’ inflation expectations remained unchanged
Euro area firms’ median inflation expectations remained at 2.5% for the one-year horizon and at 3% for the three and five-year horizons (Chart 18). Across size classes, large firms slightly increased their median one-year-ahead inflation expectations to 2.4%, from 2.2% in the previous survey round, while SMEs continued to report a figure of 2.9% (Chart 19). SMEs did not revise their expectations for the three-year horizon (stable at 3.1%), while large firms slightly decreased their expectations (to 2.5%, down from 2.6% in the previous survey round). SMEs raised their inflation expectations to 3.8% (up from 3.2%) for the five-year horizon, while for large firms they slightly decreased (2.7%, from 2.9%).
Chart 18
Firms’ expectations for euro area inflation at different horizons
(annual percentages)

Base: All firms. The figures refer to pilot 2 and rounds 30 to 36 of the survey (December 2023 to September 2025).
Notes: Survey-weighted median, mode and interquartile ranges of firms’ expectations for euro area inflation in one year, three years and five years. Quantiles are computed by linear interpolation of the mid-distribution function. The statistics are computed after trimming the data at the country-specific 1st and 99th percentiles. The data included in the chart refer to Question 31 of the survey.
Chart 19
Firms’ median expectations for euro area inflation by size class
(annual percentages)

Base: All firms. The figures refer to pilot 2 and rounds 30 to 36 (December 2023 to September 2025) of the survey, with firms’ replies collected in the last month of the respective survey waves.
Notes: Survey-weighted median of euro area firms’ expectations for euro area inflation in one year, three years and five years. The statistics are computed after trimming the data at the country-specific 1st and 99th percentiles. The data included in the chart refer to Question 31 of the survey.
Firms reported similar upside risks to their long-term inflation outlook as in the previous round (Chart 20). In total, 53% of firms perceived upside risks to their inflation outlook five years ahead (up from 52%). The share of firms perceiving balanced risks stood at 33%, as in the previous survey round, and the share of firms seeing downside risks relative to their inflation forecast stood at 14%. For both large firms and SMEs, risks remain clearly tilted to the upside, with 55% of SMEs and 49% of large firms reporting upside risks (from 53% of SMEs and 50% of large firms in the previous round).
Chart 20
Firms’ perceived risks for euro area inflation five years ahead, by firm size
(weighted percentages)

Base: All firms. The figures refer to rounds 31 to 36 (June 2024 to September 2025) of the survey.
Notes: Survey-weighted percentages of firms’ subjective inflation outlook over the next five years. The statistics are computed after trimming firms replying to Question 31 on the five-year ahead scenario at the country-specific 1st and 99th percentiles and does not consider firms that answered “don’t know” in Question 31 on the five-year ahead scenario. The data included in the chart refer to Question 33 of the survey.
4 Annexes
4.1 Annex 1
Descriptive statistics for the sample of firms
Chart 21
Breakdown of firms by economic activity
(unweighted percentages)

Base: The figures refer to round 36 of the survey (July-September 2025).
Chart 22
Breakdown of firms by age

Base: The figures refer to round 36 of the survey (July-September 2025).
Chart 23
Breakdown of firms by ownership
(unweighted percentages)
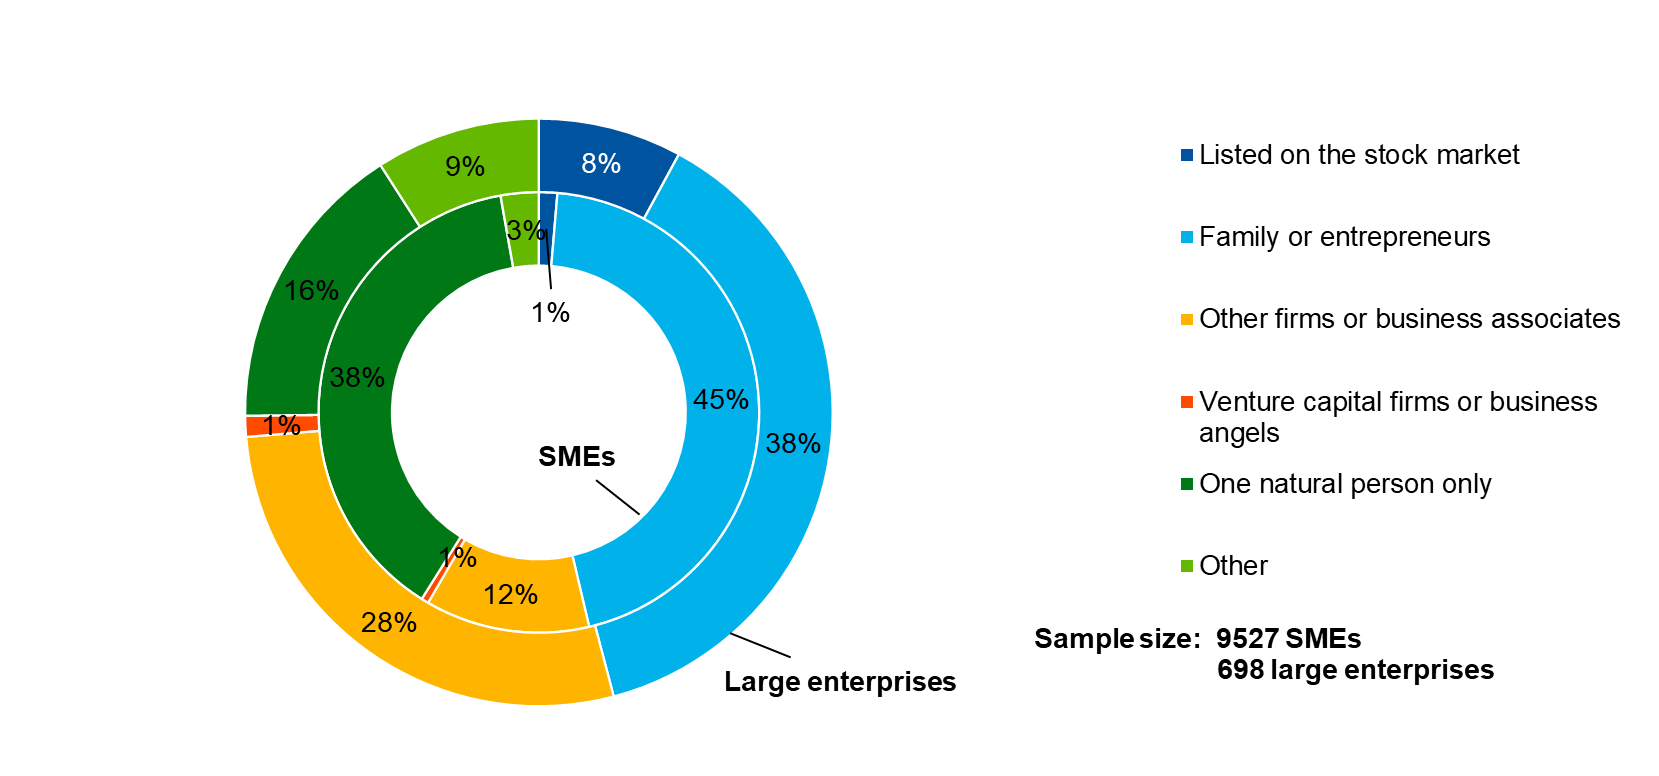
Base: The figures refer to round 36 of the survey (July-September 2025).
Chart 24
Breakdown of firms by exports
(unweighted percentages)
Base: The figures refer to round 36 of the survey (July-September 2025).
4.2 Annex 2
Methodological information on the survey
For an overview of how the survey was set up, the general characteristics of the euro area firms that participate in the survey and the changes introduced to the methodology and the questionnaire over time, see the “Methodological information on the survey and user guide for the anonymised micro dataset”, which is available on the ECB’s website.[7]
In this round, both the six-month reference period and the three-month reference period were covered.
Questions Q0b, Q32 and Q6A were re-introduced, but Q0b and Q32 asked only to the six-month reference period sample group.
All items which were removed in the 2025Q2 wave from questions Q4, Q5, Q7A, Q7B, Q11, Q9 and Q23 were re-introduced for the six-month reference period sample group.
Four ad hoc questions were added, one regarding the exporting markets (inside and/or outside Europe), and three regarding late payments: (i) To which markets did your company export goods or services in 2024? (ii) Has your company experienced problems due to late payments from any private or public entities during the previous quarter and current quarter? (iii) What were the consequences of those late payments? (iv) How severe were these problems due to late payments.
Section 6 on future growth and obstacles to growth was added. This section is identical to the one of the 2024Q3 round.
© European Central Bank, 2025
Postal address 60640 Frankfurt am Main, Germany
Telephone +49 69 1344 0
Website www.ecb.europa.eu
All rights reserved. Reproduction for educational and non-commercial purposes is permitted provided that the source is acknowledged.
For specific terminology please refer to the ECB glossary (available in English only).
PDF ISSN 1831-9998, QB-01-25-172-EN-N
HTML ISSN 1831-9998, QB-01-25-172-EN-Q
Since 2024 the survey has been conducted quarterly, with firms providing insights into developments over the previous three months and the upcoming three months. Additionally, twice a year a subsample of firms is asked about developments over the previous six months and the next six months. For this subsample, the questionnaire includes additional questions on financing instruments.
See Annex 3 for details of methodological issues relating to the survey.
The indicator is derived from a factor analysis covering changes in: (i) price terms and conditions of bank loans (changes in interest rates and other costs of bank loans); (ii) non-price terms and conditions (changes in collateral requirements); (iii) the financial position of firms (in terms of changes in profits, credit history and own capital); and (iv) firms’ perceptions of changes in the willingness of banks to provide credit. The reported indicator is one of three main principal components and mainly relates to price terms and conditions. The other two indicators relate respectively to non-price terms and conditions for loans and to the financial position of the firm. This is based on an updated methodology presented in the box “Financing conditions through the lens of euro area companies”, Economic Bulletin, Issue 8, ECB, 2021. The revised approach includes updating the factor analysis at each wave using all available historical data and calculating each indicator as a linear combination of the underlying variables. This combination is subsequently rescaled to a range of -100 to 100 by dividing it by its theoretical maximum. In each survey round, the most recent value is reported, while the historical data are maintained as they are.
Vulnerable firms are defined as firms that simultaneously report lower turnover, decreasing profits, higher interest expenses and a higher or unchanged debt-to-assets ratio, while financially resilient firms are those that simultaneously report higher turnover and profits, lower or no interest expenses and a lower or no debt-to-assets ratio. See the box entitled “Distressed and profitable firms: two new indicators on the financial position of enterprises”, Survey on the Access to Finance of Enterprises in the euro area, October 2017 to March 2018, ECB, June 2018.
See Bertola, G. and Caballero, R.J., “Irreversibility and aggregate investment”, The Review of Economic Studies, Vol. 61(2), pp. 223-246, 1994 and Baley, I. and Blanco, A., “Aggregate dynamics in lumpy economies”, Econometrica, Vol. 89(3), pp. 1235-1264, 2021.
The share of firms expecting non-positive selling price changes was 29%, slightly less than in June and March (both 32%).
“Survey on the access to finance of enterprises – Methodological information on the survey and user guide for the anonymised micro dataset”, ECB, January 2025.
-
27 October 2025