
Foreword

This 20th annual review of the international role of the euro published by the European Central Bank presents an overview of developments in the use of the euro by non-euro area residents.
The report covers developments in 2020. This period was characterised by the outbreak of the coronavirus (COVID-19) pandemic, a contraction in global economic activity unprecedented in living memory and exceptional global policy support. On balance, however, these developments did not result in a significant change in the international role of the euro. In particular, the euro’s share in outstanding international loans, in the stock of international debt securities and as an invoicing currency for extra-euro area imports of goods remained broadly stable. The share of the euro in global foreign exchange reserves declined, as did the share of the euro in foreign currency-denominated debt issuance and in outstanding international deposits. The euro remained a key currency in international green bond markets, a small but rapidly growing segment of international debt security markets.
The international role of the euro is primarily supported by a deeper and more complete Economic and Monetary Union, including advancing the capital markets union, in the context of the pursuit of sound economic policies in the euro area. The Eurosystem supports these policies and emphasises the need for further efforts to complete Economic and Monetary Union. The relative resilience of the international role of the euro despite the pandemic shock stands in contrast to the significant decline observed in the wake of the euro area sovereign debt crisis. To some extent, this development may reflect the effectiveness of the unprecedented policy support measures and coordinated approach that have prevailed in the euro area during the COVID-19 crisis. At the same time, the fact that the global appeal of the euro remains broadly stable at a low level suggests that only further resolute policy measures and reform efforts would enable the euro to realise its global potential.
The ECB will continue to monitor developments and publish information on the international role of the euro on a regular basis.
Christine Lagarde
President
1 Main findings
The international role of the euro remained broadly stable in 2020. This period was characterised by the outbreak of the coronavirus (COVID-19) pandemic, a contraction in global economic activity unprecedented in living memory and exceptional global policy support. On balance, however, these developments did not result in a significant change in the international role of the euro.
A composite index of the euro’s international role remained broadly stable over the review period at a low level (Chart 1). Adjusting for exchange rate valuation effects, the index declined slightly by 0.3 percentage points. At current exchange rates, it remained unchanged overall. The share of the euro across various indicators of international currency use was close to historical lows, averaging around 19%. The euro remained unchallenged as the second most important currency in the international monetary system (Chart 2).
Chart 1
The international role of the euro remained broadly stable at a low level over the review period
Composite index of the international role of the euro
(percentages; at current and Q4 2020 exchange rates; four-quarter moving averages)
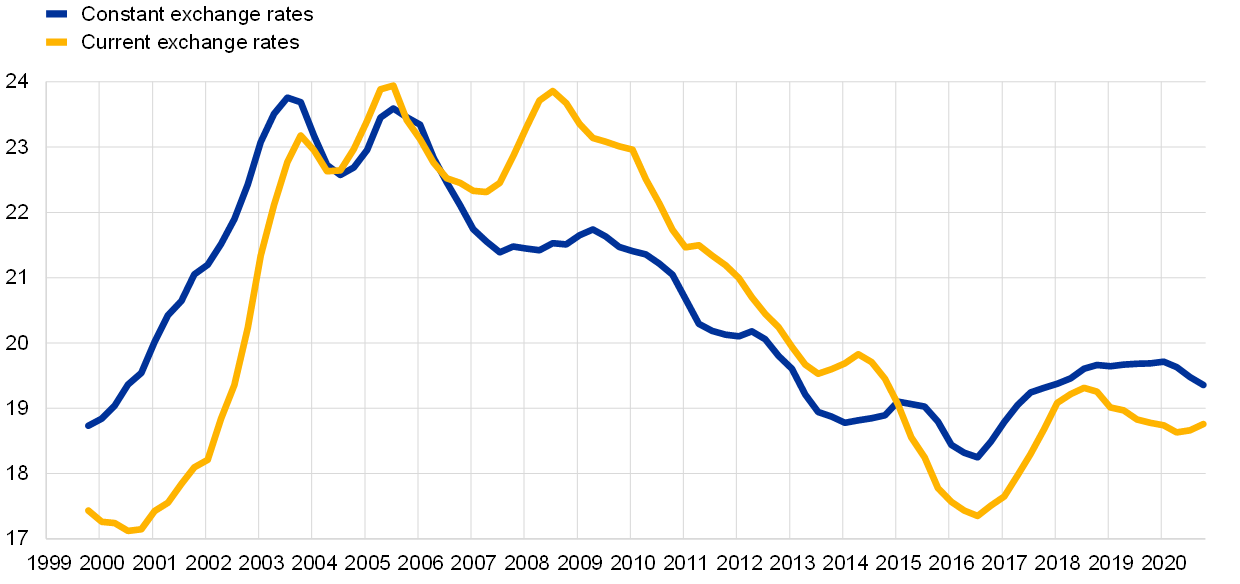
Sources: BIS, IMF, CLS Bank International, Ilzetzki, Reinhart and Rogoff (2019) and ECB calculations.
Notes: Arithmetic average of the shares of the euro at constant (current) exchange rates in stocks of international bonds, loans by banks outside the euro area to borrowers outside the euro area, deposits with banks outside the euro area from creditors outside the euro area, global foreign exchange settlements, global foreign exchange reserves and global exchange rate regimes. Data at constant exchange rates are not available for global foreign exchange settlements. The estimates for the share of the euro in global exchange rate regimes from 2016 onwards were obtained by ECB staff using the same methodology as Ilzetzki, E., Reinhart, C. and Rogoff, K., “Exchange Arrangements Entering the 21st Century: which anchor will hold?”, Quarterly Journal of Economics, Vol. 134(2), 2019, pp. 599‑646, complemented with ECB staff judgement. The latest observations are for the fourth quarter of 2020.
Chart 2
The euro remained the second most important currency in the international monetary system
Snapshot of the international monetary system
(percentages)
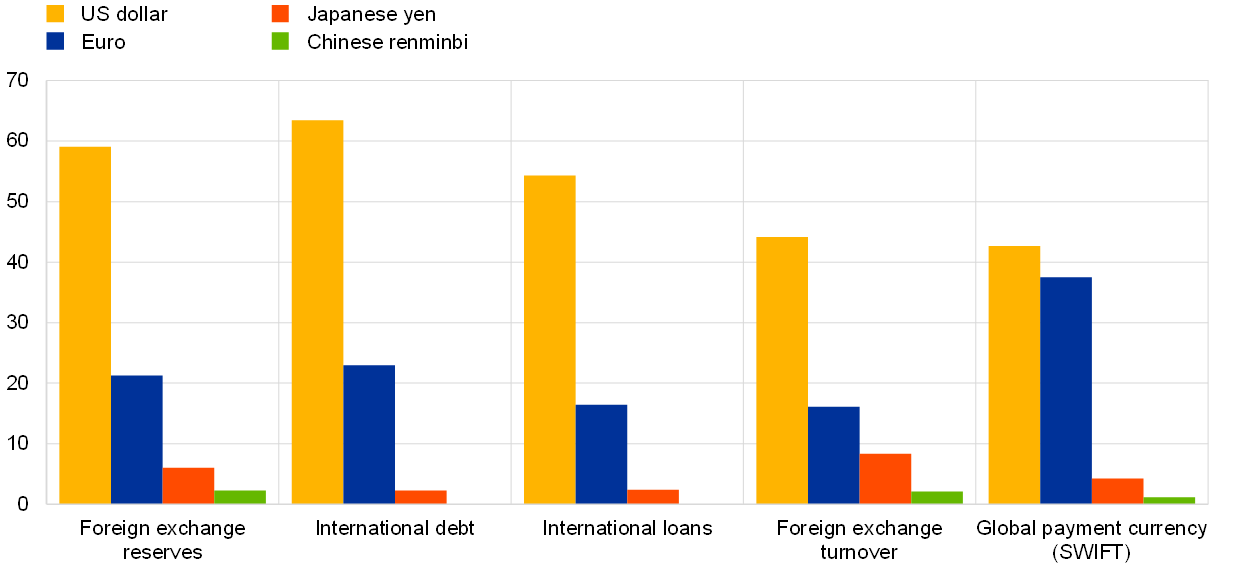
Sources: BIS, IMF, SWIFT and ECB calculations.
Notes: The latest data for FX reserves, international debt and loans are for the fourth quarter of 2020. Foreign exchange turnover data as of April 2019. SWIFT data as of December 2020.
The share of the euro in global foreign exchange reserves decreased by 0.7 percentage points over the review period (Table 1). Survey evidence suggests that low or negative interest rates are a concern among official reserve managers globally. The low level of interest rates in the euro area compared with other major economies may therefore have discouraged official reserve investors from increasing the exposure of their bond portfolios to the euro. The share of the US dollar, the leading currency, in global foreign exchange reserves was stable over the review period. It remained close to a two-decade low, in line with previous trends towards gradual diversification of global reserve portfolios. Considering other structural factors, recent ECB staff research suggests that economies with a large share of the euro in official foreign exchange reserves typically have strong trade and financial linkages with the euro area and use the euro as an anchor currency (Box 1).
Table 1
The international role of the euro from different perspectives
Summary of data in this report

Sources: BIS, CLS Bank International, Dealogic, IMF, national sources and ECB calculations.
Notes: For central, eastern and south-eastern European (CESEE) countries, outstanding amounts refer to outstanding amounts of foreign currency total amounts. An increase in the euro nominal effective exchange rate indicates an appreciation of the euro.
Other indicators of the international role of the euro seem to have been affected more noticeably during the pandemic period.
The share of the euro in foreign currency-denominated debt issuance decreased by around 2 percentage points. Declining global risk aversion over the summer and easier global financial conditions led to a marked increase in global bond issuance, notably from emerging market economies that traditionally issue in dollars in global debt markets. Demand for US dollar-denominated fixed-income securities by large institutional investors based in the United States remained an important factor supporting the US dollar in these markets. Box 2 provides evidence of a strong US dollar bias in the portfolio of US-based fixed-income funds, mainly at the expense of the euro. Only about 8% of the assets managed by a sample of large global bond funds domiciled in the United States are denominated in euro, while the largest share of their holdings is denominated in US dollars – in line with the standard home currency bias phenomenon.
- The share of the euro in international deposits declined by 3 percentage points over the review period, whereas deposits in US dollars increased sizeably. One reason for these developments was that non-bank financial institutions disposed of illiquid assets globally and parked the proceeds in US dollar bank deposits amid the dash for cash that followed the outbreak of the pandemic.
- Cumulative net shipments of euro banknotes to destinations outside the euro area declined by about 2 percentage points, and extra-euro area transactions in euro banknotes by wholesalers halved owing to the travel restrictions introduced following the onset of the pandemic. A regular survey conducted by the Oesterreichische Nationalbank (OeNB) in central, eastern and south-eastern European countries points to mixed developments in household demand for euro cash in the region during the pandemic (Box 3). At the same time, recent ECB staff research suggests that between 30% and 50% of the value of euro banknotes is held outside the euro area, which is higher than previously estimated (Box 4).
The remaining indicators point to a relative resilience in the global attractiveness of the euro over the review period.
- The share of the euro in the stock of international loans by banks outside the euro area to non-euro area borrowers remained broadly stable, decreasing marginally by 0.1 percentage points. The share of the euro in foreign currency-denominated loans in central, eastern and south-eastern European countries increased by a full percentage point.
- The share of the euro as an invoicing currency for extra-euro area imports of goods remained unchanged relative to last year.
- The share of the euro in the stock of international debt securities declined slightly by 0.2 percentage points, less than in international bond issuance, as it tends to adjust more gradually and depends additionally on net redemptions and developments in money market instruments. The decline in the share of the euro in foreign currency-denominated deposits in central, eastern and south-eastern European countries was comparable.
- Finally, over half of the green bonds issued globally over the review period were in euro. For international issuance (i.e. bond issues by non-nationals), the share of the euro stood at about one-third – a significant increase compared with five years earlier and higher than the euro’s share in the issuance of international bonds of about 20%.
At the Euro Summit on 25 March 2021, leaders of euro area countries stressed that they “support strengthening the international role of the euro with a view to enhancing our strategic autonomy in economic and financial matters while preserving an open economy, contributing to the stability of the global financial system, and supporting European businesses and households”.[1] The relative resilience of the global appeal of the euro described in this report is noteworthy given the scale of the pandemic shock. It contrasts with earlier major crisis episodes, such as the euro area sovereign debt crisis, which was associated with a marked decline in the global attractiveness of the euro.[2] To some extent, this development may reflect the effectiveness of the unprecedented policy support measures and coordinated approach that have prevailed in the euro area. At the same time, the stability of the share of the euro across various indicators of international currency use – currently well below the levels that prevailed before the global financial crisis – suggests that only further resolute policy measures and reform efforts would enable the euro to realise its global potential.
Therefore, the policy implications that the Eurosystem has stressed in the past remain fully valid. The international role of the euro is primarily supported by a deeper and more complete Economic and Monetary Union (EMU), including advancing the capital markets union, in the context of the pursuit of sound economic policies in the euro area. The Eurosystem supports these policies and emphasises the need for further efforts to complete EMU.
This year’s report contains three special features. The first special feature considers the implications for the international role of the euro of the European Union (EU) and ECB policy responses to the pandemic. It stresses that national fiscal policies, the facilities set-up at the EU level and the ECB’s monetary policy all contributed towards a strong and cohesive economic recovery from the pandemic crisis, thereby supporting the resilience of the euro area and the international role of the euro. The special feature shows that EU bond issuances planned under the Next Generation EU (NGEU) programme would significantly increase the amount of highly-rated euro-denominated assets and represent a further step towards establishing a common European safe asset. This would help foster financial deepening and capital market integration in the euro area and, in turn, the international role of the euro. However, insofar as NGEU remains relatively modest in size compared with bond markets in other major currencies and is a temporary initiative, it is unlikely to fundamentally change the global status of the euro at this stage. At the same time, NGEU is linked to investment and structural reforms that are expected to increase the growth potential of the euro area and its internal cohesion, increasing the resilience of the euro area economy to shocks and thereby the attractiveness of the euro as global investment currency. Furthermore, the ECB´s monetary policy measures in response to the pandemic have been swift and forceful. They have helped stabilise the euro area economy in the face of an exceptionally large shock. In addition, the measures taken by the ECB to provide euro liquidity to non-euro area central banks have helped to forestall potential adverse impacts of the crisis on the euro area. The knock-on effect of all these measures has been to support the global appeal of the euro over the review period. Finally, the special feature includes three boxes on the recent Communication by the European Commission on the European economic and financial system (Box 5), the effectiveness of the ECB’s euro liquidity lines to foreign central banks (Box 6) and the demand of non-euro area investors for Support to mitigate Unemployment Risk in an Emergency (SURE) bonds issued by the European Commission (Box 7).
The second special feature examines how the issuance of a central bank digital currency (CBDC) could impact the international role of currencies. It stresses that the global appeal of currencies depends on fundamental economic forces which digitalisation is unlikely to alter. However, characteristics that are specific to digital means of payment, including safety, low transaction costs and bundling effects, could promote the international adoption of a currency. These features may combine to create positive feedback loops in the use of a currency as a means of payment and store of value and thus have effects on its global appeal. Moreover, the specific design features of a CBDC would be important for its global outreach and, ultimately, the international role of the currency in which it is denominated. Design features could influence the ability and incentives of non-residents to use a CBDC as means of payment, unit of account and/or store of value. The special feature presents model simulations by ECB staff using a new structural macroeconomic model which allows the effect of the different economic mechanisms at play to be quantified (Box 8). The simulations suggest that a CBDC supports the use of a currency in cross-border payments but is not necessarily a game changer. Fundamental forces, such as the stability of economic fundamentals and size, remain the most important factors for international currency status.
The third special feature presents a new dataset that offers a comprehensive and up-to-date understanding of the use of major currencies in global trade invoicing. It confirms earlier findings on the dominant role of the US dollar in invoicing globally and the overall stability of the use of major currencies in global trade invoicing. At the same time, the special feature also points to several new stylised facts. First, both the US dollar and the euro have been increasingly used as vehicle currencies – i.e. the currency of neither the exporter nor the importer, but of a third country. This is indicated by the fact that invoicing in the currencies in question has remained broadly stable, notwithstanding the decline in the shares of the United States and the euro area in global trade. Second, the euro is used as a vehicle currency mainly in Europe and some parts of Africa, which suggests that, even if the US dollar is the dominant currency globally, the euro plays a leading role in these regions. Third, some European countries have seen significant shifts towards euro invoicing, which indicates that inertia in patterns of international trade invoicing can be overcome. Finally, empirical estimates suggest that standard theoretical mechanisms that foster the use of a large economy's currency – i.e. strategic complementarities in price-setting and integration in cross-border value chains – underpin the use of the euro for international trade invoicing (Box 9). These findings suggest that preserving the euro area's openness to trade and the European value chain between the euro area and the rest of the EU, as well as regions neighbouring the EU, are important for the prospective role of the euro as a global invoicing currency.
2 Key developments
2.1 Use of the euro as an international reserve and investment currency
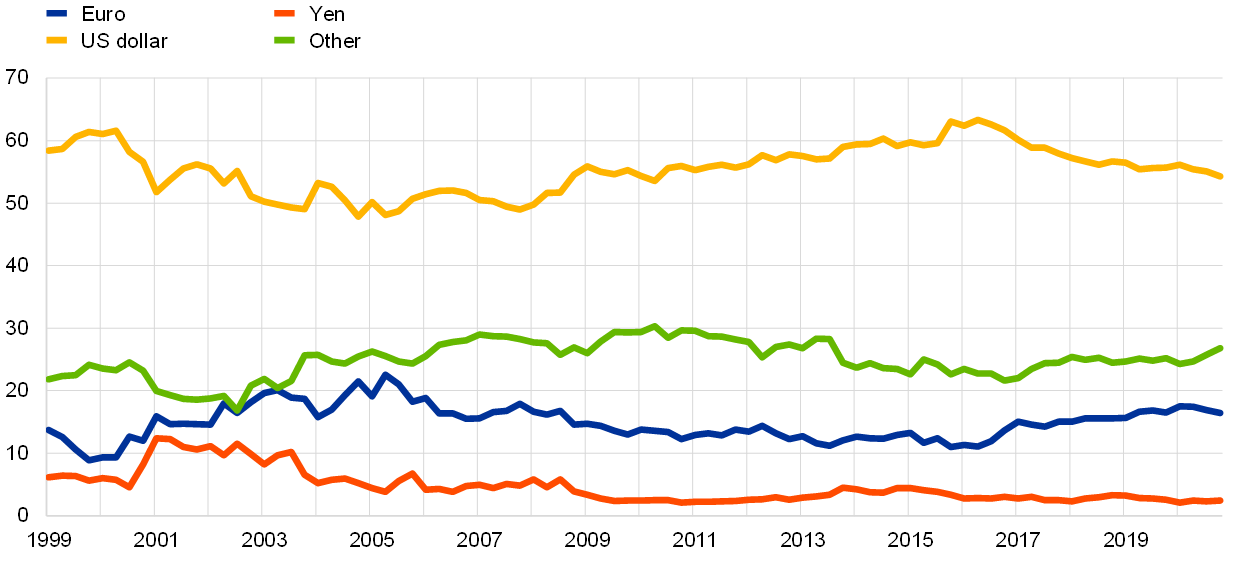
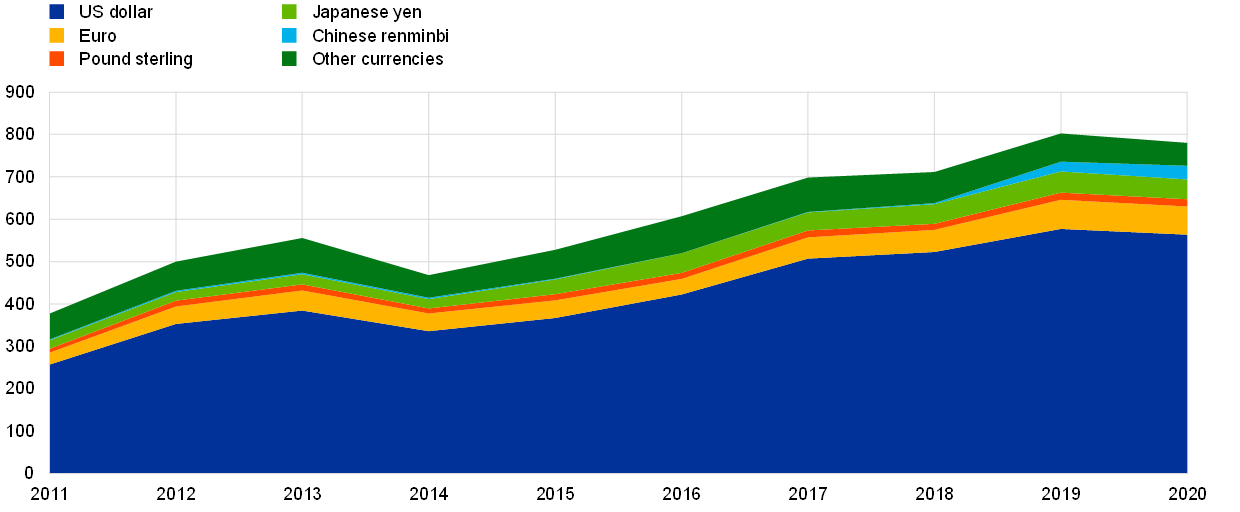
The share of the euro in global official holdings of foreign exchange reserves declined in 2020. The share of the euro in global official holdings of foreign exchange reserves decreased by 0.7 percentage points in 2020, to 21.2%, when measured at constant exchange rates. By contrast, the share of the euro increased at current exchange rates, owing to the appreciation of the euro exchange rate against the US dollar by around 9 percentage points over the review period (Charts 3 and 5). The US dollar remained the leading global reserve currency. Its share in globally disclosed reserves remained stable, at around 59%, when measured at constant exchange rates. At the same time, the share of the US dollar declined by almost 2 percentage points at current exchange rates. These developments suggest that the weakening of the US dollar exchange rate, which followed the acute phase of the pandemic crisis in March 2020, encouraged official reserve managers to increase their US dollar holdings more than their euro holdings in an attempt to stabilise, at least partially, the share of the US dollar in their portfolios.[3] In line with this, purchases of US dollars by official investors reached an estimated USD 280 billion during the review period, compared with an estimated USD 30 billion for purchases of euro-denominated reserves.[4] From a longer-term perspective, the share of the euro in global official holdings of foreign exchange reserves remained broadly stable at a relatively low level compared with the levels prevailing before the global financial crisis and the euro area sovereign debt crisis.
Chart 3
The share of the euro in global foreign exchange reserves declined in 2020
Developments in the shares of the euro, US dollar and other currencies in global official holdings of foreign exchange reserves
(percentages; at constant Q4 2020 exchange rates)
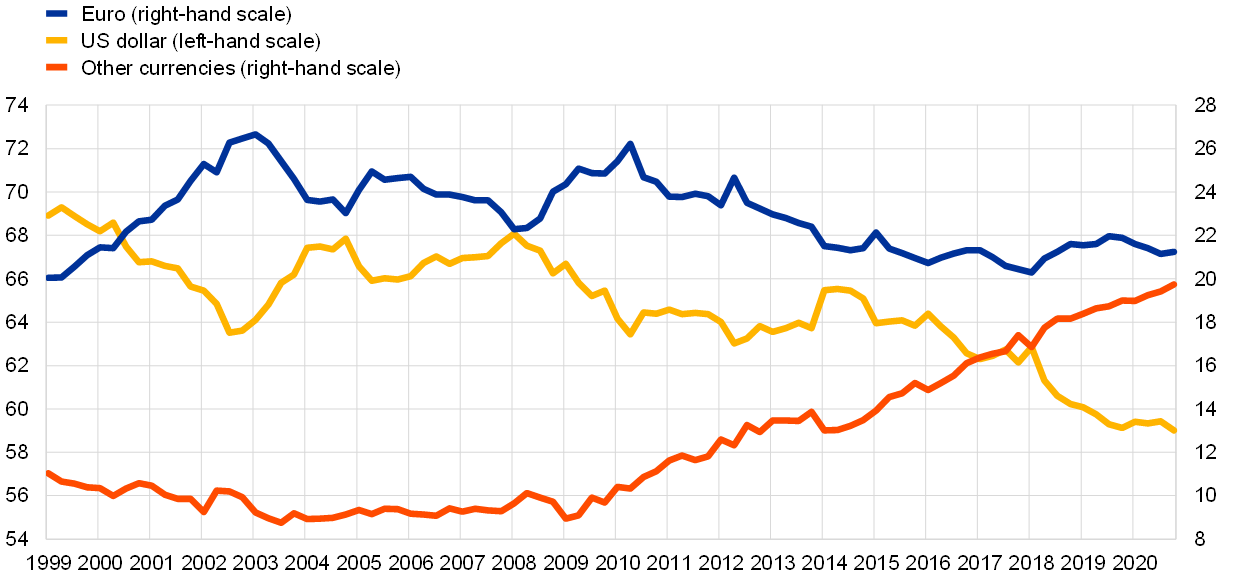
Sources: IMF and ECB calculations.
Note: The latest observation is for the fourth quarter of 2020.
Survey evidence suggests that low or negative interest rates remain a concern among official reserve managers globally. According to a regular survey of official reserve managers conducted by a global financial institution, almost 70% of respondents mentioned low or negative yields in fixed-income markets as one of the main concerns relevant for their investment strategy, excluding the COVID-19 crisis.[5] Interest rates in the euro area remained lower than in other major economies, which may have discouraged official reserve investors from adding to their bond exposures in euro (Chart 4). Average euro area 5-year government bond yields stood at -0.6% in 2020, while the 1-month deposit rate hovered around -0.5%. By contrast, the US 5-year government bond yield and the 1-month deposit rate both averaged around 0.5% in 2020. Interest rates in all other major economies were in positive territory during the review period, with the exception of Japan. As regards structural factors important for global reserve allocation, recent ECB staff research suggests that economies with strong trade and financial linkages with the euro area and which use the euro as an anchor currency have a larger share of the euro in official foreign exchange reserves (Box 1).
Chart 4
Interest rates in the euro area remained in negative territory in 2020
5-year and 1-month interest rate in major economies in 2020
(percentages)

Sources: Refinitiv Datastream, BIS and ECB calculations.
Note: The 5-year government yield for the euro area is calculated as a debt-weighted average of 5-year euro area yields of sovereigns with at least an AA credit rating according to Standard and Poor’s.
The trend towards gradual diversification of global reserve portfolios continued in 2020. At constant exchange rates, the share of currencies other than the euro and the US dollar increased by 0.7 percentage points over the review period (Chart 3). The increase largely reflected purchases of official reserve assets denominated in Chinese renminbi, the share of which increased by 0.3 percentage points, and in Canadian dollars, with an increase of 0.2 percentage points. The share of other major reserve currencies was broadly stable (Chart 5).
Chart 5
The share of the euro declined at constant exchange rates in 2020 but increased when measured at current exchange rates
Changes in the shares of selected currencies in global official holdings of foreign exchange reserves
(percentage points; at current and constant Q4 2020 exchange rates)

Sources: IMF and ECB calculations.
Note: The latest observation is for the fourth quarter of 2020.
The onset of the COVID-19 pandemic led to a large sell-off of US Treasury securities by foreign investors, including official investors, in March 2020, which reversed in the course of the year as liquidity conditions improved. Official holdings of US Treasury securities declined by around USD 150 billion in March 2020, while private holdings declined by USD 130 billion (Chart 6, left panel).[6] Dislocations in the US Treasury market at the peak of the pandemic-related turmoil have been linked to a dash for cash by non-financial corporates, which were in turn redeeming shares by money market funds, and by leveraged investors, such as hedge funds.[7] At the same time, official investors have also taken part in these developments intervening in the foreign exchange markets to counter capital outflows. The sell-off of US Treasury securities by official investors was large by historical standards and unprecedented in the context of market turmoil. Arguably, oil exporters needed to raise cash to balance their budgets as oil prices slumped, so they intervened together with central banks in other emerging market economies to shore up their currencies. Indeed, excluding euro area investors, the largest declines in holdings of US Treasury securities by private and official investors in March 2020 were by Saudi Arabia and Brazil (Chart 6, right panel).[8] As market turmoil subsided and liquidity conditions improved after the Federal Reserve System took policy measures, foreign investors reaccumulated US Treasury securities throughout the rest of the year. By the end of 2020 official investors had increased their holdings of US Treasury securities by more than USD 100 billion.
Chart 6
The large but temporary sell-off of US Treasury securities by foreign investors at the peak of the COVID-19 crisis in March 2020 was more than offset by the end of 2020
Changes in holdings of US Treasury securities by official and private institutions (left panel) and by selected countries (right panel)
(USD billions)
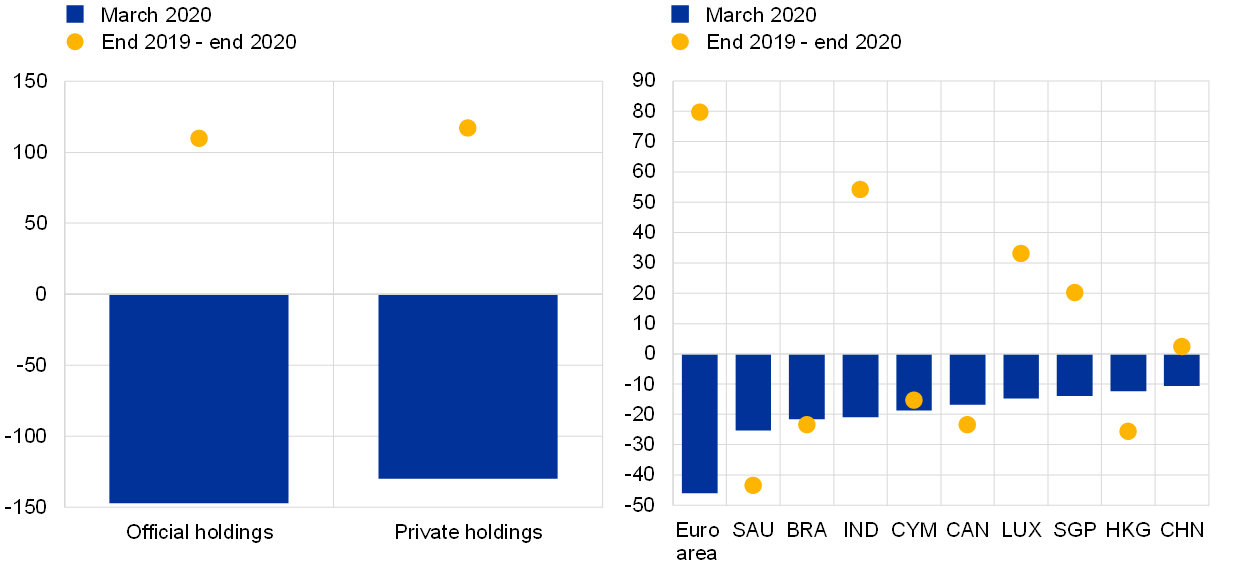
Sources: US Department of Treasury, Treasury International Capital (TIC) System and ECB calculations.
Notes: the right panel shows net purchases by both private and official investors. SAU: Saudi Arabia; BRA: Brazil, IND: India; CYM: Cayman Islands; CAN: Canada; LUX: Luxembourg; SGP: Singapore; HKG: Hong Kong; CHN: China.
Box 1
New insights on the currency denomination of official holdings of foreign exchange reserves
IMF staff recently published a new dataset on the official foreign exchange reserve holdings of individual countries broken down by currency.[9] The data shows official foreign exchange reserve holdings denominated in four major currencies (euro, US dollar, pound sterling and Japanese yen) for 14 advanced economies and 37 emerging market and developing countries over the period 1999-2018. The holdings in the country sample cover a sizeable share (over 40%) of global foreign exchange reserves in euro reported to the IMF.
This box examines these data, with a focus on the share of the euro in foreign official reserves. It shows that the appeal of the euro as an official reserve currency declined in the years following the global financial crisis and the euro area sovereign debt crisis but has since stabilised. The box also provides evidence of the importance of trade and financial linkages for the currency composition of official exchange reserve holdings.
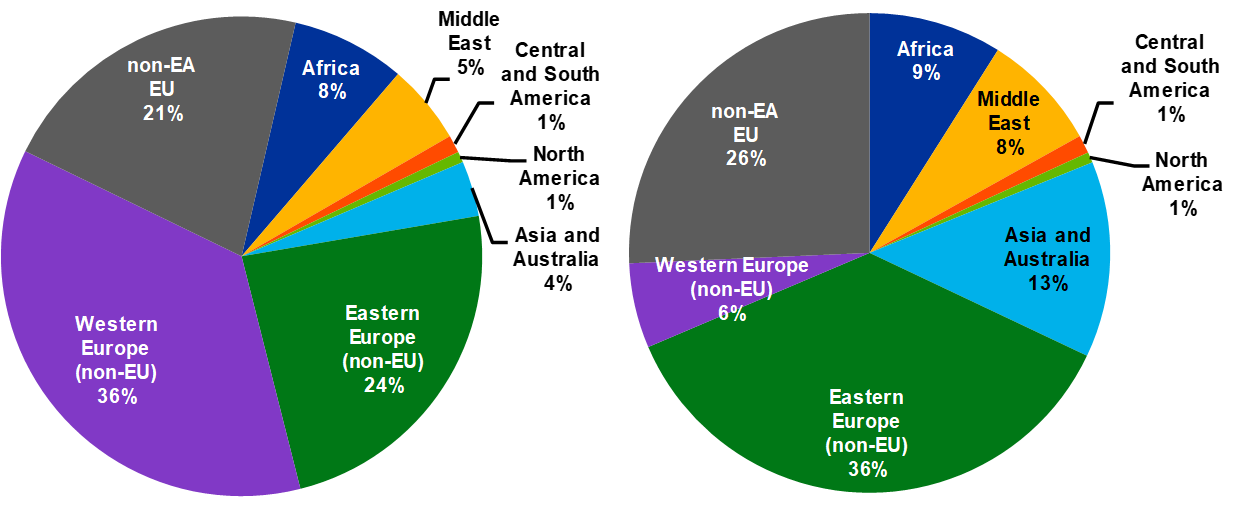
Russia and Switzerland are the largest foreign official holders of euro in the new dataset. These two countries combined account for more than half of reserve holdings denominated in euro in the new dataset and more than one-fifth of total reserves in euro (upper panel of Chart A). In particular, Switzerland held more than €300 billion in 2018, while Russia held about €180 billion euro, i.e. around 39% of their total reserve holdings for each.[10] Non-euro area EU Member States are also found to be significant holders of euro-denominated foreign exchange reserves in line with their strong strategic, trade and financial links with the euro area. However, some countries with sizeable holdings of foreign exchange reserves do not report the composition of their holdings to the public, including China, India, Taiwan and Singapore, and are therefore not covered in this dataset.
The decline in the share of the euro in official foreign exchange reserve holdings since the global financial crisis has been broad-based across official reserve holders. The new disaggregated data can shed light on the 5 percentages point decline in the share of the euro in global foreign exchange reserves holdings of the countries included in the official data since the peak in mid-2010. The lower panel of Chart A compares the average share of the euro in official reserve holdings in the period before the global financial crisis (2004-07) and the share of the euro in official foreign exchange reserves in 2018. The black dotted line is the 45-degree line. Therefore, countries below the line decreased the share of euro-denominated assets in their official foreign exchange reserve holdings after the global financial crisis and euro area sovereign debt crisis. Most countries in the sample decreased the share of euro-denominated assets in their official foreign exchange reserves holdings, with the exception of Bulgaria, Croatia, North Macedonia, Denmark and the Czech Republic. This suggests that non-euro area EU Member States and countries with managed exchange rates vis-à-vis the euro tended to reduce the share of the euro in their official foreign exchange reserve holdings less than other countries. Although Switzerland and Russia increased their holdings of euro in absolute terms, the share of the euro in their total reserves has declined since the global financial crisis, similar to most countries. Switzerland, Russia, Serbia and Turkey also reduced the share of the euro in their holdings relatively little compared to most countries in the sample.
Chart A
Switzerland and Russia increased their holdings of euro in absolute terms in recent years, yet the share of the euro in their total reserves has declined since the global financial crisis.
Evolution of euro-denominated official reserve holdings over time
(upper panel: USD billions (left-hand scale), shares of IMF COFER data (right-hand scale); lower panel: percentages of total reserves)

Sources: COFER, IMF and ECB calculations.
Notes: The chart in the upper panel shows reserves in euro by country and country groups; the sample includes 14 advanced economies and 37 emerging market economies and represents 42% of total euro-denominated official reserve holdings reported to the IMF. The chart in the lower panel compares the share of reserves in euro by country in 2018 and the average share of the euro in the period 2004-07. The size of the bubbles corresponds to the average amount of reserves held in euro between 1999 and 2018 by each country. The yellow bubbles are countries with exchange rate regimes closely linked to the euro. In 2018, Denmark was part of ERM II, Bulgaria and Bosnia and Herzegovina had a euro-based currency board, Croatia a tightly managed floating regime and North Macedonia a stabilised arrangement with the euro as a reference currency. Country ISO codes are used for country names for the sake of readability.
Empirical estimates shed light on the country-specific determinants of the share of the euro and other major reserve currencies in official foreign exchange reserve holdings. To this end simple repeated cross-sectional regressions are run using indicators for trade and financial linkages, and exchange rate anchoring, broadly following Iancu et al. (2020).[11] The model uncovers the determinants of reserve currency shares, not of the size of holdings. We confirm their findings, as trade and financial linkages and currency co-movement with respect to issuers of major reserve currencies both explain a substantial variation in the countries’ allocation of reserves across currencies.[12] Stronger trade and financial linkages with reserve currency-issuing countries are positively correlated with the share of reserves held in their respective currencies.[13] The exchange rate anchoring variable is highly statistically significant and has the expected sign: countries hold a larger share of reserves in currencies vis-à-vis which they manage their own currency. The upper panel of Chart B reports the coefficient on a dummy variable for the euro for each year. It confirms that, after controlling for bilateral trade and financial linkages and exchange rate anchoring, the share of the euro in official foreign exchange reserves was on average about 20 percentage points lower than the US dollar even before the global financial crisis. The deterioration in the appeal of euro after the global financial crisis and the euro area sovereign debt crisis is apparent in the fall in the estimated coefficient on the euro dummy variable, which reached -40 percentage points in 2015. The coefficient does not change much in the last three years of the sample, suggesting a stabilisation in the sentiment of official reserve managers towards the euro, broadly confirming the trends in standard aggregated data.
Chart B
Conditional difference in the share of the euro relative to the US dollar in official reserves and countries with significantly high (low) exposure to the euro.
Annual estimates of the coefficient on the euro dummy (upper panel); residual of the regression (lower panel)
(percentage points)
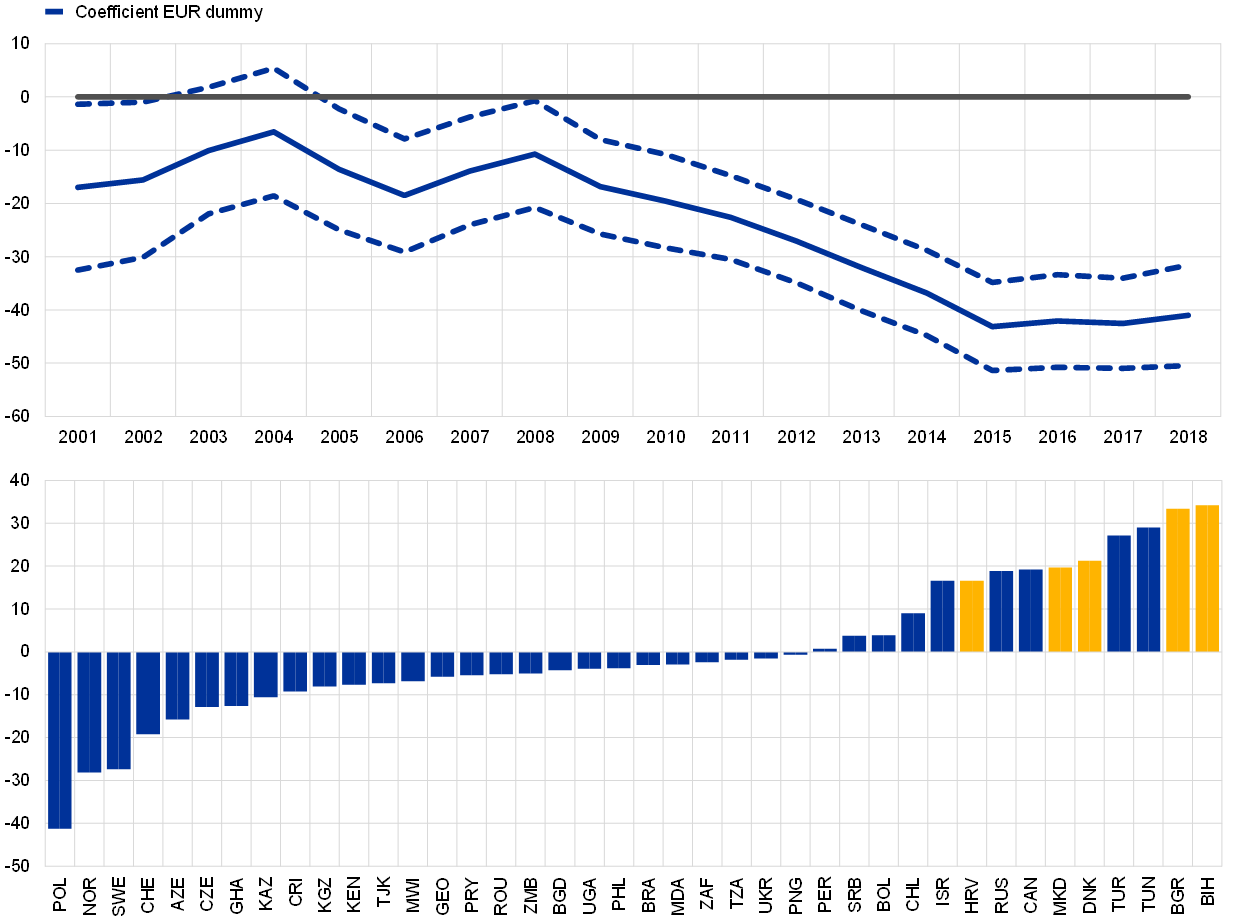
Sources: IMF, Iancu et al. (2020) and ECB calculations.
Notes: Upper panel: the solid line is the estimated coefficient of the dummy variable for the euro as a reserve currency. The dotted lines are the 95% confidence intervals. Lower panel: “excess” euro reserves calculated as the residual of the above equation using data for 2018. The yellow bars are countries with exchange rate regimes anchored to the euro. In that year, Denmark was in ERM II, Bulgaria and Bosnia and Herzegovina had a euro-based currency board, Croatia a tightly managed floating regime, and North Macedonia a stabilised arrangement with the euro as a reference. Country ISO codes are used for country names for the sake of readability.
Countries that manage their exchange rate with respect to the euro hold a higher-than-predicted share of their official foreign exchange reserves in euro. The lower panel of Chart B displays the residual from the cross-sectional regression obtained on data from 2018. It shows the countries which held a share of euro reserves that was higher than that predicted by the model. This result reflects the nature of the currency board arrangements maintained by Bulgaria, and Bosnia and Herzegovina in 2018. Although the variables included in the regression explain a significant fraction of patterns in currency shares, the model also tends to overpredict the share of countries with significantly strong trade and financial links with the euro area, such as Poland and Sweden, which points to the relevance of other motives. Such motives could also explain the higher-than-predicted share of the euro in the official foreign exchange reserves of Canada, which has stronger trade and financial links to the United States. At the same time, commodity exporters such as Norway, Azerbaijan and Ghana may prefer to hold a higher share of their reserves in US dollars to match export revenues in this currency. Finally, Russia also holds a higher share of euro reserves than predicted by the model, possibly reflecting Russia’s attempts to diversify its holdings owing to strategic considerations.[14]
2.2 The euro in global foreign exchange markets
The euro exchange rate strengthened over the course of 2020. The euro exchange rate vis-à-vis the US dollar was volatile in the first months of the COVID-19 crisis amid broader market volatility. However, it then entered a period of consistent appreciation from May onwards. Overall, the euro appreciated by around 9% against the US dollar and by over 7% in nominal effective terms over the review period (left panel of Chart 7). The appreciation of the euro effective exchange rate also reflected, among other factors, the weakness of several emerging market currencies and the pound sterling.
The appreciation of the euro against the US dollar primarily reflected the loosening of monetary policy in the United States following the onset of the COVID-19 pandemic and, subsequently, the rebound in global risk sentiment. Estimates obtained from a daily Bayesian vector autoregression (BVAR) model, where structural shocks driving the USD/EUR exchange rate are identified via sign restrictions, suggest that the appreciation of the euro against the US dollar over the review period can be largely ascribed to the loosening of the monetary policy stance of the Federal Reserve in response to the COVID-19 shock and stronger global risk appetite as the global economy began to recover from the shock (right panel of Chart 7). These developments led to a reversal of the flight-to-safety that characterised the immediate aftermath of the outbreak of the pandemic and have been instrumental in weakening the US dollar against most currencies.
Chart 7
The euro appreciated markedly against the US dollar on the back of looser US monetary policy and stronger global risk sentiment
Exchange rate of the euro against the US dollar and in nominal effective terms vis-à-vis the currencies of 42 major trading partners (left panel) and model-based decomposition of daily changes in the USD/EUR exchange rate in 2020 (right panel)

Sources: ECB and ECB calculations based on Brandt, L., Saint-Guilhem, A., Schröder, M. and Van Robays, I., “What drives euro area financial market developments? The role of US spillovers and global risk”, Working Paper Series, No 2560, ECB, Frankfurt am Main, 2021.
Notes: The nominal effective exchange rate index equals 100 on 1 January 2020. The model is a two-country Bayesian vector autoregression including the 10-year euro area OIS rate, euro area stock prices, the USD/EUR exchange rate, the 10-year EA OIS minus US Treasury spread, and US stock prices. The model is identified using sign restrictions on impact and is estimated using daily data in the period 2005-2020. An increase denotes an appreciation of the euro. The latest observation is for 31 December 2020 (left and right panels).
The introduction of the pandemic emergency purchase programme by the ECB and the announcement of Next Generation EU also supported the euro exchange rate by countering market perceptions of potential fragmentation risks, which had weighed on the euro in previous crisis episodes. Overall, the resilience of the euro exchange rates could indicate that investors exhibited a greater tendency to maintain or even increase their euro-denominated asset positions despite turbulent conditions in global financial markets.[15]
Evidence on the role of the euro in the foreign exchange market based on quantities suggests that the share of the euro in global foreign exchange settlements increased in 2020. Quantity-based data on foreign exchange transactions settled in the CLS system can provide suggestive evidence on the role of the euro in the foreign exchange markets.[16] At almost 39% in December 2020, the share of the euro in global foreign exchange settlements increased by over 3 percentage points compared with the level observed in December 2019 (left panel of Chart 8), primarily reflecting a noticeable increase in the share of the euro towards the end of 2020.[17] While this increase came largely at the expense of the US dollar, the data are volatile, and such developments are not unprecedented. Over the year as a whole the US dollar remained the leading currency in the foreign exchange market by a wide margin, as it was involved in about 90% of all settlements in December 2020, while the euro remained the second most actively settled currency.[18] Volumes of euro settlements increased by over 12% in 2020 compared with the previous year. Volumes of settlements in euro were at record highs in March 2020 at the peak of COVID-19 shock, before declining to less elevated levels towards the end of 2020 (right panel of Chart 8).
Chart 8
The share of the euro in global foreign exchange settlements increased in 2020
Share of foreign exchange transactions settled in CLS (left panel) and total value of euro-denominated settlements (right panel)
(left panel: percentages; right panel: EUR billion equivalents per month)

Sources: CLS Bank International and ECB calculations.
Note: The latest observation is for February 2021.
2.3 Use of the euro in international debt and loan markets
The euro in international debt markets
The share of the euro in the stock of international debt securities declined slightly in 2020, falling by 0.2 percentage points to stand at around 23% at constant exchange rates (Chart 9 and Table A4).[19] The share of the euro has declined since the mid-2000s by over 9 percentage points. By contrast, the share of the US dollar continued to rise, by 0.6 percentage points over the review period. The US dollar now accounts for about two-thirds of total international debt issuance at constant exchange rates. This increase in the share of the US dollar occurred despite temporary – but severe – strains in global US dollar funding markets at the height of the COVID-19 shock in March 2020.[20]
Chart 9
The share of the euro in the stock of international debt securities declined slightly in 2020
Currency composition of outstanding international debt securities
(percentages; at constant Q4 2020 exchange rates)

Sources: BIS and ECB calculations.
Notes: Narrow measure. The latest data are for the fourth quarter of 2020.
Developments in international issuance of foreign currency-denominated debt securities are consistent with this picture. The total volume of foreign currency-denominated debt issuance continued to increase over the review period, by 6%, to just over USD 2 trillion (left panel of Chart 10). This increase was largely attributable to a strong rise in issuance volumes of debt securities denominated in US dollars (USD 220 billion), whereas issuance volumes in euro decreased slightly (by USD 16 billion). As a result, the share of the US dollar in global issuance increased from approximately 60% in 2019 to 67% in 2020 – higher than the previous peaks of 2016 and 2017. By contrast, the share of the euro decreased by about 2 percentage points over the review period, to less than 22%. International issuance of foreign currency-denominated debt securities in currencies other than the US dollar and the euro decreased more significantly, by almost 30%. Their share therefore declined by about 5 percentage points over the review period, to stand at about 11%.
Chart 10
The share of the euro in international issuance of foreign currency-denominated debt securities decreased in 2020
Currency composition of foreign currency-denominated debt issuance
(left panel: USD billions; right panel: percentages)

Sources: Dealogic and ECB calculations.
Note: The latest data are as of end-2020.
Much of the increase in the issuance of international US dollar debt securities was driven by emerging market borrowers on the back of the accommodative monetary policy in the United States and the rebound in global risk sentiment after the peak of the COVID-19 shock. Despite the disruption to the real economy arising from the COVID-19 pandemic and associated lockdown measures, central bank actions, combined with substantial fiscal support measures, managed to restore orderly conditions in global financial markets. In particular, the US Federal Reserve responded by introducing a number of measures, including swap lines and emergency lending programmes, which served to ease tensions in US dollar funding markets.[21] Global risk aversion declined markedly in the second half of 2020, and the associated easing in global financing conditions prompted a marked increase in global debt issuance, in particular by large corporates, including foreign currency-denominated debt.[22] This was particularly evident in the case of issuers in emerging market economies, which have traditionally obtained funding from global debt markets in US dollars. This is confirmed by granular (i.e. security-by-security) issuance data, as US dollar-denominated debt issuance by emerging market borrowers increased by almost 13% in 2020 (see the green line in the left panel of Chart 11). Favourable US financing conditions also led to an increase in US dollar-denominated debt issuance in advanced economies, where the increase was concentrated in issuance by more highly-rated investment-grade corporate borrowers.[23] Together with supply factors, strong demand for US dollar-denominated fixed-income securities by large institutional investors based in the United States remained another important factor supporting the US dollar in international debt markets (Box 2).
The small decline in the issuance of euro-denominated debt securities was primarily due to a reduction in issuance by US borrowers, which was volatile over the review period. Issuance of euro-denominated debt by US borrowers, who were the largest issuers in 2019, decreased by more than 20% to around USD 120 billion in 2020 (see the light blue line in the right panel of Chart 11). However, the annual figure masks a surge in euro-denominated issuance in the first quarter of 2020, when it reached USD 50 billion, the highest quarterly volume since the global financial crisis. However, by the fourth quarter of 2020 US issuance of euro-denominated debt securities fell to below USD 10 billion – the lowest level in a decade. Euro-denominated issuance by US borrowers may have been dampened by the relative easing in financing conditions for US dollar-denominated debt issuance in the second half of 2020, as described above. In line with this, the interest rate differential between the United States and the euro area narrowed following the policy interest rate cut of the Federal Reserve in early March 2020.
Chart 11
Emerging market borrowers drove US dollar-denominated international debt issuance in 2020, while issuance of euro-denominated debt by US borrowers declined
Regional breakdown of US dollar-denominated (left panel) and euro-denominated (right panel) international debt issuance
(USD billions)

Sources: Dealogic and ECB calculations.
Note: The latest data are as of end-2020.
The combined issuance of euro-denominated debt securities by borrowers from advanced economies outside the United States increased. Although borrowers from the United Kingdom reduced their issuance of euro-denominated debt by around USD 5 billion, Japanese issuers and issuers in other advanced economies increased their own issuance by around USD 22 billion. Issuance of euro‑denominated debt securities by emerging market borrowers declined slightly and volumes remained relatively small.[24] Overall, euro-denominated international bond issuance decreased slightly to USD 459 billion in 2020.[25]
There was a sizeable shift from financial to sovereign issuers in the sectoral composition of international issuance of euro-denominated debt securities in 2020. Although financial and other services firms remained the most active issuers of euro-denominated international bonds, their share decreased by 9 percentage points, to 46%, in 2020 (left panel of Chart 12), in line with the continuous decline observed since 2018. By contrast, the share of sovereign issuers increased by more than 6 percentage points over the review period. They now account for about 16% of total international issuance of euro‑denominated debt securities, which reflects the increase in public sector budget deficits and debt issuance that followed the lockdowns and fiscal support measures associated with the pandemic.[26] Issuance of US dollar-denominated international bonds exhibited a broadly similar pattern, albeit less pronounced, with an increase of close to 2 percentage points in the share of public sector issuers, while the share of financial and other services firms declined by 2 percentage points (right panel of Chart 12). One factor that may have dampened the decline in the share of financial services is that banks were more likely to issue US dollar-denominated debt than euro-denominated debt between April and December 2020 compared with previous years, as recent research shows.[27]
Chart 12
The public sector accounted for a larger share of issuance of euro-denominated debt in 2020, but financial and other services remained the most active issuers
Sector breakdown of euro-denominated (left panel) and US-denominated (right panel) international debt issuance
(percentages)

Sources: Dealogic and ECB calculations.
The euro remains a key currency in international green bond markets, which have grown rapidly over the past decade. Global issuance of green bonds reached more than USD 250 billion in 2020 – a sevenfold increase relative to 2015.[28] Over half of total global green bond issuance was denominated in euro in 2020, although a sizeable share of this was attributable to euro area issuers. International issuance of green bonds, i.e. issuance in a non-local currency based on the issuer’s or the issuer parent’s nationality, also exhibited a strong and steady increase in market size in recent years. While this increase has been common to most major currencies in recent years, 2020 saw relatively rapid growth in international US dollar-denominated green bond issuance, consistent with the broader trends in international US dollar-denominated bonds described above (left panel of Chart 13). By contrast, volumes of euro-denominated international issuance of green bonds decreased marginally, along with the share of the euro (by about 4 percentage points). Still, the euro accounted for over one-third of total international issuance of green bonds in 2020, which is higher than the share of the euro in international debt issuance of about 22%. This was a threefold increase compared with 2016 (right panel of Chart 13).
Chart 13
The volume and share of euro-denominated international green bond issuance declined moderately in 2020
Currency composition of foreign currency-denominated green bond issuance
(left panel: USD billions; right panel: percentages)

Sources: Dealogic and ECB calculations.
Notes: Annual totals based on aggregation of individual deals. The latest observations are as of end-2020.
In terms of breakdown by issuer, international issuance of green bonds in US dollars remained dominated by emerging market borrowers, whereas borrowers from non-euro area EU Member States and other advanced economies were the largest issuers of green bonds in euro. Issuance of international US dollar-denominated green bonds by emerging market borrowers stabilised at around USD 17 billion in 2020 after increasing for several years. Emerging market borrowers accounted for around half of total issuance of international US dollar-denominated green bonds in 2020 (see the green line in the left panel of Chart 14). China accounts for the lion’s share of emerging market economies’ green borrowing in US dollars – about one-third – but Indonesia, Chile, Hong Kong, Saudi Arabia and Brazil are also active borrowers in this market. Issuance by the euro area and other advanced economies continued to increase substantially, from around USD 5 billion in 2019 to USD 8 billion in 2020. As regards international issuance of euro-denominated green bonds, borrowing from non-euro area EU Member States and other advanced economies remained dynamic, with their issuance increasing by about 40% and 30% respectively in 2020 (see the blue and red lines in the right panel of Chart 14). As a result, their combined share reached two-thirds of total international euro-denominated green debt issuance in the review period. At the same time, UK and US issuers reduced their issuance of euro-denominated green bonds, which explains why international euro-denominated green debt issuance declined moderately in 2020.
Chart 14
Emerging market borrowers still dominate US dollar-denominated international green bond issuance in 2020, while borrowers from non-euro area EU Member States and other advanced economies were the most dynamic issuers of euro-denominated green bonds
Regional breakdown of US dollar-denominated (left panel) and euro-denominated (right panel) international green bond issuance
(USD billions)

Sources: Dealogic and ECB calculations.
Notes: Annual totals based on aggregation of individual deals. The latest data are as of end-2020.
The euro in international loan and deposit markets
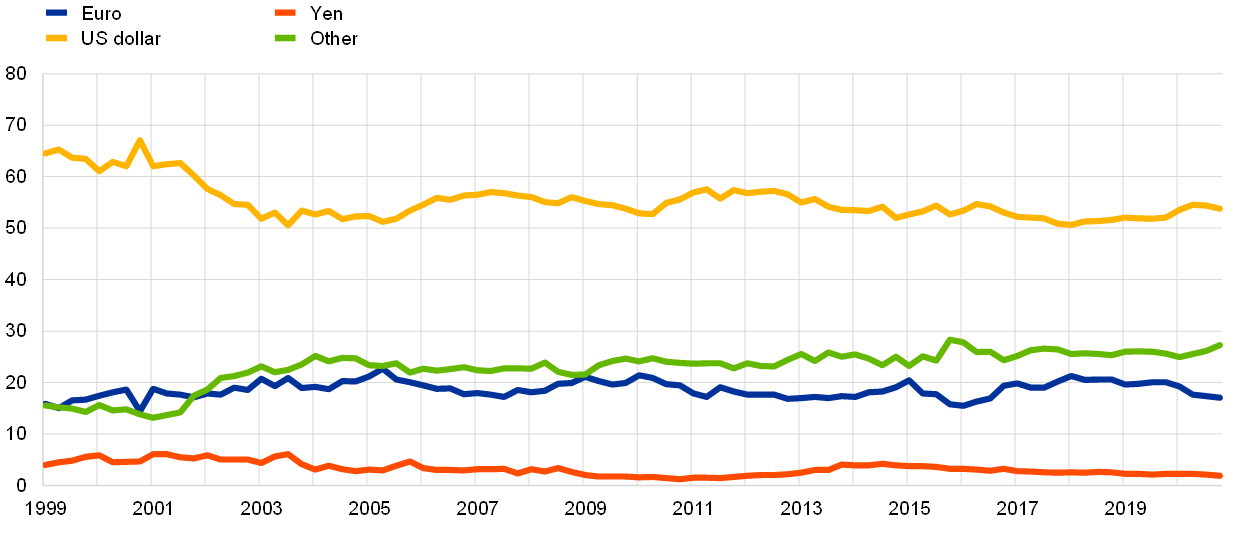
The share of the euro in international loan markets remained broadly stable in 2020. At constant exchange rates, the share of the euro in international loan markets decreased marginally by 0.1 percentage points in 2020, remaining just over 16% (Chart 15 and Table A6).[29] The share of the US dollar in international loan markets declined for a second year in a row by 1.4 percentage points. Nonetheless, the US dollar remained the leading currency by a large margin, accounting for around 54% of international loans.[30] The share of the Japanese yen declined marginally. The share of the remaining currencies increased by 1.6 percentage points, to reach around 27% of international loans extended in 2020.
Chart 15
The share of the euro in outstanding international loans remained broadly stable in 2020
Currency composition of outstanding amounts of international loans
(percentages; at constant Q4 2020 exchange rates)
Sources: BIS and ECB calculations.
Notes: The latest observations are for the fourth quarter of 2020. International loans are defined as loans by banks outside the currency area to borrowers outside the currency area.
The volume of international loans denominated in euro continued to increase despite the onset of the COVID-19 pandemic, reflecting both the ECB’s accommodative monetary policy stance and the resilience of euro area banks in comparison to previous crises.[31] In absolute terms, the volume of euro-denominated loans by banks outside the euro area to non-euro area borrowers increased by 12% in 2020, continuing the rising trend observed since 2016. In the years following the global financial crisis a combination of factors, such as deleveraging by euro area banks and regulatory efforts to reduce exposures to foreign loans, led to a decline in the volume of international loans denominated in euro (Chart 16).[32] By contrast, euro area banks were significantly more resilient in the face of the pandemic shock and were able to provide inter-office funding to extra-euro area branches and subsidiaries, rather than withdrawing to their home market as they did in the global financial crisis.[33] In addition, the ECB’s accommodative monetary policy stance may have helped to support euro-denominated funding in international loan markets, by allowing euro area banks to channel funds to their foreign branches and subsidiaries.[34] Finally, the increase in the supply of euro-denominated funding outside the euro area, including access to euro liquidity through swap and repo facilities provided by the Eurosystem to non-euro area central banks (Special Feature A, Box 7), is also likely to have supported lending in euro by banks outside the euro area.[35]
Chart 16
Volumes of international loans denominated in euro continued to increase in 2020
Amounts outstanding of international loans denominated in euro
(USD billions; at current exchange rates)
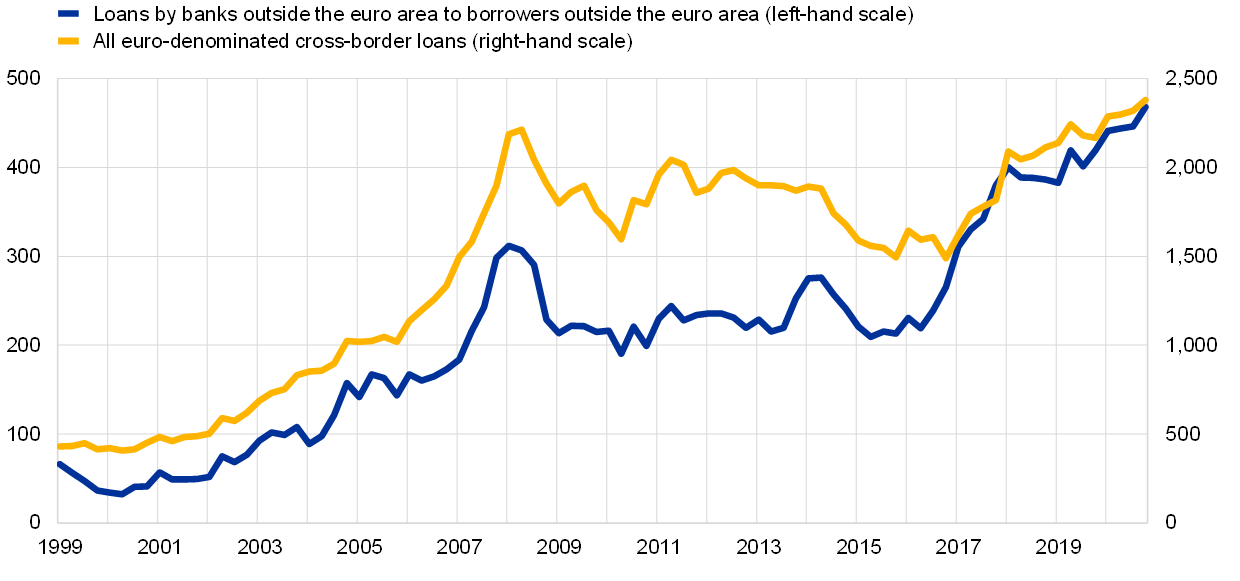
Sources: BIS and ECB calculations.
Note: The latest data are for the fourth quarter of 2020.
The share of the euro in outstanding international deposits declined by 3 percentage points in 2020. The share of the euro in the stock of international deposits stood at 17% in 2020 at constant exchange rates (Chart 17 and Table A7), its lowest level since 2016.[36] By contrast, the share of the US dollar in outstanding international deposits increased by 1.7 percentage points, to almost 54%. These developments reflect a marked increase in the volume of US dollar-denominated deposits at the peak of the pandemic, rather than a decline in euro-denominated deposits and in the attractiveness of the euro as an international store of value. Recent research suggests that non-bank financial institutions disposed of illiquid assets and parked the proceeds in US dollar bank deposits amid the dash for cash. Growth in US dollar deposit funding could also reflect the drawdown of committed credit lines by non-financial firms with the US affiliates of non-US banks, which leads automatically to a grossing-up of balance sheets.[37] Higher US dollar-denominated deposits therefore partly reflected an increase in precautionary holdings amid shortages of US dollar funding and liquidity in the dash for cash in March 2020.[38] More broadly, the policy measures by the US Federal Reserve in response to the COVID-19 shock, including asset purchases, substantially increased US dollar liquidity, which would also be expected to contribute to an increase in US dollar-denominated international deposits.
Chart 17
The share of the euro in outstanding international deposits declined in 2020
Currency composition of outstanding amounts of international deposits
(percentages; at constant Q4 2020 exchange rates)
Sources: BIS and ECB calculations.
Notes: The latest observations are for the fourth quarter of 2020. International deposits are defined as deposits with banks outside the currency area from creditors outside the currency area.
Box 2
The US dollar bias of US fixed-income funds
This box documents the evolution of currency exposures in the portfolio of US-based investment and mutual bond funds with a global mandate through the lens of a commercial dataset (Lipper for Investment Management). This dataset provides detailed information on the assets under management, currency denomination and country allocation of a large number of investment funds globally. Non-bank financial intermediaries (NBFI) play an increasingly important role as a source of finance globally. They have grown at a faster pace than banks in recent years and accounted for almost half of total assets under management in the global financial system in 2019.[39] Among NBFI, fixed-income funds hold a large share of financial assets, which amounted to almost USD 12 trillion in 2019, of which around 40% was held by funds domiciled in the United States according to the Financial Stability Board.
The sample used in this box consists of an unbalanced panel of the top fixed-income funds domiciled in and active outside the United States. The reasons for focusing on US funds are as follows: (1) the greater availability of detailed data for US funds compared with funds located in other constituencies, (2) the systemic importance of US funds on a global scale, and (3) the fact that investors are subject to “home currency bias” – i.e. where they invest disproportionately in assets denominated in their own currencies, even when investing abroad, a phenomenon which is particularly strong for US investors according to recent research.[40] The panel comprises more than 200 firms with assets under management of USD 780 billion in 2020, which represents almost 9% of total debt securities held by US fixed-income funds, as reported by Lipper. This reflects the fact that only a small fraction of US bond funds are active internationally, whereas the majority of them invest domestically, in line with the well-documented home bias effect.[41] The total assets managed by this sample of funds have increased almost continuously over the past ten years and have almost doubled in value since 2011 (Chart A). The majority of the assets held by US fixed-income funds active globally are denominated in US dollars (over USD 560 billion in 2020). These funds also hold a significant amount of assets denominated in euro and Japanese yen. US funds hold significantly fewer assets denominated in pounds sterling and renminbi, although assets in renminbi increased rapidly between 2019 and 2020.[42]
Chart A
Total assets managed by top US fixed-income funds active globally doubled in the past ten years
Total assets under management of a sample of fixed-income funds by currency
(USD billions; at constant 2020 exchange rates)
Sources: Lipper for Investment Management and ECB calculations.
To a large extent, the currency portfolio of top US fixed-income funds active globally reflects their geographical allocation, which is strongly tilted towards US securities. Around half of the portfolio of these funds is allocated to securities issued in the United States. This share is significantly higher than the share of US debt securities in global debt securities, which is just under 40% according to statistics produced by the Bank for International Settlements (BIS). This suggests that, even for these US-based funds with a global mandate, “home bias” is strong. Moreover, the funds hold assets mainly denominated in US dollars, which account for around 70% of their portfolio allocation, a share much larger than that of debt securities issued by entities resident in the United States in their portfolios. This reveals the existence of a strong “home currency” bias on the part of US investors (right panel of Chart B).[43] This finding is in line with recent empirical evidence showing that funds invest disproportionately in bonds denominated in the currency of their own country.[44]
The left panel of Chart B shows changes in the portfolio allocation of the sample of funds by currency and country. The euro is the second largest currency of denomination of their assets, accounting for a share of 9% in 2020. However, this share is lower than the exposure of US funds to the euro area (i.e. 12%). It is also lower than the share of euro area debt securities in global debt markets (of around 18%). This implies that US-based fixed-income funds have a negative bias towards the euro and the euro area (right panel of Chart B). By contrast, they showed a positive currency bias towards the Japanese yen in 2020. This was possibly due to deviations in covered interest parity between the US dollar and the Japanese yen, which led to higher “hedged” returns compared with simple “cash” returns on Japanese bonds for US investors seeking to obtain synthetic exposure to the yen with foreign exchange swaps and other derivative contracts. Finally, the data indicate that the renminbi plays a growing role in the portfolio of the sample of US fixed-income funds, as suggested by their increasing, albeit still small, exposure to Chinese bonds – a trend that is probably supported by the inclusion of Chinese bonds in major global bond market benchmark indices (see the last column of the right panel of Chart B) and the small positive currency bias in 2020 (right panel of Chart B).[45] The fact that currency exposure to the renminbi is larger than country exposure to Chinese issuers most likely reflects the use by Chinese issuers of offshore subsidiaries located in offshore financial centres.[46]
Chart B
Top US-based fixed-income funds have a negative bias towards the euro
Evolution of the portfolio allocation of the sample of funds by currency and country (left panel); currency bias estimates (right panel)
(Left panel: percentages; right panel: percentage points)

Sources: Lipper for Investment Management and ECB calculations.
Note: Currency bias is defined as the difference between the share of assets denominated in a particular currency and the share of securities in the total portfolio issued by residents of the economy issuing that particular currency.
In conclusion, three main findings emerge from this analysis. First, US-based funds have a strong “home currency” (i.e. US dollar) bias, as they hold most of their assets in US dollar-denominated securities although not necessarily in the United States, confirming the findings of recent empirical studies. Second, the euro is the second largest currency held in the portfolio of the sample of US-based fixed-income funds, but these funds display a negative “portfolio bias” towards the euro area and a negative “currency bias” towards the euro. Finally, there is a positive currency bias towards the Japanese yen and the Chinese renminbi. This possibly reflects factors specific to those currencies, such as changes in incentives to gain synthetic exposure towards the yen or the emergence of a segment of China’s domestic currency corporate bond market targeted at foreign investors via offshore financial centres.
2.4 Use of the euro as an invoicing currency
The share of the euro as an invoicing or settlement currency for extra-euro area trade decreased in 2020 for most transactions in goods and services. Some 60% of extra-euro area exports of goods were invoiced in euro in 2020, down from 61% in 2019. At just over 51%, the share of extra-euro area imports of goods invoiced in euro remained unchanged in 2020 (left panel of Chart 18 and Table A8). 61% of extra-euro area services exports were invoiced in euro in 2020, down from 63% the previous year. Likewise, 52% of extra-euro area imports of services were invoiced in euro in 2020, half a percentage point less than in the previous year (right panel of Chart 18). Looking back over the medium term, the share of the euro as an invoicing or settlement currency for extra-euro area trade has remained stable and close to the levels observed a decade ago. Box 5 describes initiatives by the European Commission to support the use of the euro in international trade, including through the development of euro-denominated instruments and benchmarks, and to foster its status as an international reference currency in the energy and commodities sectors. Special Feature C provides further insights on the role of the euro as an invoicing currency for global trade. It shows, among other things, that the euro is used as vehicle currency not only in Europe but also in parts of Africa, suggesting that the euro plays a dominant role in some regions, even if the US dollar is the dominant currency globally.
Chart 18
Developments in the share of the euro as an invoicing currency of extra-euro area transactions in goods were mixed in 2020
Share of the euro in the invoicing of extra-euro area trade in goods (left panel) and in the invoicing of extra-euro area trade in services (right panel)
(percentages)

Sources: ECB, IMF DOTS and ECB calculations.
Note: The latest data are for 2020.
2.5 Use of euro cash outside the euro area
The COVID-19 pandemic had some impact on foreign demand for euro cash outside the euro area. On the one hand, net registered shipments of euro banknotes to destinations outside the euro area declined by 2% over the review period – a magnitude not unprecedented in recent years (Chart 19). However, data collected from banknote wholesalers, which act as intermediaries between the national central banks of the Eurosystem and financial institutions outside the euro area, suggest that the pandemic had significant effects on extra-euro area transactions in euro banknotes. Sales (exports to regions outside the euro area) of euro banknotes halved in 2020, while purchases (imports from regions outside the euro area) fell by about 40% owing to travel restrictions imposed in response to the pandemic. Entities in countries neighbouring the euro area remained the main exporters and importers of euro banknotes (Chart 20), as the volumes of banknote exports and imports to these countries declined less significantly than elsewhere. The effect of the pandemic on household demand for euro cash was also visible in some central, eastern and south-eastern European economies in which tourism revenues play a major role (Box 3). These developments aside, recent ECB staff analysis provides new estimates for foreign demand for euro banknotes which aim to capture banknote migration via non-registered channels, such as tourism and remittances. According to these estimates, between 30% and 50% of the value of euro banknotes was held outside the euro area in 2019 – higher than previously thought (Box 4).
Chart 19
Net extra-euro area shipments of euro banknotes declined in 2020
Net monthly shipments of euro banknotes to destinations outside the euro area
(EUR billions; adjusted for seasonal effects)

Source: Eurosystem.
Notes: Net shipments are euro banknotes sent to destinations outside the euro area minus euro banknotes received from outside the euro area. The latest observation is for February 2021.
Chart 20
In 2020 euro banknotes were mainly exported to, and imported from, euro area neighbouring regions
Sales (exports, left panel) and purchases (imports, right panel) of euro banknotes to/from regions outside the euro area – breakdown by destination
(percentages)
Source: ECB calculations based on data from international banknote wholesalers.
Note: The data are for 2020.
Box 3
Household demand for euro cash in central, eastern and south-eastern European countries during the COVID-19 pandemic
In several central, eastern and south-eastern European countries which have not adopted the euro as legal tender, the use of financial assets denominated in euro – de facto euroisation – has remained a widespread phenomenon. For individuals, de facto euroisation is largely demand-driven. Relevant factors are the degree of trust in the stability of the local currency and expectations regarding the exchange rate. The experience of the crisis-ridden early transition years in the 1990s, which saw large devaluations and high inflation, had a strong and rather persistent influence on households’ demand for euro cash. This impact faded somewhat after 20 years, but was partially rekindled by the global financial crisis.[47] Similarly, the economic recession following the coronavirus (COVID-19) pandemic could affect trust and expectations and again lead to a reshuffling of portfolios. Economically affected individuals may also have no other choice but to draw on savings in euro cash. Moreover, a reduction in remittances could lead to a decrease in euroisation. Based on the latest vintage of the OeNB Euro Survey, this box provides some insights on whether euro cash demand and its determinants changed between autumn 2019 and autumn 2020.[48]
At the country level, the prevalence of euro cash holdings changed significantly between 2019 and 2020 in three out of the ten countries covered in the survey (Chart A). Decreases in the share of individuals holding euro cash in Albania and Croatia are presumably due in part to a decline in tourism revenues. In line with this interpretation, decreases are particularly pronounced in coastal areas.[49] In Croatia, the share of individuals holding deposits denominated in foreign currency more broadly also decreased significantly (from 73% to 60%).
Chart A
The prevalence of euro cash holdings changed significantly during the pandemic in some countries
Share of individuals holding euro cash
(percentages)
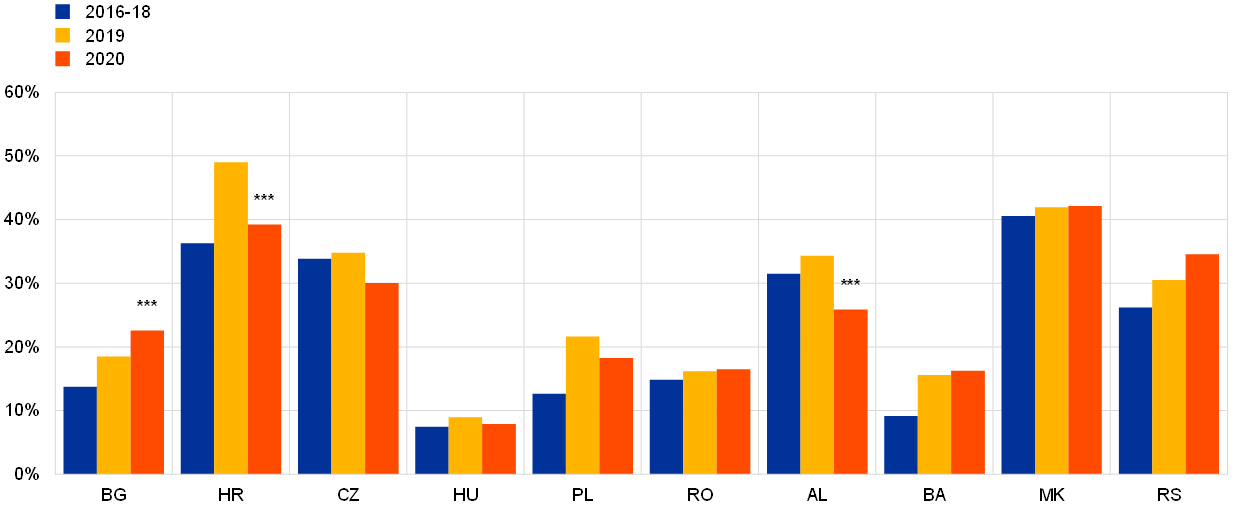
Source: OeNB Euro Survey.
Notes: Data are weighted. *** indicates a statistically significant change (at the 1% level) between 2019 and 2020.
Regression analysis allows heterogeneities to be studied at the individual level. In addition to asking about the prevalence of euro cash holdings, the OeNB Euro Survey requires individuals to indicate whether they prefer to hold their savings in cash rather than as deposits.[50] Moreover, it enquires about trust in the stability of the local currency relative to the stability of the euro – factors that are susceptible to affect demand for euro cash and deposits denominated in euro. The autumn 2020 survey also collected information on the extent to which respondents were economically affected by the COVID-19 pandemic.
Probit regressions based on the survey evidence provide preliminary insights on the effects of the pandemic. Chart B shows that an average individual “hardly affected economically” has a 23% probability of holding euro cash against a 28% probability for an otherwise comparable “most affected” individual – a 5 percentage point difference. Moreover, compared with the least affected individual, the latter is 9 percentage points more likely to prefer cash rather than deposits as a savings vehicle.
Moreover, the extent to which respondents are economically affected is negatively correlated with trust in the stability of the local currency, with the difference between the least and most affected individuals standing at 5 percentage points. By contrast, the extent to which individuals are economically affected by the pandemic appears to have no significant impact on trust in the stability of the euro.
To summarise, individuals who have been strongly affected economically by the pandemic tend to have lower trust in the stability of the local currency and demonstrate an increased demand for euro cash. At the aggregate level, however, significant changes are observed only in a few countries.
Chart B
Economic effects of the pandemic on households and indicators of demand for euro cash
Prevalence and demand for euro cash (left panel) and trust in stability of currencies (right panel)
(percentages, adjusted predictions at means)

Sources: OeNB Euro Survey 2020 and author’s calculations.
Notes: The chart shows marginal effects computed from probit regressions, where the dependent variables are: (i) euro cash holdings, (ii) preference for saving in cash, (iii) trust in the stability of the local currency, and (iv) the euro. Control variables are based on Stix (2013) and include socioeconomic characteristics, indicators of network effects, trust, past crisis experience and country fixed effects.
Box 4
New estimates of foreign demand for euro banknotes
A recent study on foreign demand for euro banknotes suggests that between 30% and 50% of the value of euro banknotes were held outside the euro area in 2019.[51] These estimates are obtained through a variety of methods that supplement the Eurosystem data on euro banknote net shipments abroad, which only take into account banking channels and exclude important informal flows, such as tourism and remittances.
Despite the difficulty of accounting for these unobserved channels, the new estimates are deemed robust and improve on previous estimates which showed that only around 30% of the value of banknote circulation was thought to be held abroad in 2017.[52]
One of the approaches used to produce the upper bound of 50% is the “seasonal method”. This compares the seasonality of euro cash issuance with that of a reference currency. In this case, the Canadian dollar, a typical benchmark currency in related studies, is used, as it exhibits certain characteristics that are similar to the euro in terms of cash usage, but lacks a strong international role.[53] This identification strategy relies on differences in seasonal patterns of both currencies, allowing estimates of the share of cash held abroad to be obtained. This method was used in 2017 to estimate the share of US dollars circulating outside the United States and suggested that around 70% of their total value was held abroad.[54] However, a direct comparison between these estimates is complicated and should thus be taken with a degree of caution.
As noted in past editions of this report, a number of factors explain foreign demand for euro banknotes, which are used for both transactional and store-of-value purposes. Among others, these include local economic conditions in countries demanding euro banknotes, trust in the local financial systems and local currency and, lastly, expectations about the future adoption of the euro.
3 Special features
A EU and ECB policy responses to the COVID-19 pandemic and the international role of the euro
The coronavirus (COVID-19) pandemic triggered a strong policy response by European Union (EU) policymakers and the ECB to counter the economic fallout of the crisis. Several elements of the policy reaction, such as the launch of new EU borrowing programmes by the European Commission and the ECB´s policy response, may have implications for the global status of the euro. Moreover, in January 2021 the European Commission launched a new strategy to foster the international role of the euro.[55] The purpose of this special feature is to review these policy initiatives and analyse their implications for the international role of the euro.
The EU policy response to the COVID-19 pandemic and its implications for the international role of the euro
The fiscal policy response at the EU level to the economic fallout of the COVID-19 pandemic crisis was forceful and complemented policies at the national level. At the national level, euro area countries activated the fiscal policy lever to counter the economic impact of the pandemic, including fiscal emergency packages and extensive liquidity support measures in the form of tax deferrals and State guarantees. The budgetary impact of discretionary fiscal measures, amounting to around 4% of euro area GDP on average, is unprecedented compared with previous crisis episodes.[56] Crucially, national government measures have been complemented by the launch of a range of new facilities to be financed at the European level through debt issuance by the European Commission. Notably, these facilities include the temporary Support to mitigate Unemployment Risks in an Emergency (SURE) programme, providing financial assistance of up to €100 billion in the form of loans from the EU to affected Member States, and the Next Generation EU (NGEU), a €750 billion temporary instrument to support the post-pandemic economic recovery, which is expected to become operational in summer 2021 at the earliest. NGEU issuance will imply a maximum debt-based fiscal expansion of around 1% of GDP on average in the euro area over the period 2021-24, assuming that the support is used at the national level to finance additional expenditures.[57] To a large extent, the proceedings from these bond issuances will finance investment and structural reforms by EU countries that are expected to lift the growth potential of the EU economies and reduce divergences in the euro area.[58] When designing their country plans, Member States need to allocate at least 37% of the funds to support the green transition and at least 20% to support the digital transformation. The NGEU programme therefore has the potential to increase both the resilience of the euro area economy to global shocks and the attractiveness of the euro as a global investment currency.
The new EU bond issuances will constitute the largest ever euro-denominated issuance at supranational level, raising the attractiveness of the euro as an investment currency for international investors, in particular official ones. The bond issuances under the SURE and NGEU programmes contribute to increasing the global supply of safe assets, as the EU currently enjoys the highest creditor status by the majority of rating agencies.[59] Indeed, the first issuances of SURE bonds, amounting to almost €40 billion in the course of 2020, attracted considerable attention from investors, including non-euro area investors, whose share in total take-up of the new bonds at issuance ranged between 31% (20-year tenor) and 60% (5-year tenor). The higher take-up by international investors at the short end of the maturity structure is positively correlated with the higher share of central banks and official investors participating in these issuances, since these institutional investors have a lower tolerance for risk than other market participants (Box 7). This confirms the potential for these EU bond issuances to bolster the status of the euro as a major international reserve currency.
The new EU bond issuances will increase the amount of highly-rated euro-denominated assets and could represent a further step towards establishing a common European safe asset. Currently, a significant amount of highly-rated national government debt is already available in the euro area. However, the euro area government bond market is fragmented among different bond issuers with a wide range of credit ratings and different levels of liquidity, potentially discouraging foreign investors (Chart 21). Moreover, the insufficient depth of segmented euro-denominated bond markets discourages foreign issuers from issuing international bonds denominated in euro. The establishment of a well-designed common European safe asset could bring substantial benefits in terms of enhancing financial integration and stability, fostering financial development and allowing markets to develop a proper euro area term structure.[60] In turn, this will support the international role of the euro. To deliver these benefits, a common safe asset should have a very high credit standard, be resilient to idiosyncratic shocks and have sufficient size and liquidity. The new EU bond issuances represent a first step in the direction of establishing a European safe asset. They are expected to increase the safest tranche of euro area government bonds – currently around €2.2 trillion as of the third quarter of 2020 – by almost 40% over the next few years.[61]
Chart 21
Public debt markets in the euro area remain fragmented compared with those in the United States
Outstanding general government debt securities
(USD trillions)
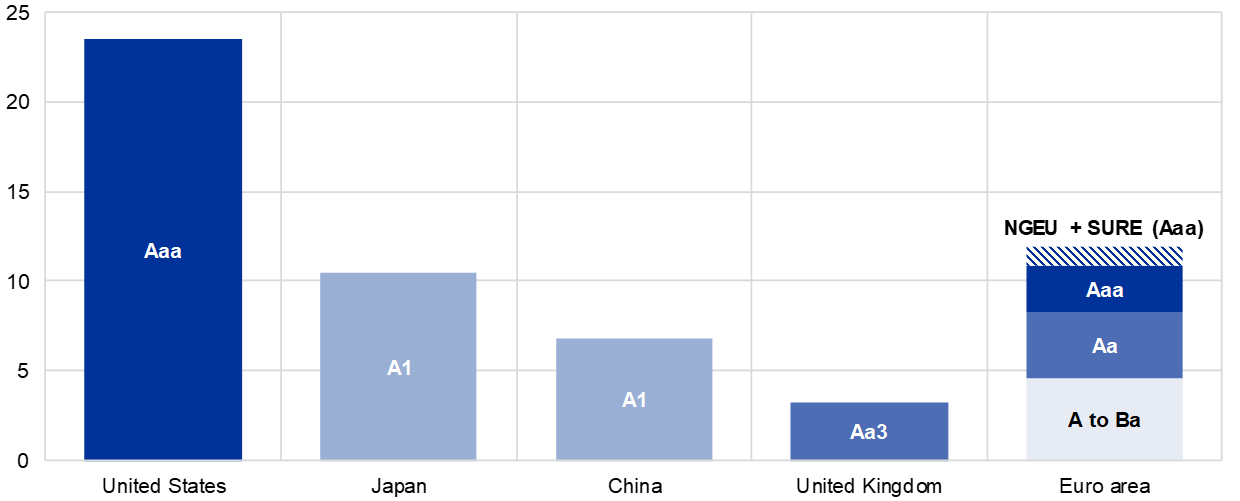
Sources: BIS, Haver Analytics, Bloomberg, European Commission and ECB calculations.
Notes: The data refer to total debt securities issued by the general government. Planned issuance for NGEU. The latest Moody’s local currency long-term sovereign debt rating is reported for each country and NGEU. The observations are for the third quarter of 2020 for the amount outstanding of debt securities and for March 2021 for credit ratings.
Nevertheless, as new EU bond issuances are still relatively small on a global scale and are also temporary, they are unlikely to fundamentally alter the international role of the euro, in particular its position as a global safe asset. Over the past two decades, a relative scarcity of safe assets – liquid assets that maintain or increase their nominal value even in the worst state of the world – has emerged.[62] On the demand side, this has been driven by several factors, such as international reserve accumulation and demographic factors, as well as rising global risk aversion and sizeable asset purchase programmes by the major central banks since the global financial crisis. At the same time, on the supply side, issuance of safe assets did not keep pace with rising demand, remaining relatively stable compared with world GDP over the past twenty years and only recently increasing above its long-run average owing to the large public debt issuance triggered by the COVID-19 crisis (Chart 22, left panel). To a large extent, safe assets are mainly in the form of US dollar-denominated securities. For instance, US dollar-denominated securities accounted for more than 70% of the securities included in the Bloomberg Barclays Global Aggregate – Aaa index, a global market benchmark for safe bonds, whereas euro-denominated securities accounted for only 16% in 2020.[63] Notably, the share of the euro in global safe assets has halved since the global financial crisis, as the debt of a number of euro area economies was downgraded (Chart 22, right panel). The size of planned EU bond issuances will not fundamentally alter the relative currency shares in the supply of global safe bonds and, so far, EU bonds have not been included in the sovereign segment of broad bond indices. In addition, the temporary nature of the new EU facilities is a drawback for establishing these bonds as a benchmark in the portfolio of risk-averse global investors. Recent evidence has shown that there are three main factors that make government bonds a safe asset: (i) the quality of institutions of the issuing economy, (ii) the size of the debt market, and, importantly, (iii) the past track record of government bonds in hedging global risk, i.e. whether the asset behaved like a safe asset in the past.[64] At the same time, government debt needs to be sustainable to receive a sufficiently high rating. While EU bond issuances will certainly possess the first characteristic, namely a strong credit quality, they rank below the US dollar as regards the second characteristic – size – and, crucially will not satisfy the third factor as long as they remain a temporary facility and do not have an established track record as a hedge against global risk, even though issuance of new bonds under this programme is likely to continue for decades once refinancing transactions of maturing bonds are taken into account.
Chart 22
Stable supply of safe assets against a declining share of the euro
Market capitalisation of Bloomberg Barclays Global Aggregate – Aaa Index relative to world GDP (left panel) and currency composition (right panel)
(left panel: percentages of global GDP; right panel: percentages of total market capitalisation of the index)

Sources: Bloomberg, IMF and ECB staff calculations.
Notes: The Bloomberg Barclays Global Aggregate - Aaa Index is a measure of Aaa index rated debt including treasury, government-related, corporate and securitised fixed-rate bonds.
The ECB policy response to the COVID-19 pandemic and its implications for the international role of the euro
Since the start of the COVID-19 crisis in early 2020 the ECB has taken monetary policy measures to dispel tail risks in financial markets, ensure credit supply and stabilise the euro area economy. Notably, ECB monetary policy measures include three elements, two of them directly aimed at the euro area economy – asset purchases and lending operations – and a third element – the provision of euro liquidity to non-euro area central banks through swap and repo lines – aimed at preventing indirect negative spillback effects from non-euro economies to the euro area. First, in March 2020 the ECB expanded the asset purchase programme and launched the pandemic emergency purchase programme (PEPP) in order to stabilise financial markets, contribute to easing the overall monetary policy stance and counter severe risks to the outlook for the euro area. The PEPP had an initial envelope of €750 billion, which was increased twice in the course of 2020, reaching an overall envelope of €1,850 billion in December 2020. Second, the ECB revised the structure and pricing of longer-term liquidity refinancing operations to provide banks with access to central bank liquidity and support the supply of credit to the euro area economy during the pandemic. In particular, the ECB lowered interest rates during the pandemic period, increased the borrowing allowance, added new operations and expanded the range of eligible collateral for targeted longer-term refinancing operations (TLTRO III), and introduced new pandemic emergency longer-term refinancing operations (PELTROs).[65]
The provision of euro liquidity to non-euro area central banks through swap and repo lines represents the third element of the ECB strategy to forestall the potential adverse implications of the COVID-19 crisis on the euro area economy. By ensuring that euro funding is available to counterparties outside the euro area, the Eurosystem’s swap and repo agreements help the ECB fulfil its monetary policy objectives. In particular, they prevent euro liquidity shortages from morphing into financial stability risks, avoiding forced asset sales and negative spillback effects stemming from the use of the euro by non-euro-area residents as a funding or investment currency.[66] Since the start of the pandemic crisis, the ECB has reactivated existing swap lines and established new swap and repo agreements with the central banks of several EU countries and non-EU countries in southern and eastern Europe. Finally, the ECB set up a new temporary Eurosystem repo facility (EUREP) to provide euro liquidity to a broad range of non-euro area central banks (Figure 1 for an overview and Box 6 for details), which did not meet the criteria for a bilateral liquidity line under the ECB´s framework. Even though these liquidity lines have only been drawn sporadically and for relatively small amounts, there is evidence that their sheer availability has been successful in mitigating stress in euro funding markets, preventing a tightening of lending and financing conditions in economies with strong economic and trade ties to the euro area (Box 6).
Figure 1
Eurosystem framework for providing euro liquidity to other central banks
a) Swap lines

b) Repo lines

Source: ECB.
Notes: Under the swap line arrangements, the ECB provides euro liquidity against currencies accepted by the ECB for swap line operations. Under the repo line arrangements, the ECB provides euro liquidity against adequate euro-denominated collateral accepted by the ECB. EUREP is the Eurosystem repo facility for central banks. The countries mentioned in the overview of the Eurosystem’s repo line arrangements are included by way of example to illustrate the functioning of these types of agreement. A double line in the swap lines overview indicates that the agreement is reciprocal.
The ECB’s response to the crisis may have had the side effect of supporting the international role of the euro. First, a global currency benefits from a central bank that acts as a credible backstop to safeguard liquidity conditions in the financial system in times of stress. According to recent research, a link exists between central bank policies in global downturns and firms’ debt currency choice in international markets.[67] By providing ample liquidity during the COVID-19 crisis, the ECB countered the negative effects of the pandemic shock to the euro area economy, enhancing the stability of the euro, which, in turn, can support its international status. Second, through its swap and repo lines, the ECB was one of the major central banks that offered access to its currency at the international level. The ECB provided liquidity lines for monetary policy purposes. By providing an effective backstop to private currency markets, the risk of fluctuations in euro funding costs in international markets for non-euro area residents is diminished. In turn, this may increase the attractiveness of financial and commercial contracts based on the euro and enhances confidence in euro asset markets.[68] The attractiveness of a currency in global banking and financial markets and its use as an invoicing currency for trade reinforce each other.[69] There is also evidence that currency swap lines and international currency usage are positively correlated. However, the direction of causality between the two is debated. Some observers see currency swap lines as an “exorbitant duty” and responsibility of a central bank that issues an international currency. Others claim that currency swap lines themselves foster international currency status. In any case, it might be plausible to assume that currency swap lines and international currency status tend to reinforce each other.[70]
Concluding remarks
National fiscal policies, the facilities that have been set up at the EU level and the ECB’s monetary policy have all supported a strong and cohesive economic recovery from the COVID-19 crisis, thereby enhancing the resilience of the euro area and the international role of the euro. EU bond issuances planned under the NGEU programme will significantly increase the amount of highly-rated euro-denominated assets and represent a further step towards establishing a common European safe asset. This will help to foster financial deepening and capital market integration in the euro area and, in turn, the international role of the euro. However, insofar as NGEU remains relatively modest in size compared with bond markets in other major currencies and is also a temporary initiative, it is unlikely, at this stage, to fundamentally change the global status of the euro. At the same time, NGEU is linked to investment and structural reforms which are expected to increase the growth potential of the euro area and its internal cohesion, thereby increasing the resilience of the euro area economy to global shocks and boosting the attractiveness of the euro as a global investment currency. Furthermore, the monetary policy measures taken by the ECB in response to the pandemic have been swift and forceful. They have helped to stabilise the euro area economy in the face of an exceptionally large shock. In addition, the measures it has taken to provide euro liquidity to non-euro area central banks have helped to forestall potential adverse implications of the crisis on the euro area. All these measures had a knock-on effect of supporting the global appeal of the euro over the review period.
Ultimately, the global attractiveness of the euro is primarily supported by a deeper and more complete EMU, including advancing the capital markets union. Similarly, pursuing sound economic policies in the euro area is important for the euro’s global attractiveness. Completing banking union would make the euro area more resilient, while progress towards a capital markets union would contribute to deeper and more liquid financial markets. In turn, this would indirectly support the international use of the euro as an international investment, financing and settlement currency.
Box 5
European Commission Communication on the European economic and financial system
On 19 January 2021 the European Commission issued a Communication on the launch of a new strategy to stimulate the openness, strength and resilience of the economic and financial system of the European Union (EU).[71]
The Communication stresses that the foundation for a stronger EU is a deep and well-functioning internal market. To this end, the EU must pursue policies that enhance growth and efficiency, and that support the green and digital transitions. Furthermore, the EU must continue its efforts to strengthen Economic and Monetary Union (EMU), in particular completing banking union and deepening the capital markets union. Building on this foundation, the Communication proposes an approach to strengthening the EU’s open strategic autonomy based on three mutually reinforcing pillars: (i) promoting a stronger international role of the euro, (ii) further developing EU financial market infrastructures and improving their resilience, including towards the extraterritorial application of sanctions by third countries, and (iii) further promoting the uniform implementation and enforcement of the EU's own sanctions.
As regards the pillar that consists of promoting the international role of the euro, the Communication outlines a series of targeted actions to promote the use of the currency. A first set of measures aims to increase euro-denominated trade in debt securities, commodities and related financial instruments. This includes promoting the use of the euro in the context of EU trade agreements, engaging with the main players in key strategic sectors and ensuring that financial market regulation allows EU financial markets to remain competitive and attractive for international market participants. A second set of measures relates to EU issuance and outreach to third-country investors and issuers. With the implementation of Next Generation EU (NGEU) and the Support to mitigate Unemployment Risks in an Emergency (SURE), the role of the EU as an international debt issuer will become more important. Building on this, the Commission intends to organise high-level contacts with market participants, in particular outside the EU, to promote investments in euro-denominated bonds. It will also launch outreach events to promote the use of the euro as an invoicing and denomination currency and foster a better understanding of the obstacles for its wider use. A third set of measures relates to the role of the euro in the green transition. The Commission aims to promote the use of green bonds as tools for the financing of investments and to issue in the form of green bonds 30% of the total amount of bonds issued under NGEU. Furthermore, it will look for possibilities to expand the role of the EU’s Emissions Trading System. A final set of measures regards the role of the euro in the digital era. This includes promoting digital finance and collaborating with the ECB to examine the possibility of introducing a digital euro.
This Communication was tabled as a contribution to the Euro Summit on 25 March 2021. In the concluding statement, Member States gave their support to the objective of strengthening the international role of the euro with a view to enhancing the EU’s strategic autonomy. They reiterated several points from the Communication, underlining the need for a robust recovery, further deepening of EMU and additional work to support the green and digital finance sectors.[72]
Box 6
The effectiveness of ECB currency liquidity lines
Liquidity arrangements among central banks are well-established instruments in central banks’ toolkits. They enable a central bank to receive currency issued by another central bank against collateral. They can be implemented through two basic types of operation: currency swaps and repurchase agreements (repos).[73] The need to activate these facilities emerges during episodes of global financial market stress, such as the global financial crisis or the recent pandemic shock, when global liquidity dries up, in particular in the main international reserve currencies. Against this backdrop, this box reviews preliminary findings on the effectiveness of the Eurosystem’s swap and repo line facilities.
Supporting the smooth transmission of monetary policy, the provision of euro liquidity to central banks outside the euro area formed part of the ECB’s response to the coronavirus (COVID-19) pandemic in 2020. The ECB has concluded swap and repo agreements with several European central banks for the provision of euro to complement: (1) the existing network of standing, reciprocal swap line facilities with the Federal Reserve System, Bank of Canada, Bank of England, Bank of Japan and the Swiss National Bank; (2) the bilateral, reciprocal swap line with the People’s Bank of China; and (3) the standing swap lines with Danmarks National Bank and Sveriges Riksbank, which the ECB has had in place for several years. In 2020 swap lines were concluded with the Bulgarian National Bank and the Central Bank of Croatia, and repo arrangements with the National Bank of Romania, the Central Bank of Hungary, the Bank of Albania, the National Banks of Serbia and North Macedonia and the Central Bank of the Republic of San Marino. Moreover, the Eurosystem repo facility for central banks (EUREP) was established in June 2020 as a precautionary backstop facility to address the pandemic-related euro liquidity needs of a broader set of countries outside the euro area than those that qualify for a bilateral swap or repo line. Overall, the ECB provides euro liquidity in particular to countries that are strongly oriented towards the euro, whereas swap lines by the Federal Reserve tend to be extended towards US dollar-oriented countries (left panel of Chart A).[74] Recent research has found that access to the liquidity arrangements of the Federal Reserve during the pandemic were driven by the close trade ties of the recipient economies with the United States.[75]
Although the use of euro liquidity lines has been limited in terms of the amounts drawn and the number of non-euro area central banks counterparts drawing on the lines, there is tentative evidence which suggests that the announcement of ECB’s liquidity lines has been effective in mitigating stress in local euro funding markets. A simple event study suggests that the announcement of a liquidity arrangement during the pandemic reduces the cost of euro funding in foreign exchange markets in countries with which a liquidity line was agreed (right panel of Chart A).[76] The announcement of a liquidity line was followed by an estimated decline in absolute terms in the currency basis of these countries of up to 20 basis points in the following two weeks.[77] While this methodology does not compare the effect of liquidity lines to those on a control group, other studies, including Albrizio et al. (2021), use alternative methodologies, such as difference-in-differences estimation techniques, and also find that liquidity line announcements led to a decline in funding costs.[78]
Chart A
Geographical distribution of euro and US dollar liquidity lines and impact of ECB liquidity lines
Average share of euro and US dollar-denominated issuance in international bond issuance in countries which received swap or repo lines in euro or US dollars (left panel) and event-study estimates of the change in the currency basis after ECB liquidity line announcements on selected economies (right panel)
(left panel: percentages; right panel: basis points)
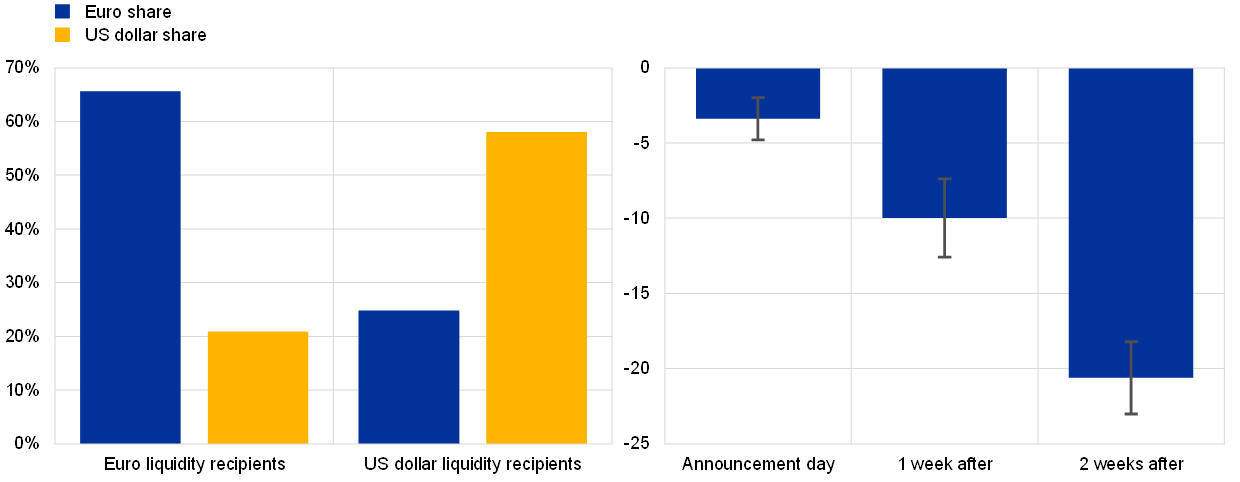
Sources: Dealogic and ECB calculations using data from Albrizio, S., Kataryniuk, I. and Molina, L., “ECB liquidity lines”, Working Paper, Banco de España forthcoming.
Notes: The chart in the left panel shows the euro (blue bars) and US dollar (yellow bars) share in total foreign currency-denominated bond issuance of countries, which have received a euro (left-hand column excluding China) or US dollar (right-hand column) liquidity line, excluding recipient G10 countries (i.e. Canada, the euro area, Japan, Sweden, Switzerland, the United Kingdom and the United States) since 1999. Euro liquidity recipients include Albania, Bulgaria, Croatia, China, Denmark, Hungary, Latvia, North Macedonia, Poland, Romania and Serbia. Latvia and San Marino are excluded owing to data limitations. US dollar liquidity recipients include Australia, Brazil, Denmark, Korea, Mexico, New Zealand, Norway and Singapore. The reference period is the fourth quarter of 2020. The chart in the right panel shows estimates from an event study of the effect of the liquidity lines obtained in 2020 by Bulgaria, Croatia, Denmark, Hungary and Romania on their corresponding currency basis, controlling for fixed effects, month effects and the VIX index. The estimates are obtained on daily data over the period 2010-2020.
Box 7
Non-euro area investors and SURE bonds issued by the European Commission
In October 2020 the European Commission carried out its first bond issuance under the Support to mitigate Unemployment Risks in an Emergency (SURE) programme.[79] This programme was created in response to the coronavirus (COVID-19) crisis, allowing the Commission to raise funds on behalf of the EU and provide back-to-back loans to Member States to support them in preserving employment. The first €17 billion SURE social bond represented the largest euro-denominated supranational transaction ever launched.[80] It was followed by two further issuances in November 2020 and one issuance in January 2021, which combined together amounted to €36.5 billion.[81] In total, the Commission is expected to issue up to €100 billion in SURE bonds between 2020 and 2021. This will be followed by the issuance of up to €750 billion in NGEU bonds over the years 2021-26.
The first issuances of SURE bonds, which received a AAA rating from most major rating agencies, attracted very strong investor interest. All the bonds issued in 2020 were highly oversubscribed (between 11.5 and 13 times), resulting in very favourable financing conditions. In the context of the international role of the euro, it is interesting to analyse the role of non-euro investors in absorbing the supply of these bonds. To this end, Chart A compares the geographical distribution of investors for SURE bonds (10-year, 15-year and 20-year issuances) and bonds of similar maturities issued by other EU sovereigns and supranational institutions in 2020. The data refer to distribution at the time of the first allocation of bonds. The chart confirms the strong interest in SURE bonds from investors outside the euro area, in particular for shorter maturities. Almost half of the take-up for the 10-year SURE bond came from investors located outside the euro area. This is comparable to the 10-year bond issued by the European Stability Mechanism (ESM) in 2020. A large share of the demand for the 10-year SURE bond came from investors based in the United Kingdom, who accounted for 20% of take-up, although ultimately some investors may be located in the euro area.[82] The participation of Asian (9%) and Nordic (8%) investors was also significant. For longer-term SURE bonds, the share of foreign investors was lower. Non-euro area investors accounted for 45% of the take-up for the 15-year SURE bond, which was comparable to foreign investor interest in the Italian 15-year BTP (41%). However, non-euro area investors accounted for only 31% of the take-up for the 20-year SURE bond, well below the equivalent value for the French 20-year OAT (50%).
Chart A
Geographical distribution of investors for different EU bonds
Investor distribution at the time of allocation, bonds issued in 2020
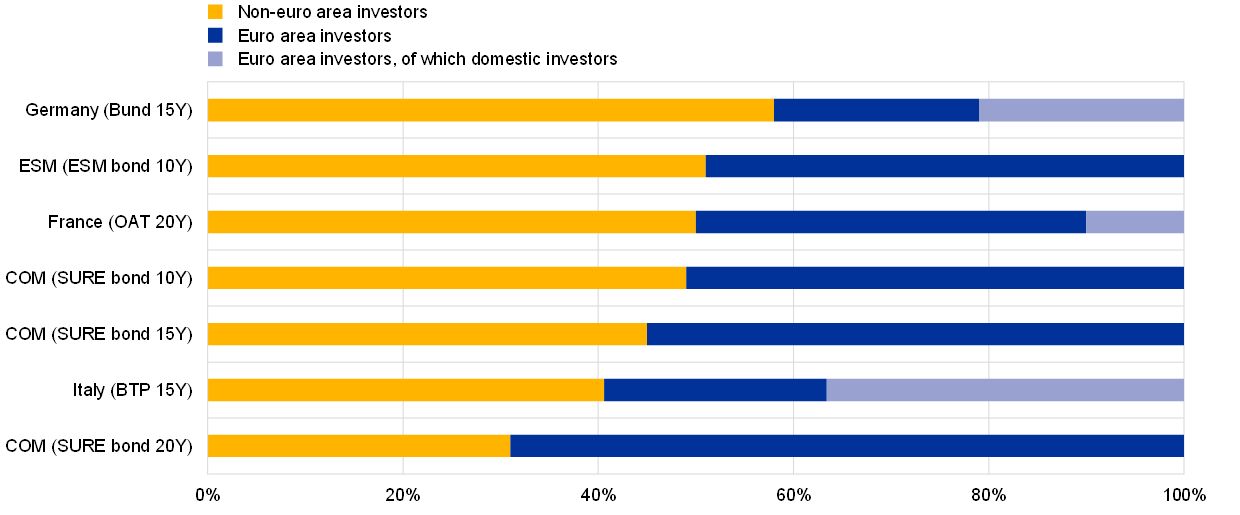
Sources: ECB staff calculations based on data released by the European Commission (COM), the ESM and national authorities.
Notes: The data refer to distribution at the time of the first allocation of bonds. Bond ratings (as assigned by at least two major rating agencies): German Bund (AAA); ESM bond (AAA); French OAT (AA); COM SURE bonds (AAA); and Italian BTP (BBB).
The available data suggest an inverse relationship between the maturity of the SURE bonds and interest from non-euro investors at their issuance, which presumably reflects the preferred habitat of investors participating in these bond purchases. Table A shows that the share of non-euro area investors in the bonds issued under the SURE programme progressively declines from 60% for the 5-year maturity to around 30-35% for bonds with a maturity longer than 20 years (see the last column of the table). At the same time, the table shows that the share of central banks and official investors ranges between 30% and 37% for shorter-dated bonds and declines to around 15% for longer maturities (see the fourth column of the table). Central banks and official institutions tend to have a lower tolerance for risk and to invest at shorter maturities. Since euro area central banks are not allowed under EU treaties to buy EU bonds directly in primary markets, the share of non-euro area investors for shorter-term bonds is larger. By contrast, pension and insurance funds generally invest at the long end of the maturity spectrum to match the duration of their balance sheet liabilities. These investors, however, tend to avoid foreign exchange risk, which may be subject to regulatory requirements and challenges in terms of hedging such risk. As a result, the EU’s longer-term bonds attract more investors from within the euro area.
Overall, strong interest from international investors in the first issuances of the SURE bonds confirms that the outstanding demand for safe assets is particularly elevated on a global scale. Together with the planned NGEU securities, bonds issued by the EU could become an important benchmark for the euro-denominated bond market segment for international investors, in turn fostering the international role of the euro. This would be more likely if the planned issuance of bonds by the EU, currently envisaged to be temporary, were to become a permanent facility.
Table A
SURE bonds – distribution by investor type and foreign participation
Investor distribution at the time of allocation of SURE bonds issued in 2020
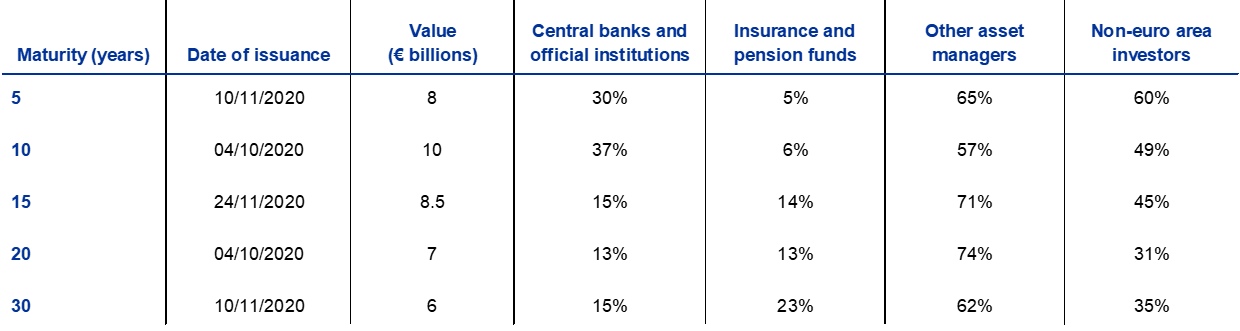
Sources: ECB staff calculations based on data released by EU and national authorities.
Notes: Data refer to distribution at the time of the first allocation of SURE bonds. “Other asset managers” includes the following categories: fund managers, bank treasuries, banks, hedge funds, others.
B Central bank digital currency and global currencies
The Report on the digital euro set out several scenarios in which the need to issue a digital euro may become important.[83] For example, in the event that the use of cash in the euro area declined significantly, in order to provide access to central bank money in an increasingly digital economy, or if foreign digital money were to largely displace existing domestic currency means of payment. Fostering the international role of the euro is not a prime motivation for issuing a digital euro. However, if the use of a digital euro in cross-border payments were allowed – a decision that remains to be taken – this would also have implications for the international role of the euro.
Against this background, this special feature examines how issuance of a central bank digital currency (CBDC) could impact the international role of currencies. It stresses that the global appeal of currencies depends on fundamental economic forces which digitisation is unlikely to alter. However, features specific to digital means of payment, including safety, low transaction costs and bundling effects, could ease international adoption of a currency. These features may combine to create positive feedback loops in the use of a currency as a means of payment and as a store of value and have effects on its global appeal. Moreover, the specific design features of a CBDC would be important for its global outreach and ultimately the international role of the currency in which it is denominated. Design features could influence the ability and incentives of non-residents to use the CBDC as a means of payment, unit of account and/or store of value. The special feature presents model simulations by ECB staff using a new structural macroeconomic model, which allows the effect of the different economic mechanisms at play to be quantified. The simulations suggest that a CBDC supports the use of a currency in cross-border payments but is not necessarily a game changer. As noted already, fundamental forces, such as the stability of economic fundamentals and size, remain the most important factors for international currency status.
Why a CBDC matters for international currency status
The global appeal of a currency depends on fundamental economic forces, which digitalisation is unlikely to alter. Such determinants include, for instance, the size of the issuing economy in terms of global trade and finance, the soundness of economic policies, financial market depth and liquidity, and inertia in international currency use.[84]
However, features specific to digital means of payment could ease international adoption of a CBDC. One such feature is safety, as a CBDC would be a claim on the balance sheet of the central bank of issue. This might increase both its appeal for domestic users and its attractiveness for retail trade transactions across borders and as a store of value, i.e. the CBDC units held for future payments, such as in a digital wallet. Safety helps to mitigate the risks associated with traditional forms of payment for cross-border transactions in goods and services, which involve, for instance, counterparty risk in correspondent banking relationships.[85] Low transaction costs are another feature. A CBDC would have the potential to widen access to payment services, promote financial inclusion and lower mark-ups of traditional intermediaries. If made interoperable with non-domestic payment systems, it could contribute to filling gaps or correcting inefficiencies in cross-currency payment infrastructures, including for transfers of remittances. Lastly, programmability and bundling effects are other features specific to many digital means of payment. Bundling effects are related to the fact that they can be bundled with complementary services, giving rise to economies of scope and convenience benefits. For example, it has been suggested that a CBDC could facilitate the digitalisation of information exchanges in payments through e-invoices, e-receipts, e-identity and e-signature, allowing intermediaries to offer services with higher value added and technological content at lower cost.[86] It could also benefit end-users by giving rise to products that would compete with those offered by big tech firms.
These specific features may combine to amplify positive feedback loops in the use of a CBDC as a means of payment and as a store of value. Recent research suggests that a currency’s role as an invoicing or payment unit acts as a complement to its role as a store of value, resulting in positive feedback loops.[87] For instance, a large share of internationally traded goods is invoiced in US dollars and, therefore, demand for US dollar-deposits is also strong.[88] Since global demand for safe US dollar-denominated claims is strong, firms have an incentive to borrow in US dollars. In turn, this encourages firms to continue to invoice trade in that currency, because doing so increases certainty about their future revenues in US dollars, which can be used to pay back debts. A CBDC could affect this feedback loop in two ways. First, low transaction costs and bundling effects could increase its appeal for invoicing cross-border transactions – as a means of payment and as a unit to settle current transactions. In other words, this could increase the pool of retail trade transactions in goods and services that can take place digitally across borders and facilitate an expansion of global e-commerce.[89] Second, the safety of the digital euro could increase its appeal as a store of value and as a unit to settle future claims and transactions (as stressed above, as units held in digital wallets in view of future purchases of goods and services across borders). Complementarities between the CBDC’s role as a payment unit and as a store of value could be significant, and the resulting effect on the global appeal of the currency in which it is denominated would be stronger.
The availability of a CBDC could facilitate currency substitution in third countries with instable currencies and weak fundamentals. It might facilitate digital “dollarisation” in such countries, leading to the full or partial replacement of their currencies with the CBDC for local payments, as a savings vehicle and, ultimately, as the unit of account. This would strengthen the global status of the currency in which the CBDC is denominated but would also reduce monetary policy autonomy in the economies concerned.
Finally, attention should be paid to the risks to stability that might arise if a central bank does not offer a digital currency. One concern could be a situation in which domestic and cross-border payments are dominated by non-domestic providers, including foreign tech giants potentially offering artificial currencies in the future. Not only could this threaten the stability of the financial system, but individuals and merchants alike would be vulnerable to a small number of dominant providers with strong market power,[90] and the ability of central banks to fulfil their monetary policy mandate and role as lender of last resort would be affected. Issuing a CBDC would help to maintain the autonomy of domestic payment systems and the international use of a currency in a digital world.
Implications of alternative design choices for a CBDC
The specific design features of a CBDC would have implications for its global outreach and ultimately the international role of the currency in which it is denominated by influencing the ability and incentives of non-residents to use it as a means of payment, unit of account and/or store of value. These features include: (i) interoperability of the CBDC with non-domestic payment systems, (ii) anonymity of users, (iii) potential restrictions on use by non-residents, (iv) the CBDC’s remuneration, and (v) the underlying transfer/settlement mechanism, including modalities for offline payments.
Design choices related to interoperability with non-domestic payment systems are likely to have a significant impact on a CBDC’s global outreach.[91] A CBDC could be designed to interoperate and facilitate cross-border and cross-currency payments.[92] In the latter case, the foreign exchange rate leg of the payment transaction is particularly challenging to arrange. Unlike domestic payments, which can be settled in central bank money, it would involve two currencies – the CBDC and another foreign CBDC – which cannot be settled with a common asset, and requires an exchange rate to be fixed and sufficient market liquidity. Interoperability would underpin cross-border use and could be designed according to three options:
- One option would be to reduce barriers by enhancing compatibility features between domestic and foreign CBDCs. This would allow diverse CBDCs to coexist with harmonised payment messages, harmonised encryption standards, harmonised regulatory standards (such as harmonised know-your-customer checks and legal entity identifiers) and with overlapping operating times.
- Another option would be to interlink the domestic CBDC with other CBDC systems. This would allow diverse CBDCs to coexist with a shared technological interface or a shared centralised clearing system. Participants in one system could make direct payments in the other system, thereby reducing transaction costs and increasing the transparency of foreign exchange conversion costs.[93]
- A final option consists of integrating CBDC systems in a single payment system. Multiple CBDCs would coexist within a single payment system infrastructure and a single set of rules.[94] One benefit of this option would be to nest the foreign exchange conversion leg of the payment transaction in the payment system and to provide simpler cross-border technical and compliance requirements.
Of the three possible interoperability options, enhancing compatibility features requires the least effort in terms of global cooperation, suggesting that it might be able to be implemented by a relatively larger number of CBDCs. A single payment system would require more significant global cooperation efforts and is perhaps feasible for a smaller number of CBDCs.
Trade-offs between the benefits and costs of anonymity would have further implications for the global outreach of the currency in which a CBDC is denominated. Anonymity would bring benefits to users who value privacy and consumer protection. It would help to save on the costs of obtaining the identities of users through potential third-party infrastructure providers, such as internet providers. If anonymity were embedded in a security token (for instance, a smart card), this would make the use of a CBDC closer to that of a traditional banknote. In turn, anonymity might help increase the attractiveness of the CBDC to non-residents. Taking the euro as an example, a large share of euro banknotes – which are an anonymous means of payment – circulate outside the euro area. On the other hand, anonymity would prevent the identity of users being verified, thereby preventing its use being restricted for legitimate policy objectives.[95] For instance, anonymity would have to be balanced against the need to restrict cross-border flows to prevent large and volatile investment flows into the CBDC or to build safeguards against its misuse for the financing of terrorism, money laundering and other cross-border criminal activities by (non-)residents. Transparency or selective privacy would enable better compliance and know-your-customer checks to be implemented, thereby controlling illicit payment flows, for instance for large transactions. These safeguards would strengthen the reputation and credibility of the digital euro.
Restrictions would weigh on the global attractiveness of a CBDC. Introducing restrictions could help combat illicit payment flows and reduce the use of the CBDC as an investment vehicle, especially for large-value transactions. Restrictions are easier to implement if bank accounts are used to transact in digital currencies (see below). Alternatively, limits to individual holdings could be introduced through direct quantitative constraints, in other words by putting a ceiling on the amount of a CBDC that non-residents could use.[96] Information would possibly need to be acquired and verified before confirming payment with the CBDC to enforce the limits. However, restricting the access of non-residents to the CBDC would reduce its convenience for cross-border payments, if it were not interoperable with foreign payment systems. This would affect remittances and would not be in line with the G20’s objective to enhance cross-border payments. Limits on large-value transfer should apply not only for individual transactions but also for the value transacted over a certain period to prevent them being circumvented through the use of repeated, smaller-value transfers.
The global appeal of a CBDC would likely depend on its remuneration. Remuneration can be used to incentivise or disincentivise use of the CBDC as a store of value and indirectly also as a means of payment by domestic or foreign users (if they were allowed to use the CBDC). Non-residents could potentially find the CBDC particularly attractive as a store of value, leading to capital inflows and excessive upward pressure on the exchange rate. A design choice that aims to incentivise users to use the CBDC as a means of payment, and not as a form of investment that competes with other financial instruments, would introduce a tiered remuneration system in which the remuneration rate on CBDC holdings in excess of a given threshold would be set at unattractive levels.[97] Whether this would significantly reduce the attractiveness of the CBDC as a global store of value would depend on the price elasticity of demand from non-residents. In an extreme scenario that is typical of stressed financial conditions, where such demand is price-inelastic, the disincentive effects of a tiering system on decisions by non-residents as to whether to hold the CBDC might be lessened.[98]
Whether a CBDC would be designed as a bearer instrument or as an account-based instrument might also have an impact on the international attractiveness of the currency in which it is denominated.[99]
- A bearer CBDC (also referred to as a token-based or value-based CBDC) would reduce the need to use third-party infrastructure (such as internet providers in the case of offline use), would be compatible with full anonymity and easy to scale. These features could combine to increase the global attractiveness of the CBDC. A bearer CBDC would also be well-suited to providing offline payments, which would increase its convenience as a means of payment and presumably increase its attractiveness to non-residents. By contrast, as indicated in the ECB’s Report on a digital euro, a bearer CBDC that was designed to be fully anonymous would be less well-suited for introducing effective holdings and/or transaction limits, since the identity of users would be unknown – as they are for banknotes. This could undermine the fight against illicit payment flows to the detriment of the reputation and credibility of the CBDC.
- By contrast, an account-based CBDC would make it easier to restrict access to non-residents who intend to use it for illicit payment flows. However, this might reduce its attractiveness to non-residents compared with a bearer CBDC if, for instance, it meant that there were no possibilities to make offline payments.
Box 8
Model simulations of the impact of a central bank digital currency on the international role of a currency
The economic mechanisms through which a central bank digital currency (CBDC) could impact the international role of the currency in which it is denominated can be illustrated through the lens of a structural macroeconomic model. We use an extension of the three-country model of Eichenbaum et al. (2020) based on international trade in goods and assets, nominal and financial rigidities.[100] There are three countries (country 1, country 2 and country 3), each of which issue a currency (currency 1, currency 2 and currency 3). The model is extended in three directions.
- It includes different pricing strategies for exporters who choose between setting their prices in their currency (producer currency pricing, or PCP), in the currency of destination markets (local currency pricing, or LCP) or that of a third currency (dominant currency pricing, or DCP). The pricing paradigm matters for exchange rate pass-through and therefore for the simulation results of the model. PCP, LCP and DCP shares are typically calibrated to match observed patterns in data on invoicing currency. In the model, however, exporters choose the optimal invoicing currency to maximise expected profits.[101]
- Moreover, the model includes cash-in-advance constraints. In the model, agents need means of payment to purchase final goods. They use domestic cash to pay for domestic goods in all three countries. By contrast, internationally traded goods are paid for with short-term debt securities denominated in either currency. However, only currency 1 and currency 2 (the two international vehicle currencies of the model) can be used in transactions not involving their country of issuance, unlike currency 3. The presence of cash-in-advance constraints implies that agents need to save in short-term debt securities to pay exporters for future purchases of internationally traded goods. This enables the model to capture complementarities between the store of value and medium of exchange functions of international currencies, which is reminiscent of the mechanism developed by Gopinath and Stein (2020) leading to the dominant currency paradigm.[102] Moreover, short-term debt securities need to be liquidated before payment by paying a cost, which captures standard frictions in cross-border payments in terms of, for example, speed, cost and opaqueness.[103] Finally, short-term debt securities are remunerated at an interest rate that comprises a stochastic risk premium, which enables differences in safety between the alternative means of payment of the model to be introduced.
- Lastly, we add a CBDC to the model. The CBDC is issued by country 1. The CBDC can be used to pay for domestic goods in country 1, in the same way as cash. It can be used to pay for imports from any of the three countries, like short-term debt securities denominated in currency 1 or currency 2. There is a trade-off between using a CBDC or short-term debt securities in international payments. On the one hand, the CBDC is fully liquid: it can be used to pay for imports without paying liquidation costs ex ante, unlike short-term debt securities. Moreover, it is safe – it carries no risk premium. On the other hand, the remuneration rate on short-term debt securities is systematically higher than on the CBDC, which, in the baseline simulations, is set to zero to compensate for risk and liquidity frictions.
Simulations from the model illustrate the importance of the stability of economic fundamentals and size for international currency status. Global exports tend to be invoiced in the currency of the economy with the most stable economic fundamentals, as shown in the simulations shown in the left panel of Chart A. The simulations assume absence of capital controls, a 1% liquidation cost for debt securities and that each of the three countries accounts for one-third of global trade. The volatility of the economic shocks in each country is used to measure the stability of economic fundamentals.[104] The effect of stable economic fundamentals is significant – if the instability of economic fundamentals in countries 2 and 3 increases by one-third relative to country 1, the share of currency 1 in global export payments increases by 50%, to almost 90%. Economic size matters, too, as the simulations in the right panel of Chart A show. If country 1 is smaller, which is modelled by reducing its share of global trade from 33% to 20% and 10%, the share of currency 1 in global export payments decreases by almost 20 and 30 percentage points respectively. Economic scale therefore bolsters the use of an international currency in global trade.
Chart A
Model simulations on the importance of the stability of economic fundamentals and size for international currency use
Currency breakdown of global export payments (left panel) and share of currency 1 in global export payments (right panel)
(percentages)

Source: ECB calculations.
Notes: The left panel shows simulations based on a three-country DSGE model in the spirit of Eichenbaum et al. (2020), where it is assumed that there are no capital controls, a 1% liquidation cost for debt securities and symmetric 33% weights for each of the three countries. In the baseline simulation, the volatility of the shocks in countries 1, 2 and 3 are calibrated to 0.01, 0.015 and 0.015 respectively, against 0.01, 0.02 and 0.02 in the alternative simulation with weaker fundamentals in countries 2 and 3. The right panel shows simulations using the baseline assumptions (see the last bar) and simulations where country 1 is smaller (i.e. with weights of 10% and 20%).
The model simulations suggest that a CBDC supports the use of a currency in cross-border payments. However, it is not a game changer. The left panel of Chart B contrasts two model simulations – one without CBDC and the other simulation with a CBDC issued in country 1.[105] The CBDC visibly supports the use of currency 1 by reducing frictions and costs of cross-border payments relative to slower, costly and more opaque means of payments – the short-debt securities that need to be liquidated before payments in the model (see the increase in the blue bar in Chart B). However, the rise in the share of currency 1 in global export payments remains modest, at about 5 percentage points – less than a 10% increase relative to the baseline simulation without CBDC. The international role of currency 1 depends more importantly on fundamental forces discussed above, such as the stability of economic fundamentals and size.
Chart B
Model simulations on the impact of CBDC for international currency use
Currency breakdown of global export payments in alternative simulations
(percentages)
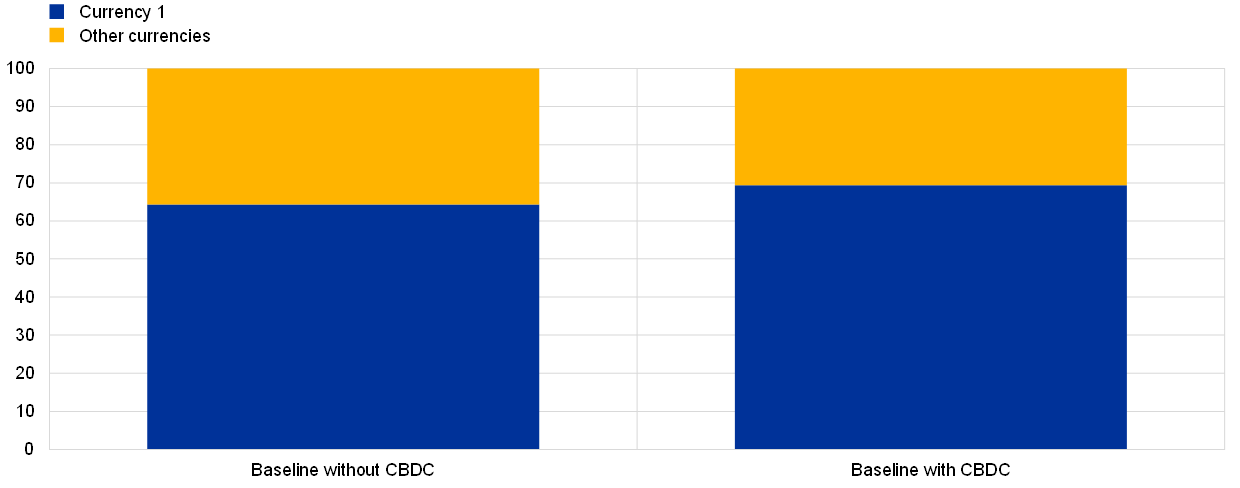
Source: ECB calculations.
Notes: The chart shows simulations based on a three-country DSGE model in the spirit of Eichenbaum et al. (2020) with the baseline assumptions (no capital controls, a 1% liquidation cost for debt securities, symmetric 33%-weights for all countries, and volatility of the shocks as discussed above).
Conclusion
The Eurosystem has not yet decided whether to go ahead with a digital euro project and, if so, whether the use of a digital euro in cross-border payments would be possible. If this was the case, a digital euro could also help support the use of the euro in cross-border payments by reducing the frictions and costs of euro-denominated cross-border payments. However, this would not be a motivation for issuing a digital euro and the effect it would have depends on design choices.
Moreover, the introduction of a digital euro would not necessarily be a game changer for the international role of the euro, which will continue to depend to a large extent on fundamental forces, such as stable economic fundamentals, size, and deep and liquid financial markets. A digital euro could contribute to strengthening the global appeal of the euro, but would not change the fundamental forces that define international currency status. From a global perspective, the roadmap for enhancing cross-border payments established by the G20, which includes a CBDC-related dimension, is an important forum for cooperation among central banks to discuss potential elements of a common framework on cross-border usage of a CBDC with a view to avoiding undesired effects.
C The euro as an invoicing currency for global trade
This special feature presents a new dataset that offers a comprehensive and up-to-date understanding of global trade invoicing patterns within the major currencies. It confirms earlier findings on the globally dominant role of the US dollar in invoicing and the overall stability of invoicing currency patterns. At the same time, the special feature also points to several new stylised facts. First, both the US dollar and the euro have been increasingly used as vehicle currencies, as indicated by the fact that invoicing in the currencies in question has increased notwithstanding the decline in the shares of the United States and the euro area in global trade. Second, the euro is used as a vehicle currency in Europe and some parts of Africa, which suggests that, even if the US dollar is the dominant currency globally, the euro has a dominant role regionally. Third, some European countries have seen significant shifts towards euro invoicing upon joining the euro area or the European Union, which indicates that inertia in patterns of international trade invoicing can be overcome. Finally, empirical estimates suggest that standard theoretical mechanisms that foster the use of a large economy's currency – i.e. strategic complementarities in price-setting and integration in cross-border value chains – underpin the use of the euro for international trade invoicing.
A new dataset on patterns in global trade invoicing
In a recent paper, European Central Bank (ECB) and International Monetary Fund (IMF) staff assembled the most comprehensive and up-to-date panel dataset of trade invoicing currency patterns for major currencies.[106] This dataset provides the respective annual shares of exports and imports invoiced in US dollars, euro, home currencies, and other currencies for 102 countries over the period 1990-2019.[107]
Overall, the countries in the dataset account for about 75% of global trade. Although coverage is sparse for the 1990s, it is quite comprehensive in more recent periods. In total, the dataset includes nearly 1,200 country-year observations for both imports and exports. The data are obtained from official sources through central banks’ websites and via requests sent to central banks, statistical offices and customs/revenue authorities. The dataset covers a diverse sample of countries. It includes 40 countries from Europe, 20 from Asia, 22 from Africa, 11 from Latin America, 4 from Oceania, 3 from the Middle East and 2 from North America. The country coverage is also diverse in terms of income levels: 35 countries are advanced economies and the remaining 67 are emerging market and developing economies.
The new data contribute to earlier efforts to assemble cross-country datasets of trade invoicing currency patterns along several dimensions. Compared with the study by Gopinath (2015), the dataset includes twice as many countries and, perhaps more importantly, also a time dimension. Relative to earlier datasets, it covers two to four times as many countries and has more systematic coverage over time.[108] It is noteworthy that, compared with these earlier studies, the new dataset contains information on a much larger number of emerging market and developing economies, for which vehicle currency use is more relevant. The substantial improvement in cross-country coverage of trade invoicing data is one of the paper's main contributions.[109] Finally, data quality is significantly improved for European Union (EU) countries compared with existing datasets by using information obtained within the Eurosystem to ensure that definitions of invoicing currency data are harmonised with regard to trading-partner composition. This contribution is important, because data on European countries account for a large share of the new and earlier datasets.
Stylised facts on global trade invoicing patterns
The dataset’s broad time-series coverage allows several stylised facts about the evolution of global and regional trade invoicing to be documented. The new data confirm previous findings on the US dollar's dominance and on the overall stability of invoicing currency patterns in global trade.[110] They include intra-euro area transactions, in line with Gopinath (2015). If intra-euro area transactions are excluded, the estimated share of the euro is lower, at around 30%, against around 50% for the US dollar.[111] The new data also reveal several new stylised facts.
First, the data indicate that use of the US dollar and euro as vehicle currencies has increased over time, despite the decline in the share of global trade accounted for by the United States and the euro area. This is apparent from Chart 23, which shows the increasing concentration of invoicing in US dollars and euro over time. In 2018 the share of global trade invoiced in US dollars was around four times larger than the share of global trade destined to the United States – significantly more than in 1999, when it was three times larger. The corresponding ratio also rose for the euro. The implication is that vehicle currency use has been on the rise.[112]
Chart 23
Use of the US dollar and the euro as vehicle currencies has increased
Shares of global exports broken down by destination (left panel) and by invoicing currency (right panel)
(percentages)
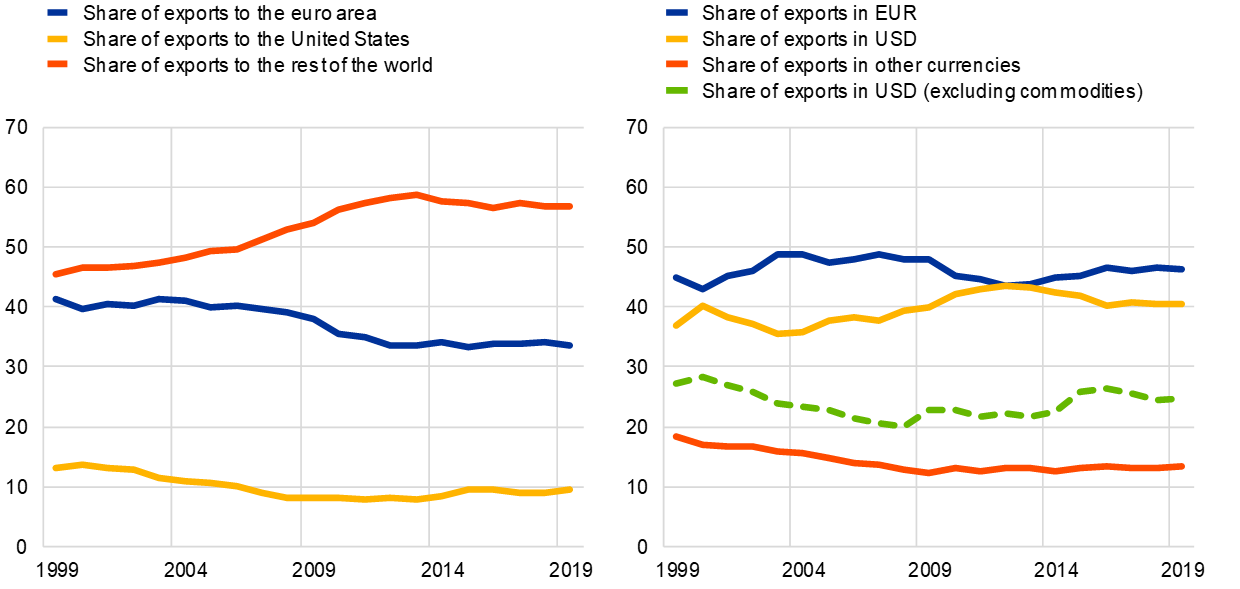
Source: Boz, E., Casas, C., Georgiadis, G., Gopinath, G., Le Mezo, H., Mehl, A. and Nguyen, T., “Patterns in invoicing currency in global trade”, Working Paper Series, No 2456, ECB, Frankfurt am Main, 2020.
Notes: The left panel shows the evolution of the share of exports to the United States, the euro area and the rest of the world in global exports; the right panel plots the share of global exports that are invoiced in US dollars, euro and other currencies. Only exports to countries for which invoicing data are available are shown. The charts are based on interpolated and extrapolated data.
The disproportionate role of the US dollar in global trade invoicing can also be discerned at the country level. The left panel of Chart 24 compares the share of countries’ exports to the United States in total exports with the share of their exports invoiced in US dollars; in almost all cases, the latter is much greater than the former. From a global perspective, the euro’s share in trade invoicing is more in line with the share of trade in which at least one euro area country is involved.
Still, it is interesting that the euro is used as a vehicle currency in certain regions. In particular, non-euro area European countries and several African countries use the euro for invoicing of more than just their exports to the euro area (these countries tend to cluster towards the top left-hand corner of the right panel of Chart 24). So even though the US dollar is the globally dominant currency in trade invoicing, the euro may be regarded as a regionally dominant currency in Europe and some parts of Africa, including countries of the CFA franc zone.
Chart 24
The US dollar is a globally dominant currency, while the euro is a regionally dominant currency in Europe and some parts of Africa
Trade and invoicing currency shares at the country level
(percentages)

Source: Boz, E., Casas, C., Georgiadis, G., Gopinath, G., Le Mezo, H., Mehl, A. and Nguyen, T., “Patterns in invoicing currency in global trade”, Working Paper Series, No 2456, ECB, Frankfurt am Main, 2020.
Notes: The chart presents scatter plots of the share of countries' total exports accounted for by the United States and the share of total exports invoiced in US dollars (left panel), as well as the share of total exports accounted for by the euro area and the share of total exports invoiced in euro (right panel). The 45-degree line is shown as a black dashed line.
Third, institutional and geographical proximity to the euro area and the EU seem to have triggered notable changes in invoicing currency patterns for several countries. Countries that are in the run-up to euro adoption or that joined the EU, EU candidate countries, and other European countries have experienced marked increases in the use of the euro as an invoicing currency – increases that typically occurred at the expense of the US dollar. Chart 25 illustrates this point by showing the full time-series data for selected European countries.[113] The increase in these countries’ export shares invoiced in euro is noticeable, especially when one considers that the shares of exports destined to the euro area have either been fairly stable or exhibited only modest increases. The rise in the share of exports invoiced in euro is typically paralleled by a decline in the share invoiced in US dollars. These findings are consistent with the theoretical literature's emphasis on the role of history, path dependence and nonlinearities in the choice of a trade invoicing currency, including discrete events, such as the establishment of currency unions and episodes of comprehensive institutional integration.[114]
Chart 25
Evidence of significant shifts in euro invoicing across countries
Evolution of invoicing and export shares for selected European countries
(percentages)

Source: Boz, E., Casas, C., Georgiadis, G., Gopinath, G., Le Mezo, H., Mehl, A. and Nguyen, T., “Patterns in invoicing currency in global trade”, Working Paper Series, No 2456, ECB, Frankfurt am Main, 2020.
Notes: The charts plot the evolution of US dollar (solid yellow lines) and euro export (solid blue lines) invoicing shares as well as US export shares (dashed yellow lines) and euro area export shares (dashed blue lines).
Box 9
New estimates of the determinants of global invoicing currency choice
Recent literature in the field of international macroeconomics departs from the standard open economy framework under which export prices are set in the producer’s currency. Rather than using the conventional assumption applied since the seminal work of Mundell (1963)[115], it is instead assumed that export prices are set in a so-called vehicle currency, i.e. the currency of neither the exporter nor the importer, but of a third country.[116] An important observation underlying this assumption – known in the literature as the dominant currency paradigm – is that most global trade transactions are invoiced in just a few currencies, most frequently the US dollar, but also the euro, regardless of the countries involved in the transaction.[117] It is therefore important to establish whether this assumption is supported by recent and comprehensive data, since the predictions of the dominant currency paradigm differ from those of the conventional assumption along several dimensions, such as the impact of exchange rate movements, the conduct of monetary policy and international spillovers of monetary policy from countries that issue a dominant currency.
The new dataset can help shed light on a range of international macroeconomic questions. First, it enables the role of vehicle currency invoicing for exchange rate pass-through to import prices and trade volumes to be revisited. Boz et al. (2020) combine the new dataset on invoicing currency patterns with expanded and updated datasets for bilateral trade price and volume indices to obtain estimates of exchange rate pass-through in the spirit of earlier literature, such as Gopinath et al. (2020). They find that the pass-through to import prices and trade volumes from fluctuations in US dollar exchange rates is higher than from fluctuations in the bilateral exchange rate between the importer's and the exporter's currencies. The propensity to invoice international trade transactions in US dollars drives the importance of the dollar exchange rate. These findings confirm the results of Gopinath et al. (2020), who conduct similar analyses on a smaller sample.
Moreover, the dataset can shed light on the determinants of invoicing currency choice. Recent theory suggests that complementarities in price-setting and cross-border input-output linkages are key determinants of an exporter’s invoicing currency choice (see, for example, Mukhin, 2018). This leads to four predictions. First, the large size of the United States and euro area as destination markets creates strategic complementarities in price-setting for exports. This is expected to encourage local currency pricing, whereby exporters to the United States (euro area) minimise deviations of their prices from the prices of their competitors by invoicing in dollars (euro). Second, the stability of marginal costs in their currencies in turn encourages US and euro area exporters to invoice in US dollars and euro respectively, and to choose producer currency pricing. Third, outside the United States and the euro area, strong complementarities in price-setting in markets for homogenous goods, such as oil and other commodities, encourage vehicle currency pricing in major currencies like the US dollar and the euro. Finally, countries other than the United States and the euro area that are integrated in global value chains are expected to use vehicle currencies for invoicing as hedges against shocks to marginal costs relative to their revenues. In a recent paper, Georgiadis et al. (forthcoming) compare these predictions with the data.[118] Table A gives a snapshot of their panel regression estimates. The dependent variable is the share of countries' exports invoiced in US dollars (in columns 1 to 3) and in euro (in columns 4 to 6). The table gives results for the full country sample (in columns 1 and 4), a sample excluding euro area countries (columns 2 and 5), and a sample excluding European countries, i.e. the euro area, other EU countries and a few countries in their neighbourhood (columns 3 and 6).
Empirical results largely confirm theoretical predictions. The share of exports invoiced in US dollars and euro increase with the share of a country’s exports to the United States and the euro area respectively. This is consistent with the prediction that strategic complementarities in price-setting encourage local currency pricing for large destination markets. The estimates for imports – not shown in the table – are similar, consistent with the prediction that the stability of marginal costs in their currencies encourage US and euro area exporters to choose producer currency pricing in US dollars and euro respectively. Moreover, the share of trade invoiced in US dollars tends to increase for countries which export more homogenous goods; by contrast, the share of the euro declines.[119] This suggests that complementarities in price-setting in homogenous goods like oil and other commodities encourage vehicle currency pricing in the US dollar at the expense of the euro. Finally, there seems to be no systematic relationship between invoicing in US dollars and euro and integration in cross-border input-output linkages and invoicing in dollars, while there is evidence for such a relation for the euro in the full sample.[120]
Table A
Regression estimates of the determinants of US dollar and euro invoicing
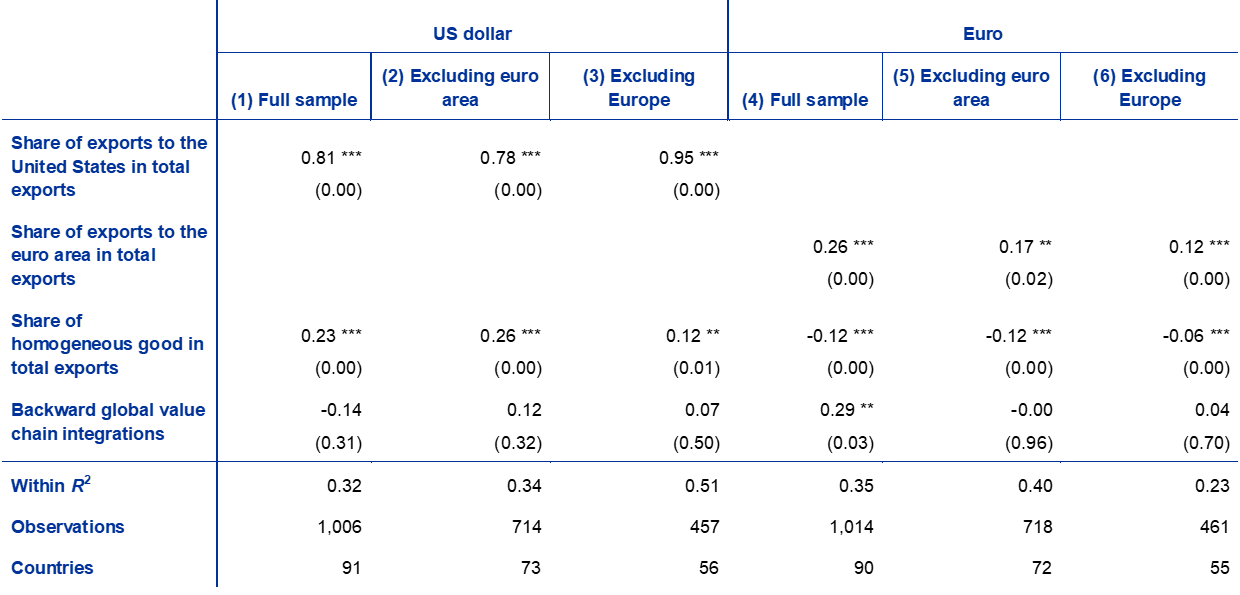
Source: Georgiadis et al. (forthcoming).
Notes: Inference is based on Driscoll-Kraay robust standard errors. p-values are reported in parentheses below the point estimates and *,** and *** indicate statistical significance at the 10%, 5% and 1% significance levels. Country and time-fixed effects are included in all regressions. The coefficient estimates for countries' bilateral exchange rates against the US dollar and the euro and for the shares of exports to countries have the US dollar (euro) as a currency anchor in total exports are not shown to save space.
The impact of global value chain integration on currency invoicing depends significantly on the extent of countries' trade with the United States and the euro area. This is visible from Chart A, which shows estimates of the marginal effect of global value chain integration on export invoicing conditional on imports from the euro area.[121] The blue solid line shows the marginal effects evaluated at different values of the share of countries' imports from the euro area. The grey shaded area shows the 90% confidence bands, while the yellow dotted line shows the distribution of the shares of imports from the euro area across the sample. As the chart makes clear, stronger integration in global value chains is associated with a higher share of the euro as an invoicing unit, but more distinctively when countries tend to trade to a more significant extent with the euro area and are therefore part of the European value chain.
Chart A
Global value chain integration associated with higher euro invoicing for countries in the European value chain
Marginal effect estimates of global value chain integration on euro invoicing conditional on imports from the euro area
(percentages)
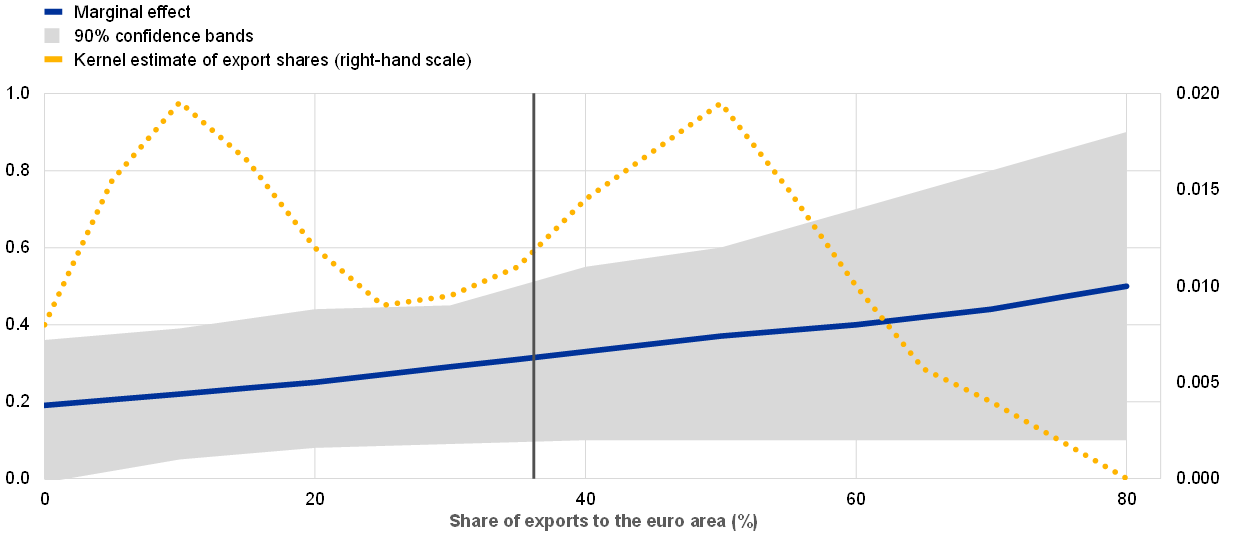
Source: Georgiadis et al. (forthcoming).
Notes: The chart shows estimates of the marginal effect of global value chain integration on export invoicing conditional on exports to the euro area. The blue solid line shows the point estimates evaluated for different values of the share of countries' imports from the euro area. The grey shaded area shows the 90%-confidence bands, while the yellow dotted line shows the estimated density of the shares of imports from the euro area across the sample.
Conclusion
The data presented in this special feature are relevant for future research. For instance, the data can help enhance analyses of the relationship between invoicing currencies and the effects of exchange rate movements, the role of international currencies and the global spillovers of monetary policy. Moreover, the findings that emerge from the analysis of these data have implications for policy. In particular, they suggest that preserving the euro area's openness to trade and the European value chain are important for the prospective role of the euro as a global invoicing currency.
4 Statistical annex
See more.
© European Central Bank, 2021
Postal address 60640 Frankfurt am Main, Germany
Telephone +49 69 1344 0
Website www.ecb.europa.eu
All rights reserved. Reproduction for educational and non-commercial purposes is permitted provided that the source is acknowledged.
For specific terminology please refer to the ECB glossary (available in English only).
The cut-off date for the statistics included in this report was 23 April 2021.
PDF ISBN 978-92-899-4743-5, ISSN 1725-6593, doi:10.2866/070753, QB-XN-21-001-EN-N
HTML ISBN 978-92-899-4744-2, ISSN 1725-6593, doi:10.2866/32538, QB-XN-21-001-EN-Q
- See the Statement by the Members of the Euro Summit, meeting in an inclusive format on 25 March 2021.
- In particular, the composite index of the euro’s international role declined in 2011 by 0.9 percentage points at constant exchange rates, compared with 0.5 percentage points at current exchange rates.
- For a related discussion on equities, see Bohn, H. and Tesar, L, “US equity investment in foreign markets: portfolio rebalancing or return chasing”, American Economic Review, Vol. 86, 1996, pp. 77-81.
- Purchases are derived from changes in holdings over the review period. Estimates account for exchange rate valuation effects that influence the amount of reserves denominated in euro and reported in US dollar terms. Estimates for purchases of US dollars and euro do not account for potential valuation effects stemming from changes in the price of the underlying securities in the portfolio of official investors, to the extent that these are reported at market value.
- See UBS 26th Annual Reserve Management Seminar Survey, September 2020.
- Reported changes in holdings do not account for valuation effects. According to Federal Reserve staff estimates, foreign investors are estimated to have sold more than USD 400 billion of Treasury securities in March 2020. Foreign official institutions accounted for more than half of these liquidations. See “Financial Stability Report”, Board of Governors of the Federal Reserve System, November 2020.
- See Schrimpf, A., Shin, H.-S. and Sushko, V., “Leverage and margin spirals in fixed income markets during the Covid-19 crisis”, BIS Bulletin, Bank for International Settlements, No 2, 2 April 2020.
- Bilateral country-level data do not allow for a distinction to be made between private and official investors.
- Iancu, A., Anderson, G., Ando, S., Boswell, E., Gamba, A., Shushanik, H., Lusinyan, L., Meads, N. and Wu, Y., “Reserve Currencies in an Evolving International Monetary System,” IMF Departmental Policy Papers 2020/02, International Monetary Fund, 2020.
- As discussed in previous editions of this report, these sizeable and increasing holdings may reflect the exchange rate management policies implemented by the Swiss National Bank, which is reported to intervene in foreign exchange markets to manage the Swiss franc exchange rate – a traditional safe haven in times of uncertainty. Russia had been among the main sellers of US Treasury securities between March and December 2018 to rebalance the currency composition of its official reserves, which explains the sizeable increase in their holdings of euro that year. See also “The international role of the euro”, ECB, Frankfurt am Main, June 2020.
- The regression equation is as follows: , where is a dummy variable for each currency i (where the US dollar is the reference currency), is the share of country c’s trade with a reserve issuer i, is the share of a country’s portfolio investment liabilities with reserve currency issuer i (according to the IMF CPIS data), and is the estimated exchange rate co-movement between the currency of country c and reserve currency i (Ilzetzki, Reinhart and Rogoff, 2019, op. cit.). This regression is run separately using OLS for each year t. The key results are similar if an alternative specification using a generalised linear model with a logit link is used.
- The of the regression ranges between 0.7 and 0.8, depending on the year of the regression.
- Each variable is generally statistically significant when included separately, but not when it is included simultaneously, suggesting that it is collinear.
- See also “The international role of the euro”, ECB, Frankfurt am Main, June 2020.
- See Lane, P.R., “The macroeconomic impact of the pandemic and the policy response”, The ECB Blog, 4 August 2020; Carvalho, D. and Schmitz, M., “Shifts in the portfolio holdings of euro area investors in the midst of COVID-19: looking-through investment funds”, Working Paper Series, No 2526, ECB, Frankfurt am Main, 2021; Demosthenes, I., Pagliari, M.S. and Stracca L., "The international dimension of an incomplete EMU", Working Paper Series, No 2459, ECB, Frankfurt am Main, 2020.
- CLS is operated by CLS Bank International, a specialised financial institution providing settlement services to its members in the foreign exchange market. Although not all foreign exchange transactions are settled in CLS, which partly reflects the fact that the foreign exchange market is largely decentralised, it has been estimated that over 50% of eligible global foreign exchange transactions are settled in CLS. This suggests that data on activity in CLS might be indicative of broader market trends.
- There was no Triennial Central Bank Survey of Foreign Exchange and OTC Derivatives Markets covering the review period. However, the data from CLS are broadly consistent with the survey conducted by the Bank for International Settlements in 2019, which suggested that the euro was the second most actively traded currency, accounting for around 32% foreign exchange transactions in April 2019.
- Since transactions in foreign exchange markets always involve two currencies, shares add up to 200%.
- The discussion here is based on the “narrow” definition of international debt issuance, which focuses on the foreign currency principle. This definition therefore excludes all domestic currency issuance, i.e. all those securities denominated in the currency of the economy where the issuer resides, from the standard (also known as “broad”) definition of international debt issuance. For instance, the narrow definition excludes a euro-denominated bond issued by a German company whether issued outside the euro area (e.g. in the United States) or inside the euro area (e.g. in France).
- Committee on the Global Financial System (CGFS), “US dollar funding: an international perspective”, CGFS Papers, No 65, 2020.
- See Cetorelli, N., Goldberg, L. and Ravazzolo, F., "Have the Fed swap lines reduced dollar funding strains during the Covid-19 outbreak?", Federal Reserve Bank of New York Liberty Street Economics Blog, Federal Reserve Bank of New York, 22 May 2020.
- See Goel, T. and Serena, J. M., “Bonds and syndicated loans during the Covid-19 crisis: decoupled again?”, BIS Bulletin, No 29, Bank for International Settlements, August 2020.
- This is consistent with IMF analysis, which suggests that facilities aimed at directly supporting corporate bond markets contributed to a surge in overall investment-grade bond issuance to levels well in excess of those observed in 2019. See IMF, “Global Financial Stability Review: Chapter 3 - Corporate Funding: Liquidity strains cushioned by a powerful set of policies”, October 2020.
- Issuance of euro-denominated debt securities by emerging market economies was less than 9% of the volume of their US dollar-denominated issuance in 2020.
- By contrast, the amount of outstanding euro-denominated international debt securities grew by around USD 450 billion. Stock and issuance figures may differ for a number of reasons, including on account of net redemptions and developments in stocks of money market instruments.
- IMF, “Fiscal Monitor: Chapter 1 – Tailoring Fiscal Responses”, April 2021.
- Aldasoro, I., Egemen, E. and Huang, W., “Dollar funding of non-US banks through COVID-19”, BIS Quarterly Review, Bank for International Settlements, March 2021.
- Green bonds accounted for around half of aggregate green, social and sustainability (GSS) debt issuance in the review period. A social bond is a fixed-income security the proceeds of which are used exclusively to finance or refinance social projects. The proceeds of sustainability bonds fulfil both green and social purposes. Global GSS debt issuance more than doubled between 2018 and 2020. Green bond issuance has risen over this period, too, but much of the recent GSS growth is explained by dynamic issuance of social and sustainability bonds, especially to finance COVID-19 response measures (see Sustainable Debt Global State of the Market H1 2020, Climate Bonds Initiative, 2020).
- International loans are defined as loans by banks outside the currency area to borrowers outside the currency area. For instance, international loans in euro correspond to all euro-denominated loans by banks outside the euro area to borrowers outside the euro area.
- This decline, and the contrast with the increase in US dollar-denominated bond issuance, is consistent with IMF analysis suggesting that favourable US domestic financing conditions in the aftermath of the first wave of the COVID-19 pandemic rested more on the buoyancy of bond markets, as lending standards for banks loans actually tightened somewhat (see IMF, “Global Financial Stability Review: Chapter 3 - Corporate Funding: Liquidity strains cushioned by a powerful set of policies”, October 2020).
- See Takáts, E. and Temesvary, J., "The currency dimension of the bank lending channel in international monetary transmission," Journal of International Economics, Elsevier, Vol. 125(C), 2020. Euro area banks entered this stress episode with stronger capital levels, better liquidity positions and more stable funding structures than they had at the time of the global financial crisis a decade before. See ECB, Financial Stability Review, May 2020.
- See the Recommendation of the European Systemic Risk Board of 21 September 2011 on lending in foreign currencies. For more on the retrenchment from cross-border positions by euro area banks following the global financial crisis, see Emter, L., Schmitz, M. and Tirpák, M., "Cross-border banking in the EU since the crisis: What is driving the great retrenchment?," Review of World Economics, Vol. 155(2), 2019, pp. 287-326; Everett, M., McQuade, P. and O’Grady, M., "Bank business models as a driver of cross-border activities," Journal of International Money and Finance, Vol. 108(C), 2020; McCauley, R.N., Bénétrix, A.S., McGuire, P.M. and von Peter, G., "Financial deglobalisation in banking?," Journal of International Money and Finance, Vol. 94(C), 2019, pp. 116-131.
- See Aldasoro, I., Ehlers, T., Egemen, E. and Huang, W., “Box A - US branches and subsidiaries of non-US banks and the Covid-19 shock”, BIS Quarterly Review, Bank for International Settlements, March 2021.
- This is consistent with research suggesting that international monetary policy transmission may be amplified by internal capital markets. See Cetorelli, N. and Goldberg, L.S., “Banking Globalization and Monetary Transmission”, Journal of Finance, Vol. 67(5), 2012. As global banks respond to domestic monetary shocks by managing liquidity globally through an internal reallocation of funds between headquarters and foreign branches or subsidiaries, their foreign lending is more affected by domestic shocks (see also Bénétrix, A. and Schmitz, M., “Euro-US dollar exposures in cross-border banking”, in The International role of the euro, ECB, Frankfurt am Main, 2019).
- See Panetta, F. and Schnabel, I., “The provision of euro liquidity through the ECB’s swap and repo operations”, The ECB Blog, 19 August 2020; and; Aldasoro, I., Cabanilla, C., Disyatat, P., Ehlers, T., McGuire, P. and von Peter, G. “Central bank swap lines and cross-border capital flows”, BIS Bulletin, No 34, Bank for International Settlements, December 2020.
- The definition of international deposits is equivalent to the definition of international loans. International deposits are defined as deposits with banks outside the currency area from creditors outside the currency area. For instance, international deposits in euro correspond to all euro-denominated deposits with banks outside the euro area from creditors outside the euro area.
- Banks were aware of the likelihood that these two sources of deposit funding were temporary, so there was no corresponding increase in lending (see Aldasoro, I., Huang, W. and Kemp, E., “Cross-border links between banks and non-bank financial institutions”, BIS Quarterly Review, Bank for International Settlements, September 2020; Aldasoro, I., Eren, E. and Huang, W., “Dollar funding of non-US banks through Covid-19”, BIS Quarterly Review, Bank for International Settlements, March 2021; Acharya, V. and Steffen, S., “The risk of being a fallen angel and the corporate dash for cash in the midst of Covid”, Review of Corporate Finance Studies, Vol. 09:03, 2020.
- Glancy, D., Gross, M. and Ionescu, F., “How did banks fund C&I drawdowns at the onset of the COVID-19 crisis?”, FEDS Notes, Board of Governors of the Federal Reserve System, 31 July 2020.
- Financial Stability Board, “Global monitoring report on non-bank financial intermediation 2020”, 2020.
- In contrast to US investors, investors from other countries invest both in assets denominated in domestic currency and in the US dollar (see Maggiori, M., Neiman, B. and Schreger, J., “International currencies and capital allocation”, Journal of Political Economy, Volume 128(6), 2020, pp. 2019-2066.
- Hau, H. and Rey, H., “Home bias at the fund level”, American Economic Review, Volume 98(2), 2008, pp. 333-338.
- Other currencies in the sample (not shown in the chart owing to their small shares) include the Australian dollar, the Brazilian real, the Canadian dollar, the Mexican peso and the Swiss franc.
- For the purpose of this box, “currency bias” is defined as the difference between the share of assets denominated in a particular currency and the share of securities in the total portfolio issued by residents of the economy issuing that particular currency.
- See Maggiori, M., Neiman, B. and Schreger, J., “International currencies and capital allocation”, op. cit.
- For instance, Chinese renminbi-denominated government securities were included in the Bloomberg Barclays Global Aggregate Bond Index in April 2019.
- There is empirical evidence that portfolio investments by advanced economies in emerging market economies are much larger than stated in official statistics and national accounts, since companies in emerging market economies use offshore subsidiaries to issue international debt and have access to international equity. Recent research finds that, after accounting for the nationality rather than the residence of bond issuers, US bond investments into China were ten times larger than official estimates in 2017 (i.e. not only USD 4 billion, as per Treasury International Capital data, but USD 48 billion); see Coppola, A, Maggiori, M., Neiman, B. and Schreger, J., “Redrawing the map of global capital flows: the role of cross-border financing and tax havens,” NBER Working Paper, No 26855, 2020.
- See Brown, M. and Stix, H., “Euroization of bank deposits”, Economic Policy, Vol. 30(81), 2015, pp. 95-139.
- The OeNB Euro Survey has collected information about individual euro cash holdings, saving and borrowing decisions using a nationally representative sample of individuals and looked into the economic opinions, expectations and experiences of survey respondents since autumn 2007.
- Note that the analyses are based on approximately 1,000 observations per country and wave, and that the regionally disaggregated data are based on a low number of observations. Looking at heterogeneity across individuals, one would expect the share of euro cash holders to be higher among workers in the tourism sector. Survey information for autumn 2020, however, shows that people employed or formerly employed in the tourism sector are not significantly more likely to hold euro cash than people employed outside the tourism sector. Regional data for Bulgaria also show a decrease in the share of euro cash holders in coastal regions, which is, however, more than offset by an increase in landlocked regions.
- See Stix, H., “Why do people save in cash? Distrust, memories of banking crises, weak institutions and dollarization”, Journal of Banking and Finance, Vol. 37, 2013, pp. 4087-4106.
- Lalouette, L., Zamora-Pérez, A., Rusu, C., Bartzsch, N., Politronacci, E., Delmas, M., Rua, A., Brandi, M. and Naksi, M., “Foreign demand for euro banknotes”, Occasional Paper Series, No 253, ECB, Frankfurt am Main, 2021.
- See the article entitled “Trends and developments in the use of euro cash over the past ten years”, Economic Bulletin, Issue 6, ECB, Frankfurt am Main, 2018.
- Several factors lead to the selection of the Canadian dollar as a reference currency, such as a similar use of banknotes for store-of-value purposes and seasonal patterns of banknote issuance that are comparable to those observed for the euro. Other potential candidates for reference currencies (e.g. the Danish krone, the Swedish krona or the Norwegian krone) fail to meet the relevant conditions required for this approach.
- See Judson, R., “The death of cash? Not so fast: Demand for U.S. currency at home and abroad, 1990-2016” , International Cash Conference 2017 with the theme “War on cash: Is there a future for cash?”, conference volume, Deutsche Bundesbank, 2017, pp. 200-248.
- Box 5 provides an overview of the Communication entitled “The European economic and financial system: fostering openness, strength and resilience” issued by the European Commission on 19 January 2021.
- See Haroutunian, S., Osterloh, S. and Sławińska, K., “The initial fiscal policy responses of euro area countries to the COVID-19 crisis”, Economic Bulletin, Issue 2, ECB, Frankfurt am Main, March 2021.
- See Giovannini A., Hauptmeier, S., Leiner-Killinger, N. and Valenta, V., “The fiscal implications of the EU’s recovery package”, Economic Bulletin, Issue 6, ECB, Frankfurt am Main, September 2020.
- The Recovery and Resilience Facility will account for €672.5 billion of the total envelope of €750 billion of the NGEU. This facility will disburse loans and grants to support reforms and investments by EU Member States to mitigate the economic and social impact of the coronavirus pandemic and improve the sustainability and resilience of European economies.
- All major rating agencies assign the highest creditor status to EU debt, with the exception of Standard & Poor’s, which assigns a lower rating (AA), similar to the rating assigned to US debt (AA+).
- See Alogoskoufis, S., Giuzio, M., Kostka, T., Levels, A., Vivar, L.M. and Wedow, M., “How could a common safe asset contribute to financial stability and financial integration in the banking union?”, in Financial Integration and Structure in the Euro Area, ECB, Frankfurt am Main, March 2020.
- The figure corresponds to the general government debt securities outstanding for Germany, the Netherlands and Luxembourg, the only three euro area sovereign that enjoy the highest creditor status.
- See Caballero, R.J., Farhi, E. and Gourinchas, P.-O., “The Safe Assets Shortage Conundrum”, Journal of Economic Perspectives, Vol. 31, No 3, Summer 2017, pp. 29-46. Some scholars disagree with the view that there is a global shortage of safe assets (see, for example, Cochrane, J., comments presented at the conference “International Monetary Stability: Past, Present and Future”, Hoover Institution, 5 May 2016).
- The Bloomberg Barclays Global Aggregate – Aaa Index is a measure of Aaa index rated debt including treasury, government-related, corporate and securitised fixed-rate bonds. As of the end of 2020 the index capitalised around USD 22 trillion. This is a lower bound for the universe of safe securities. For instance, US Treasuries account for around USD 9 trillion worth of securities included in the index, whereas US public debt amounts to USD 27 trillion as of the third quarter of 2020, according to the US Treasury. Nevertheless, excluding US Federal Reserve and Government accounts, privately held US Treasury debt is significantly lower, at USD 16.5 trillion. By using a different proxy for safe assets, such as the outstanding amount of public debt of countries with at least two major rating agencies assigning the highest creditor status, the share of the euro in the global supply of safe assets would be even lower, at around 10%.
- See Habib, M.M., Stracca, L. and Venditti, F., “The fundamentals of safe assets”, Journal of International Money and Finance, Vol. 102, 2020, pp. 102-119.
- For an assessment of the contribution of these monetary policy measures to countering the COVID-19 shock, see Lane, P., “Monetary policy in a pandemic: ensuring favourable financing conditions”, speech at the Economics Department and IM-TCD, Trinity College Dublin, 26 November 2020. See also Schnabel, I., “The ECB's policy response to the COVID-19 pandemic”, guest lecture at the University of Chicago Booth School of Business, 18 February 2021.
- For a discussion, see Panetta, F. and Schnabel, I., “The provision of euro liquidity through the ECB’s swap and repo operations”, The ECB Blog, 19 August 2020.
- See Eren, E. and Malamud, S., “Dominant currency debt”, BIS Working Paper, No 783, Bank for International Settlements, 2019.
- Some authors argue that central banks’ currency swap lines, by putting a ceiling on deviations from covered interest parity, incentivise cross-border gross capital flows and provide a decisive contribution to raise the international status of a currency. See Bahaj, S. and Reis, R., “Central bank swap lines,” CEPR Discussion Paper, No 13003, 2018.
- See Gopinath, G. and Stein, J., “Banking, trade, and the making of a dominant currency”, Quarterly Journal of Economics, Vol.136, No 2, May 2021, pp. 783-830.
- See Box 7 entitled “Currency swap lines and international currency status”, in The international role of the euro, ECB, Frankfurt am Main, 2019.
- See the Communication of 19 January 2021 from the Commission to the European Parliament, the Council, the European Central Bank, the European Economic and Social Committee and the Committee of the Regions on the European economic and financial system: fostering openness, strength and resilience (COM/2021/32 final).
- See the statement by Members of the Euro Summit, 25 March 2021.
- A currency swap between two central banks is a contractual agreement in which the borrowing central bank obtains foreign currency against its own currency, with the promise to reverse the transaction at a pre-specified date, adding the agreed interest cost to the borrowed currency. Repo lines are arrangements in which the lending central bank provides access to its currency to another central bank and accepts assets denominated in that same currency as collateral from the borrowing central bank.
- The swap lines with G-10 countries and the People’s Bank of China are excluded from this analysis because they serve a different purpose, namely to address global foreign currency funding shortages, in particular in US dollars, among G10 members and to provide a backstop liquidity facility to address a potential shortage of renminbi for euro area banks in the case of the People’s Bank of China.
- See Aizenman,J. Ito, H. and Pasricha G. “Central bank swap arrangements in the COVID-19 crisis”, NBER Working Paper, No 28585, March 2021.
- The sample for the event study comprises Bulgaria, Croatia, Denmark, Hungary and Romania. Data on the currency basis was not readily available for Albania, North Macedonia, the Republic of Serbia and San Marino. The estimates control for fixed effects, month effects and global financial stress as measured by the VIX index. The estimates are obtained on daily data over the period 2010-2020.
- This is an economically meaningful magnitude insofar as the median basis for the countries concerned was about 60 basis points in March 2020.
- Albrizio, S., Kataryniuk, I. and Molina, L., “ECB liquidity lines”, Working Paper, Banco de España forthcoming.
- See European Commission, “The European instrument for temporary Support to mitigate Unemployment Risks in an Emergency (SURE)”.
- €17 billion dual tranche split over two tenors with a 10-year and a 20-year maturity (see the technical press release of 20 October 2020).
- €14 billion dual tranche split over two tenors of 5-years and 30-years in early November 2020 (see the technical press release of 10 November 2020); €8.5 billion single tranche with a 15-year tenor in late November 2020 (see the technical press release of 24 November 2020); €14 billion dual tranche split over two tenors of 7-years and 30-years in January 2021 (see the technical press release of 27 January 2021).
- According to IMF CPIS statistics, euro area investors accounted for around 24% of derived (from creditor data) total foreign portfolio equity and investment fund shares liabilities of the United Kingdom at the end of 2019.
- See ECB, Report on the digital euro, October 2020.
- For an overview of these determinants, see Eichengreen, B., Mehl, A. and Chitu, L., How global currencies work, Princeton University Press, 2017; see IMF, “Digital money across borders: macro-financial implications”, IMF Policy Paper, No 2020/050, 2020 for an examination of their relevance in a digital world.
- For an overview of standard trade finance instruments and how the global financial crisis of 2007-08 was associated with stress in trade finance markets, see Schmidt-Eisenlohr, T., “Towards a theory of trade finance”, Journal of International Economics, Vol. 91, 2013, pp. 96-112.
- “From the payments revolution to the reinvention of money”, speech by Fabio Panetta, at the Deutsche Bundesbank conference on the “Future of Payments in Europe”, 27 November 2020.
- See Gopinath, G. and Stein, J., “Banking, trade and the making of a dominant currency”, Quarterly Journal of Economics, forthcoming.
- More specifically, given that a dominant share of global trade is invoiced in dollars, demand is strong for financial claims that pay off a guaranteed amount in US dollar terms. This is because, if most imports are priced in dollars – and importantly, if these prices in US dollars are sticky – market participants tend to prefer deposits denominated in US dollars, as they are effectively the safest claim in real terms from their perspective. In other words, while deposits in any currency may be free of default risk, in a world in which exchange rates are variable, only a US dollar deposit held today can be used to purchase a certain quantity of US dollar-invoiced goods tomorrow.
- In addition, there might also be potential positive spillover effects in business-to-business and wholesale market transactions.
- See Panetta, F. and Bindseil, U., “Digital central bank money for Europeans – getting ready for the future”, The ECB Blog, 25 March 2021.
- Achieving interoperability would reduce risks of currency substitution in third countries insofar as the digital euro could be used for cross-border payments but not necessarily for domestic transactions within another jurisdiction where currencies are unstable. See also “Cross-border payments and CBDC” in “Central bank digital currencies: foundational principles and core features”, BIS report, No 1, Bank for International Settlements, 2020.
- Such cross-currency payment would consist of a transaction where the user pays in CBDC, while the seller receives (and bills the user in) another unit.
- One example is Project Stella, a joint research project launched in December 2016 by the ECB and the Bank of Japan to explore the potential of distributed ledger technologies (DLT) for financial market infrastructures, which considered cross-border payments in its progress report of June 2019.
- One example is the Inthanon-Lionrock project launched by the Hong Kong Monetary Authority and the Bank of Thailand in 2018. This project explores a digital ledger technology solution for cross-border fund transfers. It relies on a cross-border corridor network, where transfers of funds can occur instantaneously on a peer-to-peer basis. The design allows foreign exchange price discovery on the corridor network that enables on-demand foreign exchange conversion; foreign exchange settlement takes place in an atomic payment-versus-payment manner. Regulatory monitoring and compliance are put in place where feasible (see the progress report on this project).
- For a related discussion, see the Report on the digital euro.
- As indicated in the Report on a digital euro, ceilings on the amounts or values for cross-border flows would be limited to digital euro and would therefore not prevent non-euro area citizens from using other forms of the currency. This is consistent with the fundamental freedom of movement of capital, which is embedded as a core principle of the euro area.
- See Bindseil, U. and Panetta, F., “Central bank digital currency remuneration in a world with low or negative nominal interest rates”, VoxEU, October 2020.
- For instance, if non-residents had an exceedingly strong preference for the safety of the CBDC, just as some investors have a strong preference for highly rated sovereign bonds despite negative yields.
- It should be noted that the two instruments are not mutually exclusive and may co-exist.
- See Eichenbaum, M., Johannsen, B. and Rebelo, S., “Monetary policy and the predictability of nominal exchange rates”, Review of Economic Studies, Vol. 88(1), 2020, pp. 192-228.
- This is another extension of the model. Profits are defined as the unconditional mean of the profits of firms computed using a second-order approximation of the model with pruning. The unconditional mean might differ from the deterministic steady state of the model owing to uncertainty.
- Gopinath, G. and Stein, J.C., “Banking, trade, and the making of a dominant currency”, The Quarterly Journal of Economics.
- For a discussion of frictions to cross-border payments, see, for example, Financial Stability Board, , 13 October 2020.
- The model includes five exogenous shocks to monetary policy, government spending, total factor productivity, consumer preferences (which acts as a risk premium shock) and a shock to the liquidation cost of debt securities.
- The simulations use the baseline assumptions discussed above (i.e. no capital controls, a 1% liquidation cost for debt securities, symmetric 33% weights for all countries and the same volatility of the exogenous shocks).
- See Boz, E., Casas, C., Georgiadis, G., Gopinath, G., Le Mezo, H., Mehl, A. and Nguyen, T., “Patterns in invoicing currency in global trade”, Working Paper Series, No 2456, ECB, Frankfurt am Main, 2020.
- The dataset is publicly available on the IMF’s website.
- These earlier datasets include Kamps, A., “The euro as invoicing currency in international trade”, Working Paper Series, No 665, ECB, Frankfurt am Main, 2006; and Goldberg, L. and Tille, C., “Vehicle-currency use in international trade”, Journal of International Economics, Vol. 76, 2008, pp. 177-192.
- See Ito, H. and Chinn, M., “The rise of the “redback” and the People’s Republic of China’s capital account liberalization: an empirical analysis of the determinants of invoicing currencies”, ADBI Working Paper, 473, 2014, p. 8, in which it is noted that, “in contrast to the relatively rich theoretical literature on the choice of currency for trade invoicing, the empirical literature is thin. The paucity of empirical literature is due to data availability”.
- See, for example, Gopinath, G., “The international price system”, NBER Working Paper, No 21646, 2015.
- The estimates assume that all intra-euro area transactions are invoiced in euro.
- In addition, the increasing concentration of invoicing in US dollars and euro over time is visible in the decrease in the share of trade invoiced in other currencies shown in the right panel of Chart 23.
- The shares of invoicing in euro prior to 1999 are calculated as the sum of the legacy currencies.
- See Gopinath, G. and Stein, J., “Banking, trade, and the making of a dominant currency”, Quarterly Journal of Economics, and Mukhin, D., “An equilibrium model of the international price system”, mimeo, 2018.
- See Mundell, R., “Capital mobility and stabilization policy under fixed and flexible exchange rates”, Canadian Journal of Economics and Political Science, Vol. 29, 1963, pp. 475-85.
- See Gopinath, G., “The international price system”, NBER Working Paper, No 21646, 2015. Local currency pricing is the other conventional assumption – exporters invoice in the currencies of destination markets, in other words, in the currency of the importer.
- See Gopinath, G., Boz, E., Casas, C., Diez, F., Gourinchas, P.O. and Plagborg-Moller, M., “Dominant currency paradigm”, American Economic Review, Vol. 110, 2020, pp. 677-719.
- See Georgiadis, G., Le Mezo, H., Mehl, A. and Tille, C., “Markets vs. policies: can the US dollar’s dominance in global trade be dented?”, Working Paper Series, ECB, Frankfurt am Main, forthcoming.
- Homogenous goods are identified using a standard classification that distinguishes between goods traded on organised exchanges, with reference prices or which are differentiated; see Rauch, J., “Networks versus markets in international trade”, Journal of International Economics, Vol. 48, 1999, pp. 7-35.
- Integration in cross-border input-output linkages is measured using a vertical specialisation index which captures the imported input content of exports. See Hummels, D., Ishii, J. and Yi, K., “The nature and growth of vertical specialization in world trade”, Journal of International Economics, Vol. 54, 2001, pp. 75-96.
- The estimates are obtained by interacting countries' global value chain integration with the share of their exports to the euro area.
-
2 June 2021