


Published as part of the Financial Stability Review, November 2022.
In the light of increasing evidence that banks’ exposures to climate risk are concentrated, European and international authorities are intensifying their focus on the management of carbon-related concentration risk. At the individual bank level, carbon-related concentration risk can be defined as the risk that a subset of a given bank’s exposures could suffer simultaneous, significant losses in value because of the materialisation of transition risk. This could threaten the bank’s financial position and its ability to maintain critical services or functions. The recently published ECB-ESRB report on climate risk highlights the prospect of systemic amplification due to concentrated exposures, and the results of the 2022 ECB Banking Supervision climate risk stress test indicate that the majority of banks’ credit income arises from high-emitting industries.[1] In parallel, the European Banking Authority (EBA) has sought public feedback on ways to address concentration risks stemming from environmental risk drivers.[2] At the international level, the Basel Committee on Banking Supervision (BCBS) has recently recommended that banks measure and manage concentrations associated with climate-related financial risks.[3]
This box focuses on transition risk and sets out how the measurement of concentration risk can be adapted to account for carbon-related risk in banks’ corporate loan portfolios. To help identify the most vulnerable banks, the box extends the Herfindahl-Hirschman Index (HHI), which has been widely used to measure industrial and portfolio concentration, using information on individual firms’ emissions to add a climate transition component.[4],[5] This carbon-weighted HHI (cwHHI) demonstrates how banks with similar shares of exposures to high-emitting firms[6] allocate their exposures very differently and can therefore be associated with different levels of carbon-related concentration risk (Chart A). As expected, the cwHHI and the share of exposures to high-emitting firms are positively correlated overall, but there is significant heterogeneity across banks, especially in the highest and lowest quintiles.
Chart A
The carbon-related concentration risk metric correlates positively with a bank’s share of exposures to high-emitting firms, but with significant heterogeneity across banks
Share of portfolio allocated to high-emitting firms vs carbon-weighted Herfindahl-Hirschman Index
(December 2020, x-axis: quintiles of banks according to their share of exposures to the top 25% highest emitting firms, y-axis: cwHHI, log-scale)
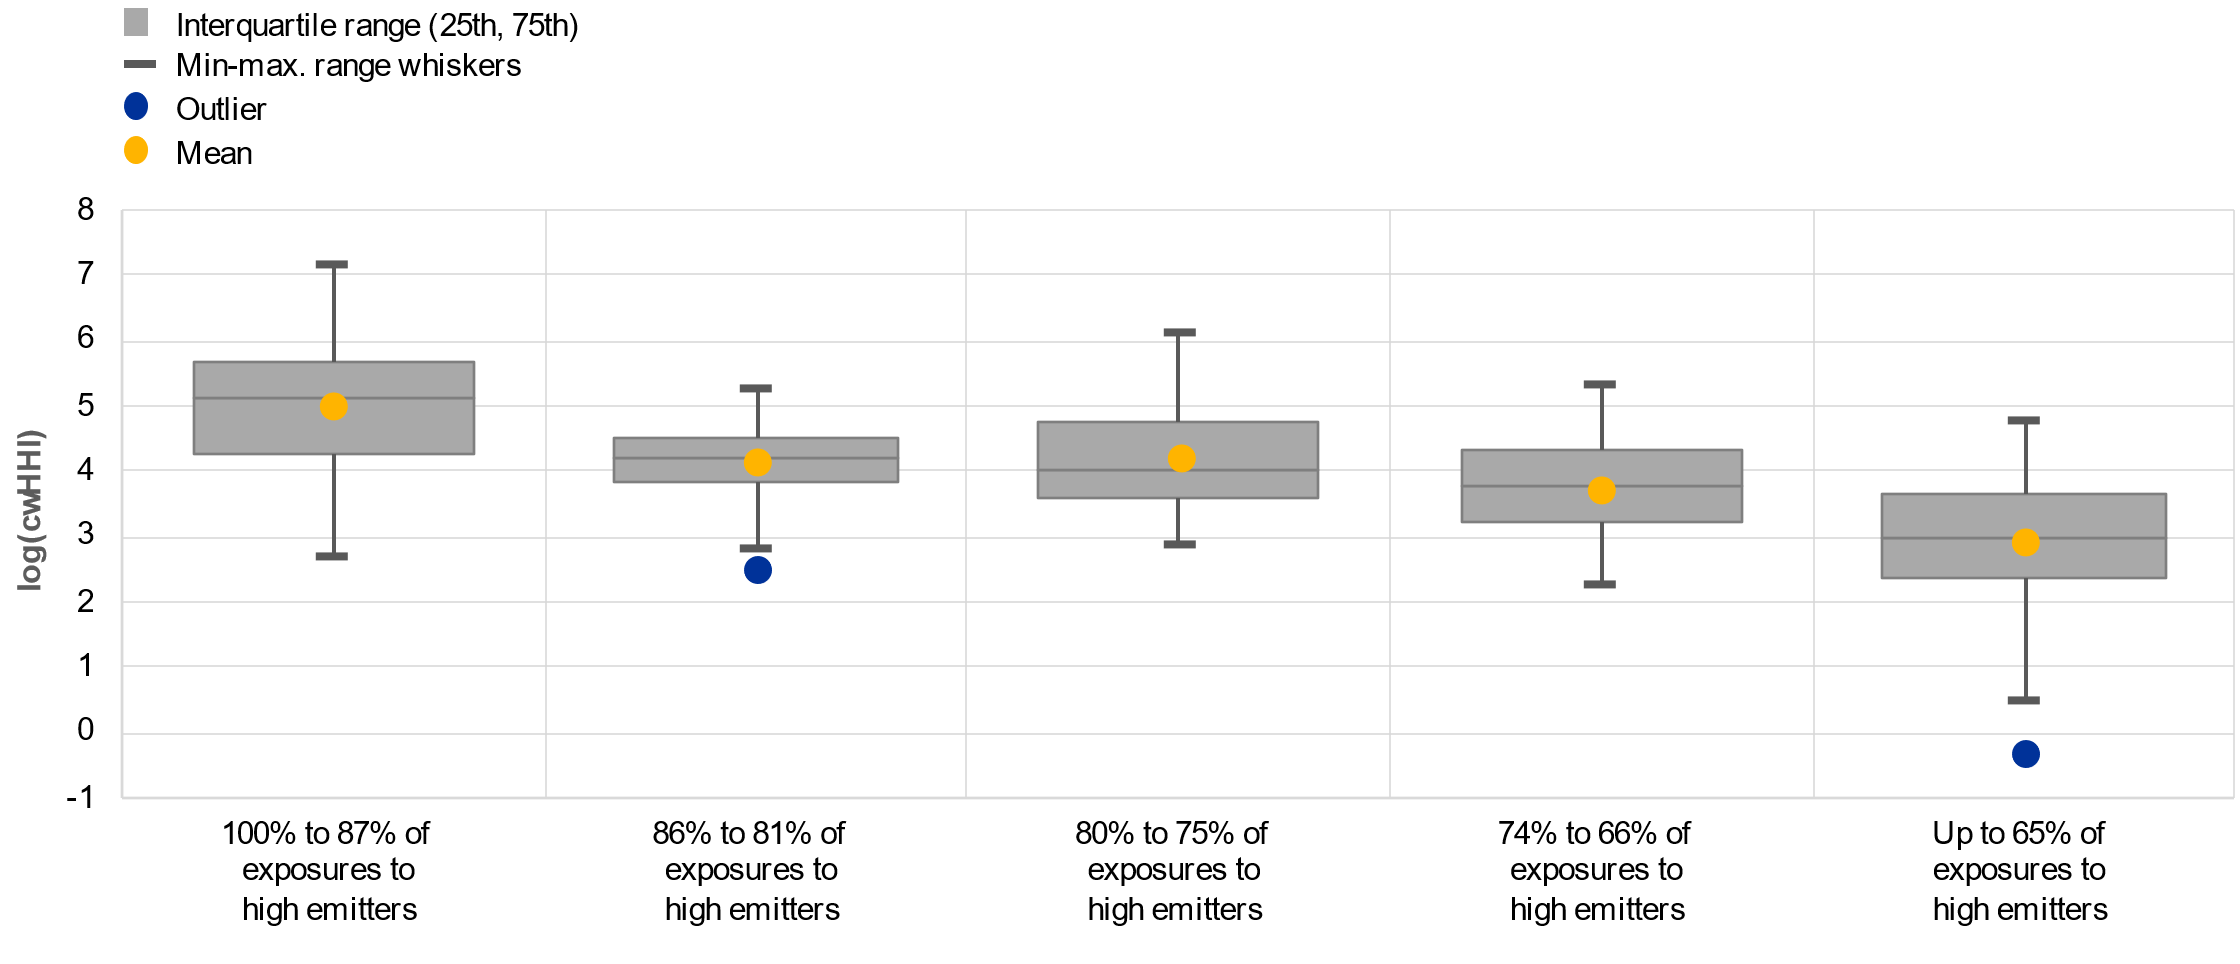
Sources: ECB calculations based on NGFS, AnaCredit, Orbis, iBACH, Register of Institutions and Affiliates Database and Urgentem data.
Notes: Sample of 102 significant institutions in the euro area, using the 2021 economy-wide climate stress test data. Firms are considered to be high emitters if their absolute emission levels in tons of carbon dioxide fall within the top 25th percentile of the distribution of absolute emissions for the entire sample of firms borrowing from euro area banks. Scope 1, 2 and 3 emissions are included. There is significant heterogeneity of exposures to high emitters at the lower tail of the distribution, hence the range of the lowest quintile is particularly wide. Higher values for the cwHHI correspond to higher levels of carbon-related concentration risk.
A comparison between banks which have similar share of exposures to high-emitting firms but differing cwHHI values reveals that a substantial share of expected losses in a disorderly transition scenario is related to the degree of portfolio concentration. Using the disorderly transition scenario from the ECB’s 2021 economy-wide climate stress test model,[7] Chart B illustrates how banks could – all other things being equal – experience higher shares of expected losses from carbon-related concentration risk. The underlying exercise consists of two steps. First, for each bank, the exercise computes the difference in expected losses before and after the corporate portfolio is diversified, by reducing the share of exposures allocated to the 25% highest emitting firms to 50% of their total exposures. This difference can be interpreted as a share of expected losses attributable to carbon-related concentration risk.[8] The second step is to divide banks into five groups depending on their share of exposures to high-emitting firms and, within each group, depending on their level of carbon-related concentration risk as measured by the cwHHI. The material differences in expected losses between banks with high and low cwHHI for banks similarly exposed to high-emitting firms (in aggregate terms) indicate that the cwHHI identifies those banks with higher losses stemming from carbon-related concentration risk. Finally, an assessment of the subset of all banks flagged as vulnerable by high cwHHI values highlights how a significant share of losses is attributable to carbon-related concentration risk under a disorderly transition scenario (Chart B). This illustrates how carbon-related concentration risk could potentially become a material risk driver.
Chart B
The carbon-related concentration risk metric makes it easier to identify the banks most exposed to transition risk from concentrated exposures
Average share of expected losses attributed to concentration risk by quintiles of share of portfolio allocated to top 25% highest emitting firms
(December 2020, x-axis: quintiles of banks according to their share of exposures to top 25% of highest emitting firms, y-axis: average percentage of expected losses attributed to carbon-related concentration risk)
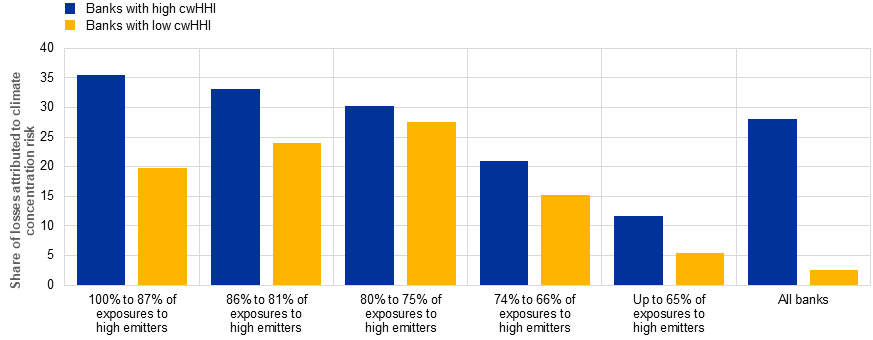
Sources: ECB calculations based on NGFS, AnaCredit, Orbis, iBACH, Register of Institutions and Affiliates Database and Urgentem data.
Notes: Sample of 102 significant institutions in the euro area, using the 2021 economy-wide climate stress test data. Each bar contains the same number of banks. Within each quintile, banks are sorted by their log-cwHHI in descending order and subsequently split equally between blue and yellow bars. A bank is classified to have a high (low) cwHHI if it scores above (below) the 50th percentile of cwHHI in the subset. The sample procedure is applied to the category “All banks”. This category contains all 102 significant institutions.
The findings in this box highlight the importance of considering concentration risk in the prudential response to climate change. It shows how institutions and exposures significantly affected by carbon-related concentration risk run a higher risk of incurring losses, extending even to those which have a lower share of exposures to high emitters. Focusing on transition risk, simulation analysis further illustrates that carbon-related concentration risk may be a material risk driver, highlighting its relevance for policymakers, supervisors, and banks alike when considering their response to climate-related risks.
See “The Macroprudential Challenge of Climate Change”, the ECB/ESRB Project Team on climate risk monitoring, July 2022; and “2022 climate risk stress test”, ECB Banking Supervision, July 2022.
See “The role of environmental risk in the prudential framework”, Discussion Paper, EBA, May 2022.
See “Principles for the effective management and supervision of climate-related financial risks”, BCBS, Bank for International Settlements, June 2022.
The carbon-weighted Herfindahl-Hirschman Index is calculated as follows (where i stands for firm i):
Other metrics, such as the emissions-based Gini coefficient, may provide additional insights and could be considered alongside HHI-based metrics. For a carbon-related application of the Gini coefficient, see, for example, Zhou, B., Thies, S., Gudipudi, R., Lüdeke, M.K., Kropp, J.P. and Rybski, D., “A Gini approach to spatial CO2 emissions”, PLOS ONE, November 2020.
Firms are considered to be high emitters if their absolute emission levels in tons of carbon dioxide fall within the top 25th percentile of the distribution of absolute emissions for the entire sample of firms borrowing from euro area banks. Roughly 29% of high emitters operate in the manufacturing sector, 26% in retail and wholesale trade and 11% in construction.
See Alogoskoufis, S. et al., “ECB economy-wide climate stress test”, Occasional Paper Series, No 281, ECB, September 2021. The year 2035 is selected to impose the highest transition risk on firms (as it is assumed carbon prices will peak in 2035), thus making it possible to provide a conservative estimate of the potential impact of concentration risk on banks’ expected losses.
Results are qualitatively similar for different thresholds ranging from 10% to 75% of total exposures. Starting from current exposures, banks diversify their portfolios by reallocating loans to high emitters that exceed the threshold to non-high emitting borrowers pro rata.