

- SPEECH
The confidence to act: monetary policy and the role of wages during the disinflation process
Speech by Piero Cipollone, Member of the Executive Board of the ECB, at an event organised by the House of the Euro and the Centre for European Reform
Brussels, 27 March 2024
It is a pleasure to be here today.
In recent years, the euro area economy has experienced a series of overlapping demand and supply shocks, which resulted in persistently high inflation.
Due to its dependence on imports hit by those shocks, the euro area also suffered a negative terms-of-trade shock. This acted as an external tax on euro area income that, in practice, was initially absorbed mostly by workers in the form of lower real wages.
The reversal of these negative supply shocks, combined with our restrictive monetary policy, has led to a broad-based decline in inflation, while inflation expectations remain well anchored. This, in turn, has shifted the discussion towards the timing, pace and extent of the reduction in monetary policy restriction going forward.
Our decisions continue to be informed by the inflation outlook and the risks surrounding it.[1] One important aspect relates to the risk that wage and productivity growth might be inconsistent with the convergence of inflation to our medium-term target of 2%.
Certainly, in a steady-state scenario, keeping wage rises in line with productivity growth and the inflation target is necessary. It prevents unsustainable cost pressures, which firms would have to pass on to customers, resulting in above-target inflation.
But we are not in a steady-state scenario yet. Real wages are still below their pre-pandemic level – even more so than productivity – while unit profit growth has until recently been high relative to the historical average. Today, the share of labour in value added remains lower than before the COVID-19 shock, despite the level of employment increasing by 3.8% in the same period.[2]
Profits are now normalising, while the ongoing reversal of negative supply shocks creates additional room for a catch-up in real wages that will contribute to the economic recovery consistent with our staff projections and with a convergence to our inflation target.
Indeed, in the projections, this catch-up is a condition for the increase in private consumption. But even at the end of the projection horizon, real wages are still expected to be slightly below the level that would be justified by labour productivity growth since the pandemic.
Just as real wage growth cannot be sustained over time if it continuously overshoots productivity growth, output and productivity growth are unlikely to be sustained over time if wages and domestic demand remain permanently depressed. This may lead to a protracted underutilisation of resources, with potential output eventually adjusting downwards to meet depressed demand.
Let me be clear: wage growth needs to moderate over the medium term for a sustained convergence of inflation to our target. But an excessive focus on short-term wage developments may not take into full consideration the recovery in wages that can – and needs to – take place for the euro area’s currently fragile recovery to gain a stronger footing. If the economy does not recover, this would mechanically put downward pressure on productivity growth or on employment.
Today, the process of disinflation is surrounded by less uncertainty as supply shocks reverse and risks to the inflation outlook have balanced out. We are increasingly confident that inflation will converge to 2% by mid-2025.
Waiting for further data before starting the normalisation of our policy rates, gives us additional insurance against upside risks to inflation. But we should remain proportionate going forward given an economy that has stagnated for 18 months, risks to the economic outlook that are skewed to the downside, and credit conditions that are in restrictive territory.
If incoming data confirm the scenario foreseen in the March projections, we should stand ready to swiftly dial back our restrictive monetary policy stance. Increased confidence in a timely return of inflation to our target should then allow forward-looking information to regain prominence in our reaction function.
The rise and fall of inflation in the euro area
The inflation surge
Headline inflation in the euro area increased to record levels following a string of unprecedented and intersecting demand and supply shocks, with the latter playing the primary role (Chart 1).[3]
Chart 1
Dynamic decomposition of euro area headline inflation using the Bernanke-Blanchard model
(year-on-year growth rate and percentage point contributions)

Source: ECB calculation is based on Arce, O., Ciccarelli, M., Kornprobst, A. and Montes-Galdon, C. (2024), “What caused the euro area post-pandemic inflation?”, Occasional Paper Series, No 343, ECB.
Notes: The figure shows a decomposition of the sources of annual HICP inflation between the first quarter of 2020 and the fourth quarter of 2023, based on the solution of the full model and the implied impulse response functions. The continuous line shows actual inflation, and the total net heights of the bars are the model’s forecast of inflation in each period, given initial conditions up to the fourth quarter of 2019. The contributions of the residuals are computed as the difference between actual and simulated data. The dark blue portion of each bar shows the contribution of pre-2020 data. The coloured segments of each bar show the general equilibrium, fully dynamic contribution of each exogenous variable to inflation in that period, as implied by the estimated model. Shocks to the rate of change of the relative price of energy and food are constructed as deviations in the values of those variables from zero. Shocks to the shortage variable are constructed as deviations in the values from the sample mean. Shocks to the vacancy-to-unemployment ratio variable are constructed as the actual value minus the value in the fourth quarter of 2019.
In particular, energy inflation, already at elevated levels, soared to above 40% year on year in the wake of Russia’s invasion of Ukraine. Headline inflation became increasingly broad-based as high energy costs spread throughout the economy, driving food and services prices higher – albeit with lagged effects (Chart 2).
Chart 2
Contribution of components to euro area headline inflation
(annual percentage changes and percentage point contributions)
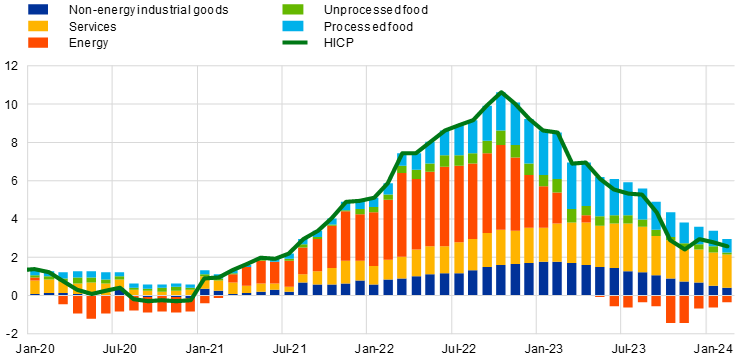
Sources: Eurostat and ECB staff calculations.
Note: The latest observations are for February 2024.
Given Europe’s reliance on energy imports, soaring energy prices also constituted a negative terms-of-trade shock for the euro area (Chart 3)[4], which acted as an external tax on income that had to be collectively absorbed by labour and capital. In practice, however, it was real wages that initially absorbed most of this tax. They declined markedly in 2022[5] and remained below their pre-pandemic level at the end of last year (Chart 4).
Chart 3
Euro area terms of trade and energy import prices
(left-hand scale: terms-of-trade ratio, right-hand scale: energy import prices)
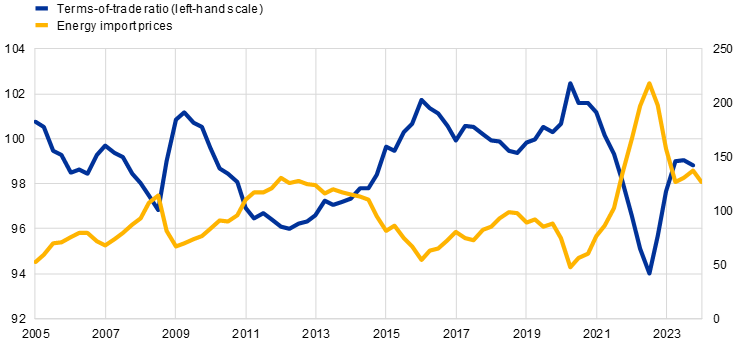
Source: Eurostat.
Notes: The terms of trade are expressed as a ratio between export and import deflators. The base year for energy import prices is 2015. The latest observations are for the fourth quarter of 2023.
Chart 4
Real compensation per employee in the euro area
(index: Q4 2019 = 100)
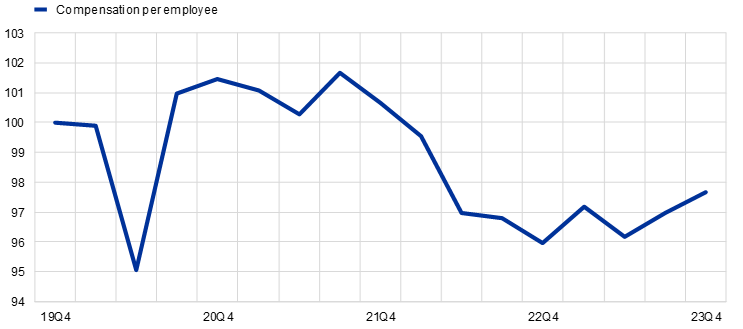
Sources: Eurostat and ECB staff calculations.
Notes: Real compensation per employee is constructed by dividing nominal compensation per employee by HICP. The latest observations are for the fourth quarter of 2023.
Supported by a tight labour market in the euro area, workers have sought higher nominal wage growth, initially to reduce real income losses and subsequently to recoup them.[6] But wage growth remained slightly below inflation in 2023 and is only expected to exceed it in 2024.[7]
By contrast, in an environment of high and volatile inflation, firms were better able to increase selling prices and secure high unit profit growth. Evidence suggests that the frequency with which firms revised prices upwards increased considerably during the high-inflation period in comparison with the pre-pandemic era.[8]
As a result, in 2022 alone unit profits accounted for roughly two-thirds of domestic inflation in the euro area (as measured by the GDP deflator), well above the historical average of around one-third.[9] Accordingly, there has been a reduction in the share of wages in value added, in spite of higher employment, and an increase in the share of profits compared with the years before the pandemic (see Chart 5).
Chart 5
Wage share in the euro area
(percentages; adjusted for share of self-employed)
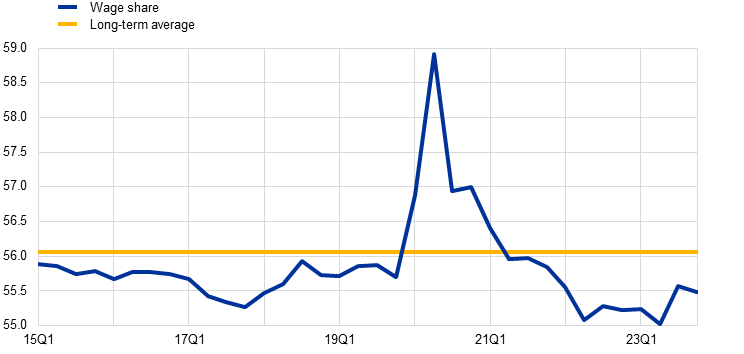
Sources: Eurostat and ECB staff calculations.
Notes: Long-term average is calculated from 1999 to 2023. The latest observations are for the fourth quarter of 2023.
In response to high inflation, the ECB adjusted its monetary policy. We undertook ten consecutive policy rate increases, amounting to a cumulative 450 basis points – the sharpest adjustment in our history.[10]
In parallel, we further advanced the normalisation of the Eurosystem balance sheet, which had already been underway since December 2021. The normalisation has been playing out at a faster pace than in other parts of the world (Chart 6).[11]
Chart 6
Central bank total assets
(indexed at 100 at the start of respective policy rate hiking cycles)

Source: Bloomberg.
Notes: Series based on a 22-day moving average to smooth monthly data. The latest observation is for 14 March 2024.
Sources: Bloomberg, ECB calculations.
Notes: Index is set at 100 for the date of the first increase in policy rate by the central banks shown in the figure; the x-axis starts on 21 July 2022, 16 March 2022 and 15 December 2021 for the Eurosystem, Federal Reserve System and Bank of England, respectively. For Bank of England, reserve balances are used as a proxy for total balance sheet. The latest observation is for 22 March 2024.
The disinflation process
Over the course of the past year, two developments have helped to pave the way for a sharp decline in inflation and to keep medium-term inflation expectations anchored around our target.[12]
First, supply shocks are unwinding.
Energy inflation, formerly the main driver of rising prices, has been negative in the past ten months.[13] Together with the ongoing easing of pipeline pressures and the relaxation of supply bottlenecks, this has supported disinflation in the other HICP components. In particular, food inflation and goods inflation have tumbled by around three-quarters from their respective peaks.
Services inflation has so far eased less than other components, falling 1.6 percentage points from its peak to 4.0% and remaining well above its historical average. This slower disinflation in the services sector reflects the lagging nature of services inflation, mirroring what we saw when inflation was on the rise, and is consistent with past experience.[14]
At the same time, most underlying inflation measures have fallen in the past year, ranging between 2.1% and 4.5% in February, with forward-looking indicators[15] being at the low end and domestic inflation at the high end (Chart 7).[16]
Chart 7
Indicators of underlying inflation in the euro area
(annual percentage changes; PCCI, PCCI excluding energy: three-month moving average of annualised month-on-month growth rates; Supercore: three-month moving average of annual growth rate)
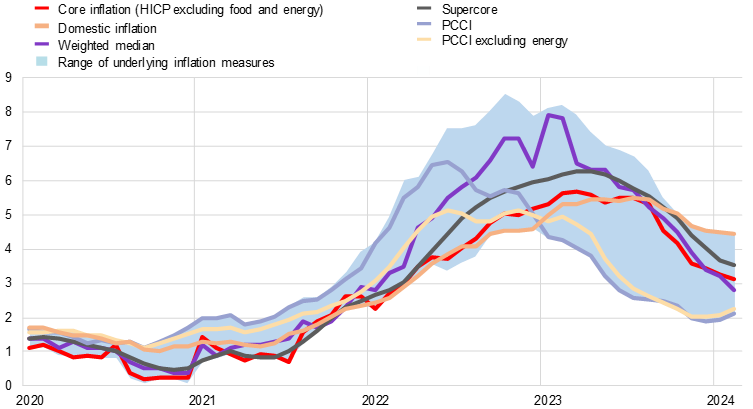
Sources: Eurostat and ECB staff calculations.
Notes: The latest observations are for February 2024. The range of underlying inflation measures includes those shown on the chart, as well as HICP excluding unprocessed food and energy, HICPXX, HICP excluding energy, trimmed mean (10%), and trimmed mean (30%).
The second development strongly contributing to the disinflation process has been the ECB’s restrictive monetary policy stance.
There is clear evidence that monetary policy restriction is being strongly transmitted to lending conditions in the euro area economy. Since the start of the tightening cycle, bank lending rates to firms and to households for house purchases have gone up by about 370 basis points and 210 basis points respectively. Moreover, annual loan growth over the same period has declined from 6% to 0.2% for firms and from 4.7% to 0.3% for households. The stagnant loan flows have been the result of both demand and supply forces, as indicated by the substantial cumulative tightening since 2022 in the ECB bank lending survey (BLS). The demand for loans by firms and households declined, driven by higher interest rates and lower investment (Chart 8). And bank credit standards tightened, as a result of higher perceived risks and lower risk tolerance (Chart 9).[17]
Chart 8
Changes in demand for loans or credit lines to enterprises, and contributing factors (euro area)
(net percentages of banks reporting an increase in demand, and contributing factors)
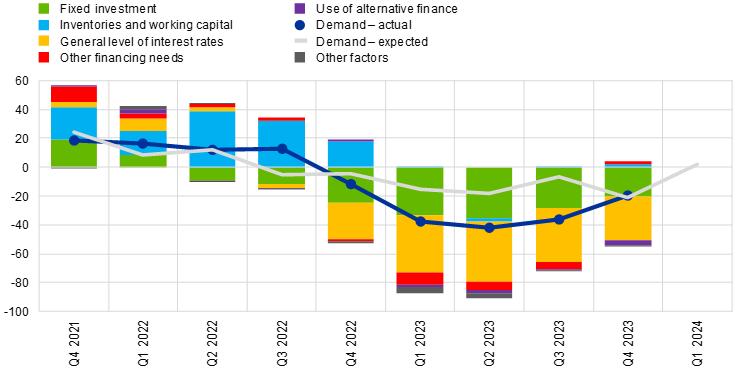
Sources: ECB (BLS) and ECB calculations.
Notes: “Actual” values are changes that have occurred, while “expected” values are changes anticipated by banks. Net percentages for the questions on demand for loans are defined as the difference between the sum of the percentages of banks responding “increased considerably” and “increased somewhat” and the sum of the percentages of banks responding “decreased somewhat” and “decreased considerably”. The net percentages for responses to questions relating to contributing factors are defined as the difference between the percentage of banks reporting that the given factor contributed to increasing demand and the percentage reporting that it contributed to decreasing demand. “Other financing needs” is the unweighted average of “mergers/acquisitions and corporate restructuring” and “debt refinancing/restructuring and renegotiation”; “use of alternative finance” is the unweighted average of “internal financing”, “loans from other banks”, “loans from non-banks”, “issuance/redemption of debt securities” and “issuance/redemption of equity”. The net percentages for the “other factors” refer to an average of the further factors which were mentioned by banks as having contributed to changes in loan demand. The latest observations are for the fourth quarter of 2023.
Chart 9
Changes in credit standards applied to the approval of loans or credit lines to enterprises, and contributing factors (euro area)
(net percentages of banks reporting a tightening of credit standards and contributing factors)

Sources: ECB (BLS) and ECB calculations.
Notes: “Actual” values are changes that have occurred, while “expected” values are changes anticipated by banks. Net percentages are defined as the difference between the sum of the percentages of banks responding “tightened considerably” and “tightened somewhat” and the sum of the percentages of banks responding “eased somewhat” and “eased considerably”. The net percentages for responses to questions related to contributing factors are defined as the difference between the percentage of banks reporting that the given factor contributed to a tightening and the percentage reporting that it contributed to an easing. “Cost of funds and balance sheet constraints” is the unweighted average of “banks’ capital and the costs related to banks’ capital position”, “access to market financing” and “liquidity position”; “risk perceptions” is the unweighted average of “general economic situation and outlook”, “industry or firm-specific situation and outlook/borrower’s creditworthiness” and “risk related to the collateral demanded”; “competition” is the unweighted average of “competition from other banks”, “competition from non-banks” and “competition from market financing”. The net percentages for “other factors” refer to an average of the further factors which were mentioned by banks as having contributed to changes in credit standards. The latest observations are for the fourth quarter of 2023.
The restrictive stance of our monetary policy has contributed to the stagnation of euro area real GDP in the last six quarters. Given that monetary policy operates with a lag, it will continue to exert a negative impact on economic activity, with growth projected to remain anaemic in the first quarter of 2024.
In particular, private consumption in the euro area has been subdued. Euro area retail sales were broadly unchanged at the start of the year, pointing to continued weak dynamics in spending on goods, and consumer confidence remains below its long-term average (Chart 10).
Chart 10
Retail sales, consumer confidence and business expectations in the euro area
Retail sales and sales by type of good in specialised stores | Consumer confidence and business expectations |
|---|---|
(indices: Q4 2021 = 100) | (panel a): standardised percentage balances, panel b: percentage balances) |
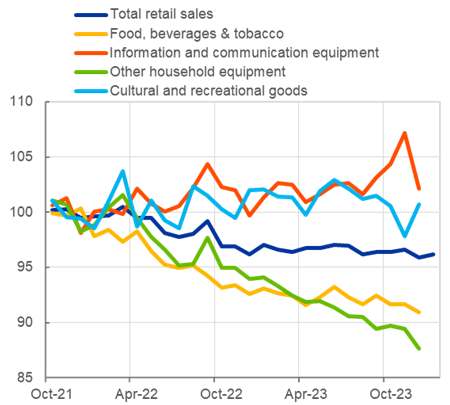 | 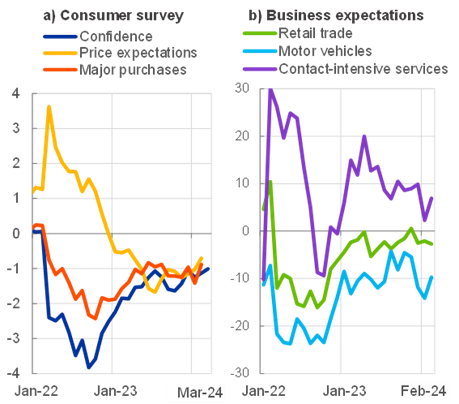 |
Sources: Left-hand panel: Eurostat and ECB calculations; right-hand panel: European Commission and ECB calculations.
Notes: Right-hand panel: panel a): standardised over pre-COVID period (standardised over April 2019-January 2024), expectations over next 12 months; panel b): demand for services and retail trade business situation over the next three months, motor vehicles refer to sale and repair, contact-intensive services are an aggregation of food, accommodation and travel services based on HICP weights. The latest observations in the left-hand panel are for December 2023 and January 2024 for total retail sales, and in the right-hand panel, for March 2024 (flash).
Weak domestic demand and the unwinding of supply shocks are reflected in the current account balance, which returned to surplus last year. This surplus is projected to increase further to 3.2% of GDP in 2024 and stay at that level subsequently. This points to domestic savings continuing to significantly exceed subdued demand for investment over the entire projection horizon.
Moreover, the euro area fiscal stance[18] is projected to further tighten in 2024 and in the following years, notably on account of the new fiscal rules and the continued withdrawal of support measures adopted in response to the energy shock. Overall, fiscal policy has been more restrained in the euro area than in other major economies (Chart 11).
Chart 11
General government net lending/borrowing
(percentages of GDP)
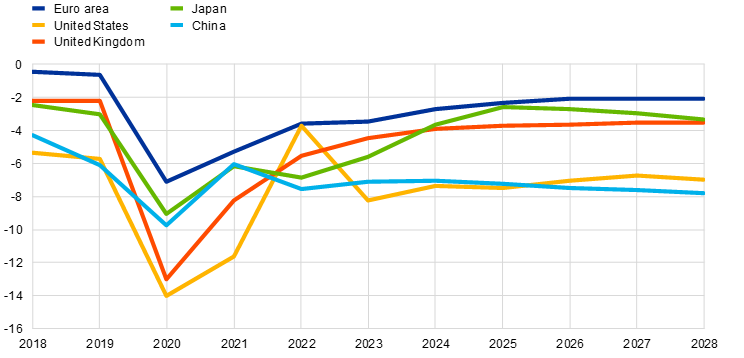
Source: IMF (2023), World Economic Outlook, October.
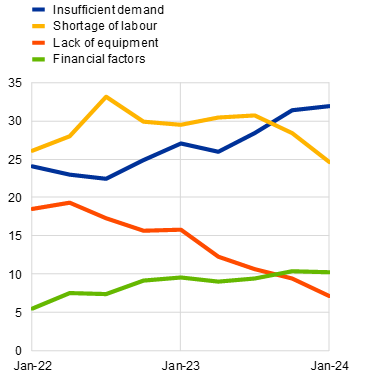
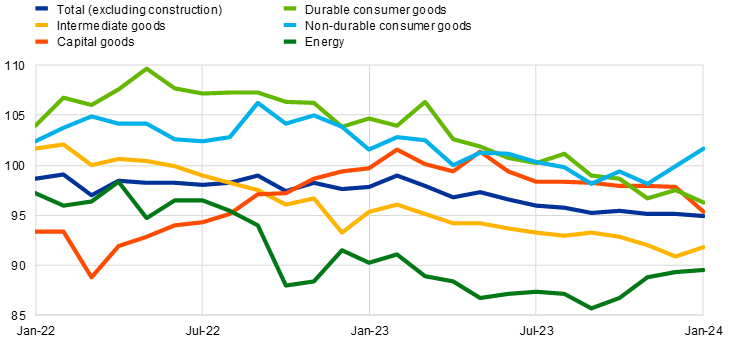
Lacklustre demand has repercussions on economic activity. The latest European Commission business survey cites insufficient demand as the most common factor limiting production. In fact, this constraint has been on the rise, just as other factors – including labour shortages – have been receding (Chart 12). Industrial production was flat in the fourth quarter of 2023, decreased strongly in January and remains well below its pre-pandemic level (Chart 13).
Chart 12
Euro area PMI indicators and factors limiting production
a) Composite PMI | b) Limits to production |
|---|---|
(diffusion indices, standardised) | (percentages) |
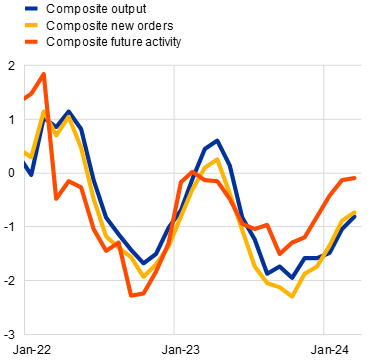 |  |
Sources: S&P Global Market Intelligence, European Commission and ECB calculations.
Note: Panel b) is based on aggregated sectoral survey data using GVA weights. PMI stands for Purchasing Managers’ index.
Latest observations: panel a): February 2024, panel b): March 2024 (flash).
Chart 13
Euro area industrial production (excluding Ireland)
(indices: 2019 = 100)
Sources: Eurostat and ECB calculations.
Note: The latest observations are for January 2024.
Coupled with restrictive financing conditions, weaker than expected economic activity was reflected in the downward revision of euro area growth for 2024 to 0.6% in the latest ECB staff projections. But as inflation continues to decline and households’ real disposable income increases, we expect a recovery to ensue, with the economy growing at 1.5% in 2025 and 1.6% in 2026.
Should we be worried about wage growth?
As supply shocks continue to unwind, labour costs have become a prominent driver of domestic inflation pressures, leading to concern that they could delay the convergence of inflation to our target.
This concern stems from the observation that nominal wage growth has recently exceeded the sum of target inflation and productivity growth. Alongside the catch-up process in nominal wage growth, this has reflected a cyclical decline in productivity owing to lacklustre economic growth, compounded by firms’ hoarding of labour. As a result, unit labour costs have been growing significantly above a level that in normal times we would consider consistent with our inflation target (Chart 14).
Chart 14
Decomposition of unit labour costs
(annual percentage changes)
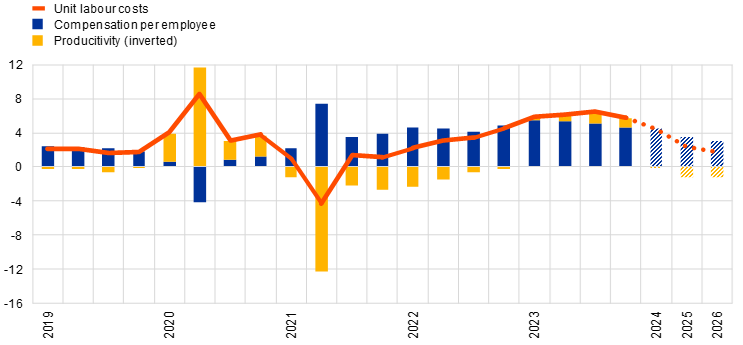
Sources: Eurostat, March 2024 MPE and ECB staff calculations.
Notes: The macroeconomic projections for the euro area were finalised on 21 February 2024. The latest observations are for the fourth quarter of 2023.
The worry is that this could keep inflation high if these costs are passed on to consumers – in particular in wage-intensive sectors such as services, which account for the largest part of the euro area economy.[19] This could ultimately lead to inflation that is persistently above target.
ECB staff analysis suggests that a 1 percentage point increase in wages pushes up core inflation by around 0.5 percentage points.[20] This pass-through, however, is subject to substantial uncertainty and takes time to fully materialise.[21] It depends on the nature of the shock, the stage in the business cycle and the sector in question, calling for a cautious approach to interpretating the impact of current wage dynamics on inflation.
While concerns about unit labour costs need to be taken seriously, there are grounds to argue that the current economic environment allows for a recovery in real wages in the short term that will not fuel inflation, provided real wage increases gradually come into line with productivity growth. I would like to highlight three factors in particular.
First, cumulative real wage developments have been even weaker than productivity growth since the onset of the pandemic (Chart 15). As at the end of 2023 real wages were still below their level at the end of 2019, while productivity was roughly the same. This creates some room for a non-inflationary recovery in real wages.
Chart 15
Real wages and productivity in the euro area
(indices: Q4 2019 = 100)

Sources: Eurostat, March 2024 MPE and ECB staff calculations.
Notes: Real compensation per employee is constructed by dividing nominal compensation per employee by HICP. The macroeconomic projections for the euro area were finalised on 21 February 2024. The latest observations are for the fourth quarter of 2023.
Second, the reversal of supply shocks provides room for a non-inflationary increase in real wages. In particular, the substantial decline in energy prices and intermediate input costs creates a buffer for firms to absorb wage pressures such that they are not passed on to consumer prices.
Third, there is room for a rebalancing of the shares of wages and profits in value added. In an environment of high and volatile inflation – in which price signals become blurred and consumers cannot easily separate price hikes that are due to cost increases from those that reflect market power and opportunistic strategies – firms were able to increase selling prices, securing higher profit margins at a time when the euro area’s terms of trade deteriorated. This created room to now buffer higher wage growth with profit margins. Indeed, firms expect labour costs to rise more than selling prices (Chart 16). This is consistent with an environment of dampened demand, in which firms expect to be unable to continue raising prices without losing market share.
Chart 16
Survey with leading non-financial companies: realised and expected changes in prices and costs in 2023 and 2024
(annual percentage changes)
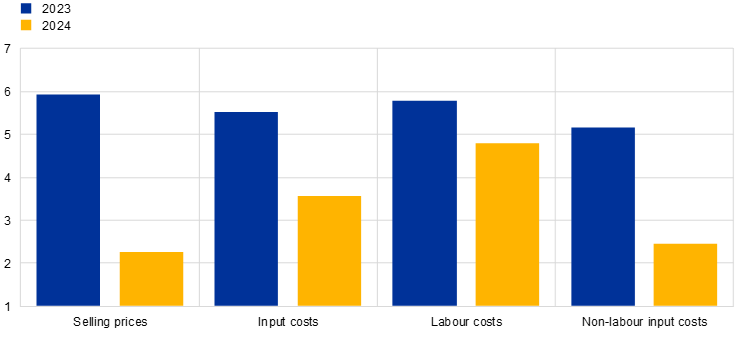
Source: ECB.
Notes: The chart is based on an ad hoc survey in the context of the ECB’s regular dialogue with leading non-financial companies. 66 survey responses were received, of which a subset of 24 firms opted to indicate the (expected) growth of their selling prices, input costs, labour costs and non-labour input costs in 2023 and 2024 shown in this chart.
For these reasons, the ECB staff projections foresee that a catch-up of wages in real terms, especially in 2024, is compatible with reaching our target in a timely fashion. Thereafter, the projections expect real wages to continue to moderate, before reaching a level consistent with projected productivity growth and our inflation target in 2026.
In fact, there are signs that nominal wage dynamics in the euro area already peaked in the middle of last year (Chart 17). And in the fourth quarter of 2023, annual growth in compensation per employee declined to 4.6% from 5.1% in the previous quarter. Quarter-on-quarter growth also notably declined, to 0.9% from 1.4% in the previous quarter.
Chart 17
Nominal wage indicators for the euro area and United States
(annual percentage changes)

Sources: Eurostat, ECB and BLS.
Note: The latest observations are for the fourth quarter of 2023.
While we must continue to carefully monitor the risks associated with wage growth that would exceed the projections, we also need to consider the symmetric risk associated with weaker than expected growth in wages. The failure of real wages to recover over the short term may have unintended effects.
First, it may slow the cyclical recovery and hence productivity growth, putting upward pressure on unit labour costs. The decline in real wages in the last two years, combined with higher financing costs, has reduced the price of labour relative to capital and other inputs such as energy. This disincentivises investment in capital-intensive sectors, such as industry, which tend to have a higher level of productivity. And it incentivises the continued hoarding of labour, further weighing on labour productivity.[22]
Second, lower real wages have been accompanied by markedly lower consumer spending on goods vis-à-vis other categories (Charts 18 and 19) as budget-constrained households delay goods consumption.[23] This further reinforces a sectoral shift towards sectors with lower levels of productivity and fuels consumption of items such as services, which have experienced less disinflation.
Chart 18
Real personal consumption expenditures
(indices: 2019 = 100)

Sources: Eurostat and ECB staff calculations.
Note: The latest observations are for the fourth quarter of 2023.
Chart 19
Impact of energy supply shocks on real consumer spending in the euro area
(percentage changes and percentage point contributions)
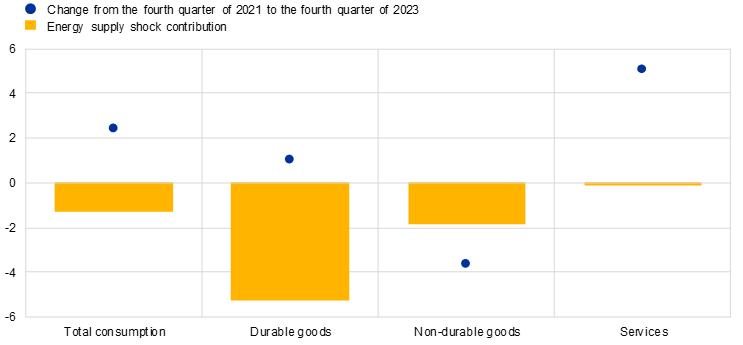
Sources: Eurostat and ECB staff calculations.
Notes: The results are based on four individual structural vector autoregression (SVAR) models identified with sign restrictions. Non-durable goods include semi-durable goods. For further details, see the box entitled “The impact of higher energy prices on services and goods consumption in the euro area”, Economic Bulletin, Issue 8, ECB, 2022.
Third, by straining households’ balance sheets, lower than projected real wages would make financing conditions tighter than intended – increasing the risk of non-linear implications for the economy.
Households have been facing increasing borrowing constraints since the start of the tightening cycle. In particular, evidence suggests that low-income households – which have a higher propensity to consume – are experiencing more difficulties in meeting their mortgage payments and accessing credit compared with high-income households (Chart 20). The lowest-income quintiles of households are also those with the smallest accumulated excess savings to fall back on during periods of financial strain (Chart 21).
Chart 20
Credit access and expected difficulty to meet mortgage payments
(left-hand panel: net percentages of respondents, harder minus easier; right-hand panel: percentages of respondents with a mortgage)
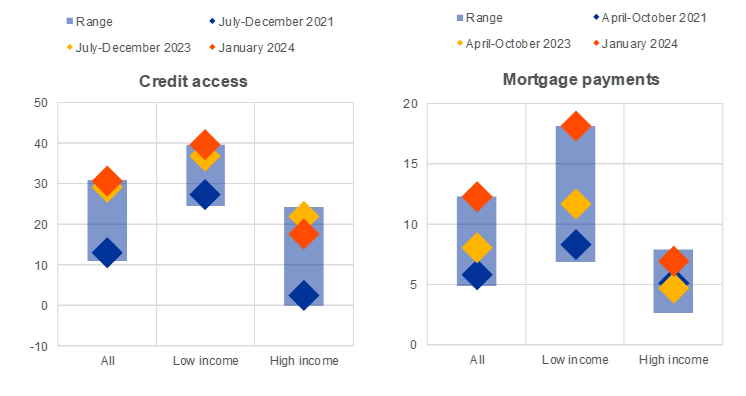
Sources: ECB (CES) and ECB calculations.
Notes: Low-income households are those in the bottom 20% of the income distribution, while high-income households are those in the top 20% of the income distribution. Diamonds represent averages over the period. Ranges are computed over the full history of the survey. The left-hand side plots the differences between the percentage of respondents who reported that credit access has become harder in the last 12 months and those who reported that it has become easier. The right-hand side shows the percentage of respondents with mortgages who said they would face difficulty meeting their mortgage payment over the next three months. The latest observations are for January 2024.
Chart 21
Euro area household excess savings by use in the third quarter of 2023
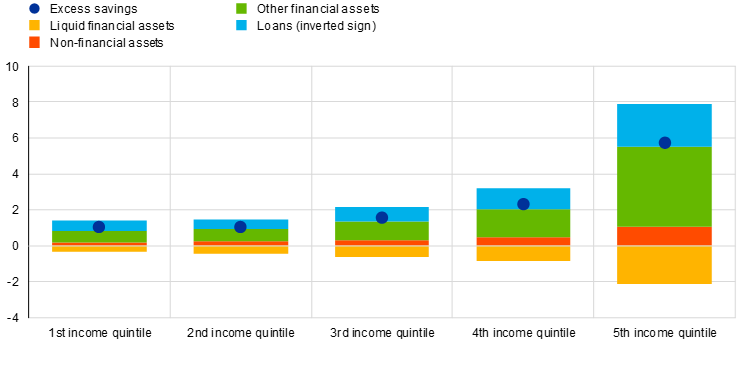
Sources: Eurostat, ECB and ECB staff calculations.
Notes: Each entry represents the cumulated value exceeding its trend estimated between 2015 and 2019. Liquid financial assets refer to cash and deposits. Non-financial assets refer to gross capital formation, which mainly comprises housing investment. Other financial assets mainly refer to equities and bonds and are measured as the residual between savings and the sum of liquid financial assets, non-financial assets and loans. Loans are shown with an inverted sign, since below-trend loan flows imply the use of excess savings to borrow less or repay loans.
Looking beyond the short term, if real wages do not recover, this would increase the risk of protracted economic weakness, which could cause scarring effects, as investment and supply capacity adjust to persistently low demand. This would reduce potential output, over time bringing down the level at which demand becomes inflationary. And it would further dent productivity in the euro area relative to other parts of the world.
Monetary policy and the disinflation process
In the current environment, calibrating monetary policy requires a careful balancing act between ensuring that inflation converges to our target in a timely manner – especially given the prolonged period of high inflation – and remaining proportionate in terms of insuring ourselves against upside risks to inflation, given the associated economic costs.
Our interest rate decisions should remain based on our reaction function, which is determined by the assessment of the inflation outlook in the light of the incoming economic and financial data, the dynamics of underlying inflation and the strength of monetary policy transmission. At the same time, the relative weights of these components may evolve[24] to reflect a more forward-looking orientation as our confidence in the timely convergence of inflation to our target grows.
Accordingly, paying attention to wages should not result in giving undue prominence to a factor that, while permeating all measures of observed and underlying inflation, is not the only determinant of cost pressures. The cost of intermediate inputs and profit margins, for instance, also matter.
The current environment of disinflation means that the outlook is surrounded by less uncertainty as supply shocks unwind. We are becoming more confident in the projections. Indeed, the accuracy of staff projections for inflation has significantly improved in the past year[25], and the risks to the inflation outlook have balanced out.
Our staff projections in March pointed to the convergence of headline and core inflation to our target. We now expect inflation to average 2.3% in 2024, 2.0% in 2025 and 1.9% in 2026. The projections for inflation excluding energy and food have also been revised downwards and average 2.6% for 2024, 2.1% for 2025 and 2.0% for 2026.
At our Governing Council meeting earlier this month, we decided to wait for further data – notably in relation to wages and profits – before starting the normalisation of our policy rates in order to have further assurance that inflation is converging to our target.
Since that meeting, data have shown that the growth in compensation per employee moderated in the fourth quarter of 2023, in fact more than we had projected. And to date, evidence from the forward-looking wage tracker for 2024 does not suggest significant upside risks to the projections (Chart 22).
Chart 22
Forward-looking wage tracker
(left-hand scale: annual percentage changes; right-hand scale: percentages)
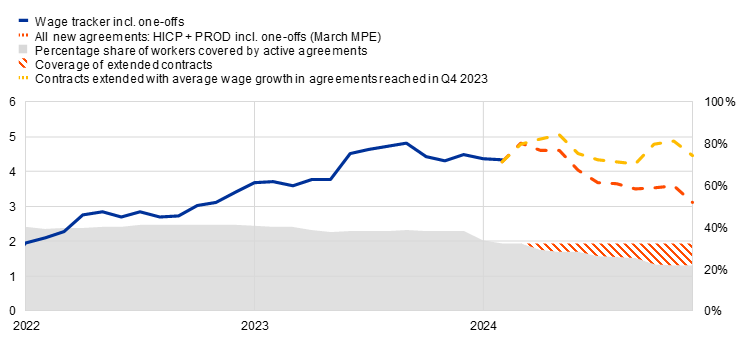
Sources: Dutch employer association (AWVN), Deutsche Bundesbank, Bank of Greece, Banco de España, Banque de France, Banca d’Italia and Oesterreichische Nationalbank.
Notes: The euro area aggregate is based on data for Germany, Greece, Spain, France, Italy, the Netherlands and Austria. The latest observations are for February 2024; for the two extension scenarios based on the March 2024 MPE and contracts signed in the fourth quarter of 2023, the latest observations are for December 2024.
Thus, while we should carefully monitor incoming data, wage growth appears on track to gradually moderate in the medium term towards levels that are consistent with our inflation target and productivity growth, in line with the projections.
And as inflation declines, our current monetary policy stance becomes tighter relative to the inflation outlook. This gives us additional insurance against upside risks to inflation but, as our confidence in the timely convergence of inflation to our target grows, it also strengthens the case for adjusting our policy rates.[26] If we hold them for too long, we might put the recovery at risk and delay the associated cyclical rebound in productivity growth. This would be economically costly and induce risks for the sustained convergence of inflation to our target.
In calibrating our future decisions on the path towards a less restrictive stance, we should be guided by the progress made towards our medium-term target.
On the one hand, if we see that the process of disinflation and the impact of monetary policy are weaker than expected, we can slow down and remain restrictive for longer. This is because even after initial cuts to our policy rates, we would remain well above the range of available estimates of the neutral rate of interest.[27]
On the other hand, a faster process of convergence towards our inflation target and a stronger than expected impact of monetary policy would allow us to normalise our policy rates at a faster pace.
Conclusion
Let me conclude.
Inflation is declining, and a recovery from a protracted period of stagnation is on the horizon. As we become more convinced that the disinflation is sufficiently advanced, we must give the recovery a chance. The unwinding of supply shocks means that lower inflation and higher growth can be achieved simultaneously. This makes it possible for the economy to switch to a faster lane without endangering the disinflation process. Allowing the recovery to proceed will create the conditions for a more favourable disinflation path that is compatible with a sustained convergence to our inflation target.
In turn, this means that there is scope for wages to rebound in the short term. In fact, this is one of the key conditions envisaged in the projections for the recovery to materialise, for productivity growth to pick up, and for both to be sustained. But as economic conditions normalise, wage growth should gradually moderate over the medium term to be consistent with trend productivity growth and our inflation target.
The improving inflation outlook, continued strong transmission and further moderation in inflation all create scope for more confidence that we can dial back restriction. We are coming closer to the point when we will have the confidence to act.
Thank you.
See Lagarde, C. (2024), “Building confidence in the path ahead”, speech at The ECB and its Watchers XXIV Conference, Frankfurt am Main, 20 March.
Euro area employment increased by 3.8% from the fourth quarter of 2019 to the fourth quarter of 2023.
While the reopening of the economy led to a wave of pent-up demand facilitated by savings that had been accumulated during the pandemic, it was largely negative supply shocks – pandemic-induced supply bottlenecks, the energy crisis and Russia’s war against Ukraine – that drove the sharp spike in headline inflation. See Arce, O. Ciccarelli, M., Kornprobst, A. and Montes-Galdon, C. (2024), “What caused the euro area post-pandemic inflation?”, Occasional Paper Series, No 343, ECB, Frankfurt am Main. Recent findings indicate that core inflation in the euro area was also largely driven by supply-side shocks during the post-pandemic recovery. See Bańbura, M., Bobeica, E. and Martínez Hernández, C. (2024), “Shocked to the core: a new model to understand euro area inflation”, Research Bulletin, No 117, ECB, Frankfurt am Main.
The euro area imports around two-thirds of its energy, compared with just over one-fifth for the United States.
Real compensation per employee declined by 3.2% in the first half of 2022 compared with the end of 2021.
Nominal wage growth has also been bolstered by increases in minimum wages at the national level.
See Eurostat data and March 2024 ECB staff macroeconomic projections. Growth in nominal compensation per employee increased to 5.1% in 2023 (up from 4.5% in 2022), slightly below headline inflation, which stood at 5.4% (down from 8.4% in 2022). In 2024 compensation per employee is projected to increase by 4.5% and annual average headline inflation is projected to be 2.3%.
Based on findings from the Price-setting Microdata Analysis Network (PRISMA). See Dedola, L., Henkel, L., Höynck, C., Osbat, C. and Santoro, S. (forthcoming), “What does new micro price evidence tell us about inflation dynamics and monetary transmission?”, Economic Bulletin, ECB.
Arce, O. et al. (2023), “How tit-for-tat inflation can make everyone poorer”, The ECB Blog, 30 March.
With inflation projected to remain too high for too long, the ECB had to prevent a de-anchoring of inflation expectations. This danger warranted substantial policy rate increases to safeguard against the materialisation of upside risks.
The pace of decline in our balance sheet has been driven by maturing and early repayments under the third series of our targeted longer-term refinancing operations. We also brought both the full and partial reinvestment phases of our asset purchase programme to an end and, at the end of 2023, announced the gradual phasing-out of reinvestments under the pandemic emergency purchase programme.
Longer-term inflation expectations were revised down by 0.1 percentage points to 2.0% in the latest Survey of Professional Forecasters (first quarter of 2024). Expectations for long-run expected HICP inflation also remained unchanged at 2.0% in the most recent Survey of Monetary Analysts (March 2024).
Specifically, since May 2023.
Empirical analysis by ECB staff shows that core inflation is not a timely indicator of medium-term inflation and that using current core inflation to forecast future headline inflation does not produce substantial gains compared with a simple autoregressive model, especially over short horizons. See also Lenza, M. and Reichlin, L. (2011), “Should the ECB use core inflation as a signal for medium-term inflation?”, VoxEU Column, 24 June and Panetta, F. (2023), "Getting disinflation right”, speech at Bocconi University, 3 August.
For instance, the Persistent and Common Component of Inflation (PCCI).
See Bańbura, M. et al. (2023), “Underlying inflation measures: an analytical guide for the euro area”, Economic Bulletin, Issue 5, ECB.
ECB (2024), January 2024 euro area bank lending survey.
Defined as the change in the cyclically adjusted primary balance.
Wages account for 38.4% of direct input costs for service providers.
Empirical evidence points to a larger pass-through from wages to prices for the euro area compared with other jurisdictions. See, for example, Bobeica, E. et al. (2019), “The link between labor cost and price inflation in the euro area”, Working Paper Series, No 2235, ECB, February; Bobeica, E. et al. (2021), “The changing link between labor cost and price inflation in the United States”, Working Paper Series, No 2583, ECB, August; Hahn (2020), “The wage-price pass-through in the euro area: does the growth regime matter?”, Working Paper Series, No 2485, ECB, October; and Ampudia et al. (forthcoming).
For this pass-through to fully materialise, it generally takes longer than two to three years, with some differences across countries and sectors.
Firm-level data also indicate that higher profits are associated with a higher likelihood of labour hoarding by firms. According to ECB staff estimates, a 1 percentage point increase in profit margins raises the likelihood of labour hoarding by around 0.2 percentage points.
Bobasu, A. and Gareis, J. (2022), “The impact of higher energy prices on services and goods consumption in the euro area”, Economic Bulletin, Issue 8, ECB.
See Lagarde, C., op. cit.: “[…] our policy framework will remain important to process the incoming data and calibrate the appropriate policy stance. At the same time, the relative weights assigned to the three criteria will have to be regularly examined.”
See Chahad, M., Hofmann-Drahonsky, A., Martínez Hernández, C. and Page, A. (2024), “An update on the accuracy of recent Eurosystem/ECB staff projections for short-term inflation”, Economic Bulletin, Issue 2, ECB.
Compared with the projections for December 2023, annual average headline inflation was revised downwards by 0.4 and 0.1 percentage points for 2024 and 2025 respectively in the March projections.
The natural rate of interest (r* or “r-star”), is defined as the real rate of interest that is neither expansionary nor contractionary. See Brand, C., Lisack, N. and Mazelis, F. (2024), “Estimates of the natural interest rate for the euro area: an update”, Economic Bulletin, Issue 1, ECB.
Europeiska centralbanken
Generaldirektorat Kommunikation och språktjänster
- Sonnemannstrasse 20
- 60314 Frankfurt am Main, Tyskland
- +49 69 1344 7455
- media@ecb.europa.eu
Texten får återges om källan anges.
Kontakt för media-
27 March 2024