
Summary
In the ECB Survey of Professional Forecasters (SPF) for the first quarter of 2022, HICP inflation expectations were revised up, standing at 3.0%, 1.8% and 1.9% for 2022, 2023 and 2024 respectively.[1] Compared with the previous round (fourth quarter of 2021), these were higher by 1.1 percentage points for 2022 and by 0.1 percentage points for 2023 (expectations for 2024 were not surveyed in the previous round). Longer-term inflation expectations for 2026 were revised up to 2.0% from 1.9% in the previous round, implying a notable upward movement of between 0.2 and 0.3 percentage points of longer-term inflation expectations over the past three rounds. GDP growth expectations were revised down for 2022, up for 2023 and remained the same for the longer term. The profile of GDP in level terms was on average broadly unchanged. The profile of the expected unemployment rate was revised down for all horizons by between 0.2 and 0.3 percentage points. Indicators of the uncertainty surrounding expectations for the main macroeconomic variables remained elevated compared with pre-coronavirus (COVID-19) levels.
Table 1
Results of the SPF in comparison with other expectations and projections
(annual percentage changes, unless otherwise indicated)
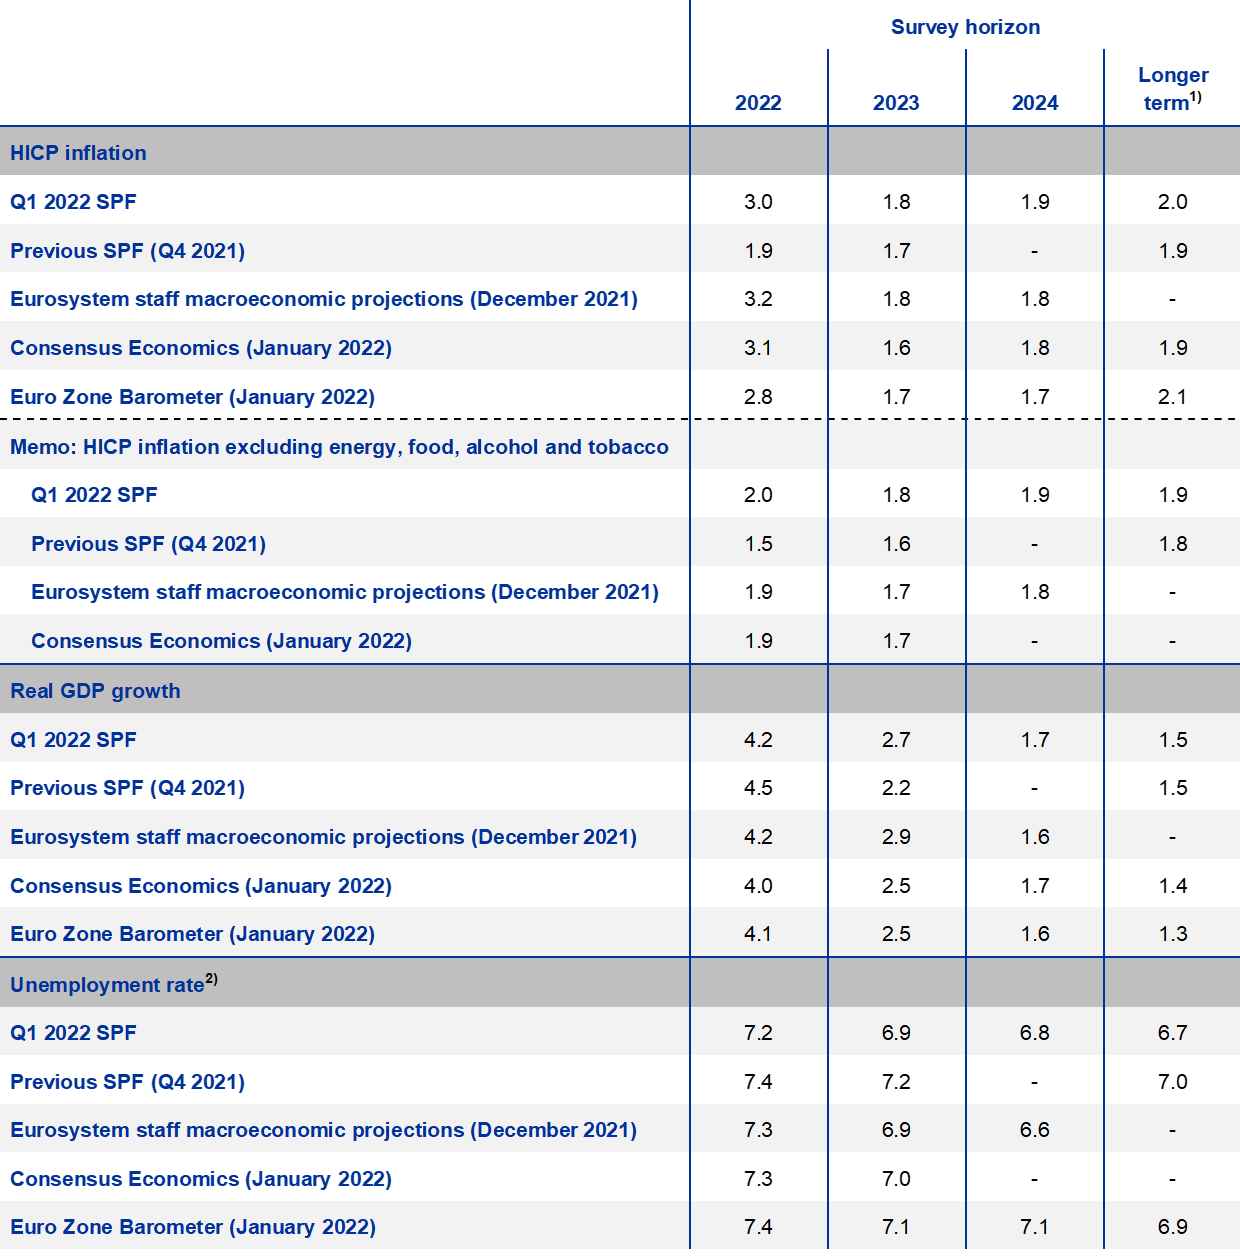
1) Longer-term expectations refer to 2026.
2) As a percentage of the labour force.
1 HICP inflation expectations revised up, particularly for 2022
SPF respondents revised up their inflation expectations across all horizons, but most noticeably for 2022. Inflation expectations for 2022, 2023 and 2024 were 3.0%, 1.8% and 1.9% respectively (see Chart 1). For 2022 and 2023 this implies upward revisions of 1.1 and 0.1 percentage points compared with the previous survey (for the fourth quarter of 2021). Expectations for 2024 were not surveyed in the previous round. Compared with the December 2021 Eurosystem staff macroeconomic projections, inflation expectations in this SPF round were lower by 0.2 percentage points for 2022, the same for 2023 and were higher by 0.1 percentage points for 2024 (see Table 1).
Chart 1
Inflation expectations: overall HICP inflation and HICP inflation excluding energy, food, alcohol and tobacco
(annual percentage changes)

Regarding the near-term outlook, respondents reported high energy prices and demand-supply imbalances as the main factors behind their upward revision to the 2022 inflation forecast. Both these factors were cited as factors behind upward revisions in the previous round, but the recent developments were seen to have been even more intense and more persistent than previously anticipated. However, respondents indicated that they still consider that these effects will not be long lasting. This qualitative assessment is supported by their forecasts as, notwithstanding the large upward revision to the average annual inflation rate forecast for 2022 as a whole, respondents still expect a substantial decline in inflation during the course of 2022. Their one-year ahead forecast for inflation in December 2022 was 1.8% and represents a considerable expected decline compared with the latest available inflation data (5.0% HICP flash estimate for December 2021). This was attributed in part to base effects from the increases observed already in 2021 as well to expectations that some energy market tensions and demand-supply imbalances will ease by the end of 2022 (previously this easing was expected in the first half of 2022).
Respondents did not substantially change their assessment of the broader factors influencing the more medium-term inflation outlook. In addition to their regular, more general assessment, respondents were also asked to “elaborate, (a) whether, and to what extent, you have included second-round effects of the currently elevated inflation rate in your baseline forecast and probability distributions for wages; and (b) to what extent your inflation expectations include a general (re)assessment of the broadness and duration of inflationary pressures”. On expected wage developments, while many respondents expected an increase in negotiated wages in 2022, they generally believed this was partly a recompense for low increases in 2021 and higher inflation; and it would not presage the start of a so-called wage-price spiral.[2] At the same time, wages were identified as a key risk indicator to be monitored for signs of more sustained inflationary pressures should elevated increases in negotiated wages materialise and persist beyond 2022. Although many respondents expected higher negotiated wages in 2022 compared with 2021, on average they did not revise up the profile of their expected labour cost developments over the period 2022-24. More generally, some respondents considered that recent inflation developments indicated a substantially changed inflation regime, whilst others considered that they marked the end of “too low” inflation but not the start of “too high” inflation. A number of respondents expected that if the pandemic situation normalises, there might be a shift away from goods inflation toward services inflation but no overall increase in the broadness of inflationary pressures per se.
For the shorter and medium-term horizons, quantitative indicators of uncertainty surrounding the inflation outlook increased further and those for the balance of risks were on the upside.[3] Quantitative indicators of uncertainty for inflation derived from the reported probability distributions increased further to reach historically high levels. For the one and two-year ahead horizons, the increase in “aggregate uncertainty” owed to a combination of higher “disagreement” across forecasters about their point forecasts as well as a higher average level of “individual uncertainty”, with the former contributing more to the increase. The aggregate probability distributions for the calendar years from 2022 to 2024 are presented in Chart 2. The quantitative balance of risk indicator (calculated as the estimated mean of the aggregate probability distribution minus the average reported point expectation) for shorter horizons was generally to the upside. In their qualitative remarks, respondents reported elevated uncertainties for the short-term inflation outlook in particular regarding the evolution of energy prices (and their indirect effects), of demand-supply imbalances and of the pandemic situation more generally. Considering the more medium-term risks, the key factor identified was the evolution of wages.
SPF expectations for inflation excluding energy, food, alcohol and tobacco (HICPX) were revised up for all horizons. HICPX expectations for 2022, 2023 and 2024 stood at 2.0%, 1.8% and 1.9% representing upward revisions of 0.5 percentage points for 2022 and 0.2 percentage points for 2023. Expectations for 2024 were not surveyed in the previous round. Respondents indicated that the upward revisions reflect a higher starting point as well as indirect effects from higher energy prices and effects from demand-supply imbalances. The expected profile of HICPX inflation has changed somewhat in that there is now some easing from a higher rate while previously there had been expectations of a gradual and continuous strengthening from lower levels. Respondents still expect an upward impact on underlying inflationary dynamics from a gradual reduction in economic slack, but this appears to be offset by an easing impact from current supply bottlenecks and from the indirect effects of high energy prices. The SPF forecasts for HICPX were slightly higher (by 0.1 percentage points) than those from the December 2021 Eurosystem staff macroeconomic projections for 2022, 2023 and 2024 (see Table 1).
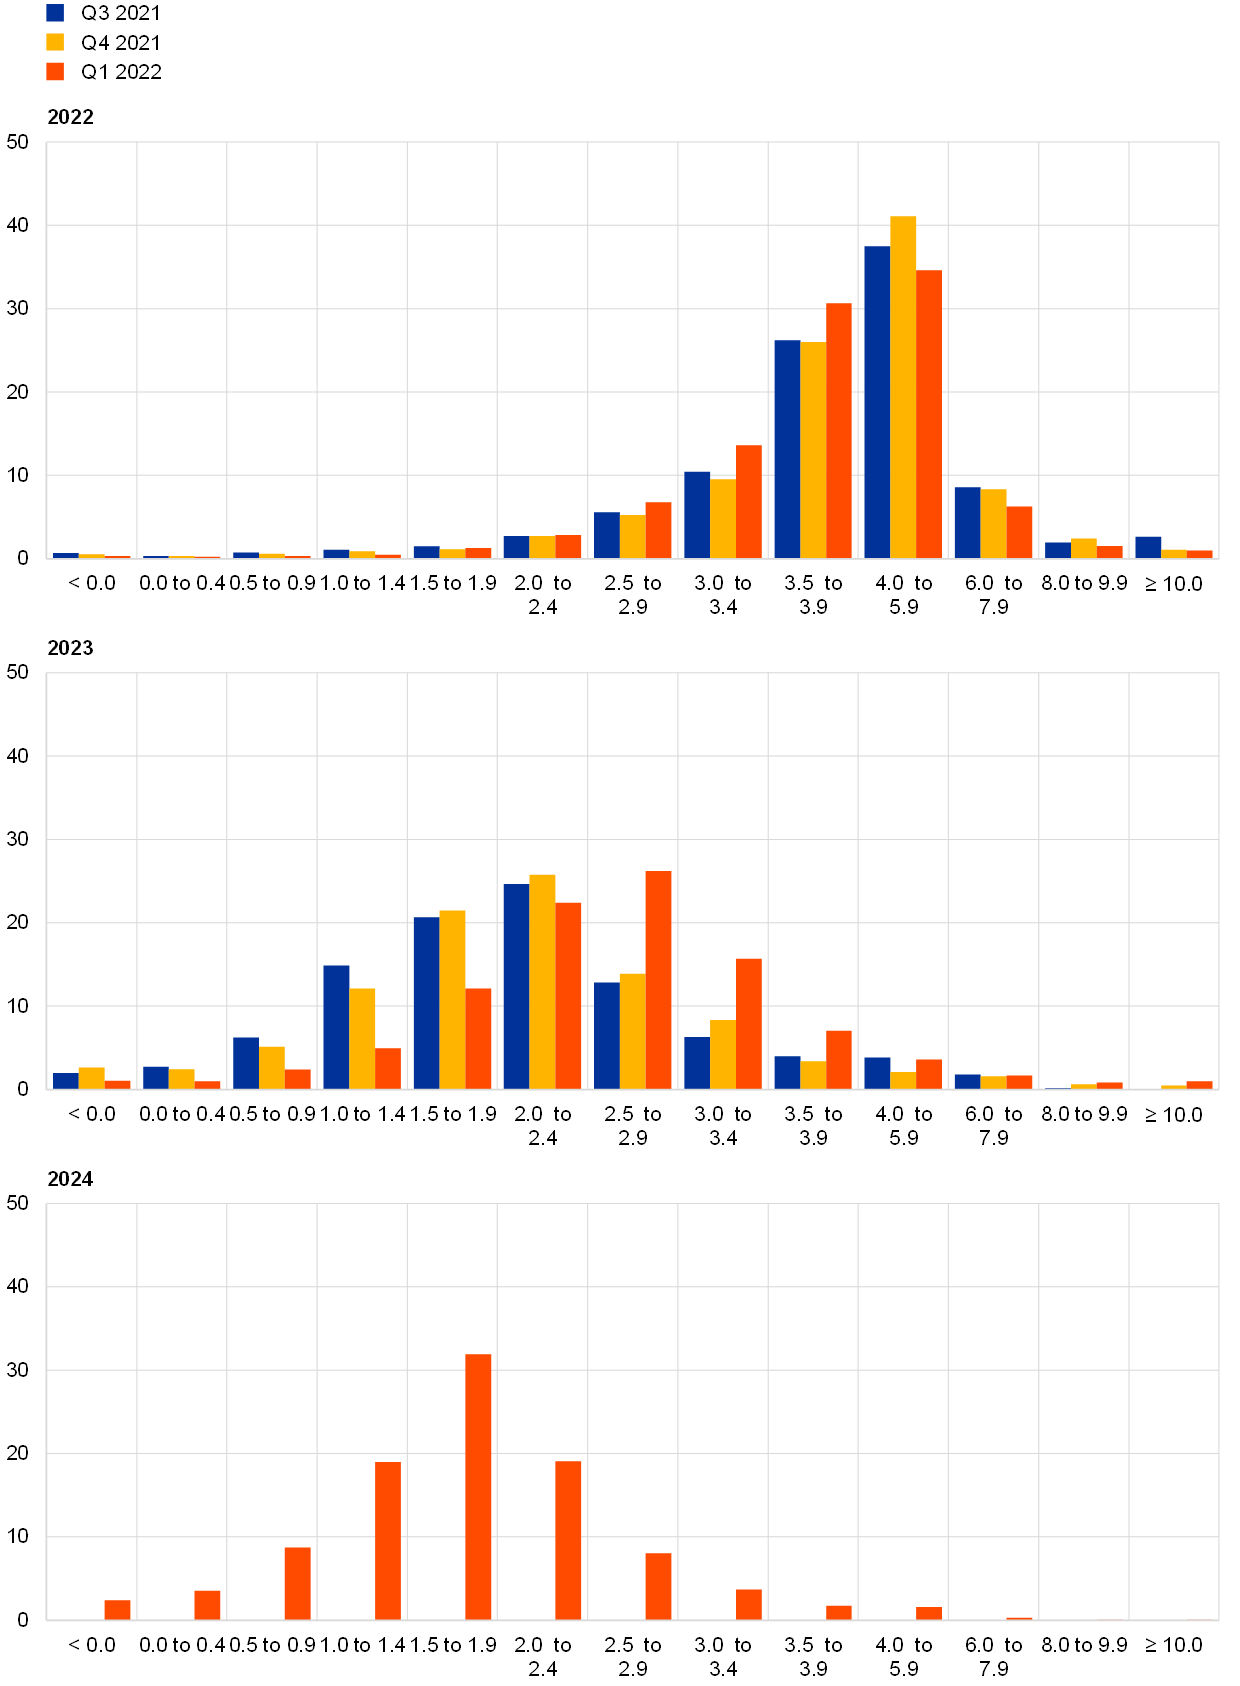
Chart 2
Aggregate probability distributions for expected inflation in 2022, 2023 and 2024
(x-axis: HICP inflation expectations, annual percentage changes; y-axis: probability, percentages)

Notes: The SPF asks respondents to report their point forecasts and to separately assign probabilities to different ranges of outcomes. This chart shows the average probabilities they assigned to different ranges of inflation outcomes in 2022, 2023 and 2024. Expectations for 2024 were not surveyed in the previous two rounds.
2 Longer-term inflation expectations revised up to 2.0%
Longer-term inflation expectations (for 2026) averaged 2.0%, an upward revision from 1.9% in the previous round. Having remained in a narrow range (1.64-1.69%) in the SPF rounds between the fourth quarter of 2019 and the second quarter of 2021, longer-term inflation expectations have moved up noticeably in the last three rounds (third and fourth quarter of 2021 and the first quarter of 2022). While part of this upward movement was due to a relatively strong outlier, the upward revision over the last three rounds excluding this outlier was still relatively strong at 0.22 percentage points (from 1.68% to 1.90%). In this round (first quarter of 2022), considering a balanced panel of those who also replied in the fourth quarter of 2021 round, many more respondents revised their longer-term inflation expectations upward than downward.[4] The median point expectation increased to 1.9%. The estimated mean of the aggregate probability distribution remained unchanged at 1.9% (see Chart 3). The distribution of individual point forecasts has changed considerably when compared with recent rounds (i.e. from the first quarter of 2019 to the fourth quarter of 2021 – see Chart 4). There were many more respondents reporting 2.0% and the mode of the distribution was clearly at 2.0% (for the first time since the fourth quarter of 2015 round).
Chart 3
Longer-term inflation expectations
(annual percentage changes)
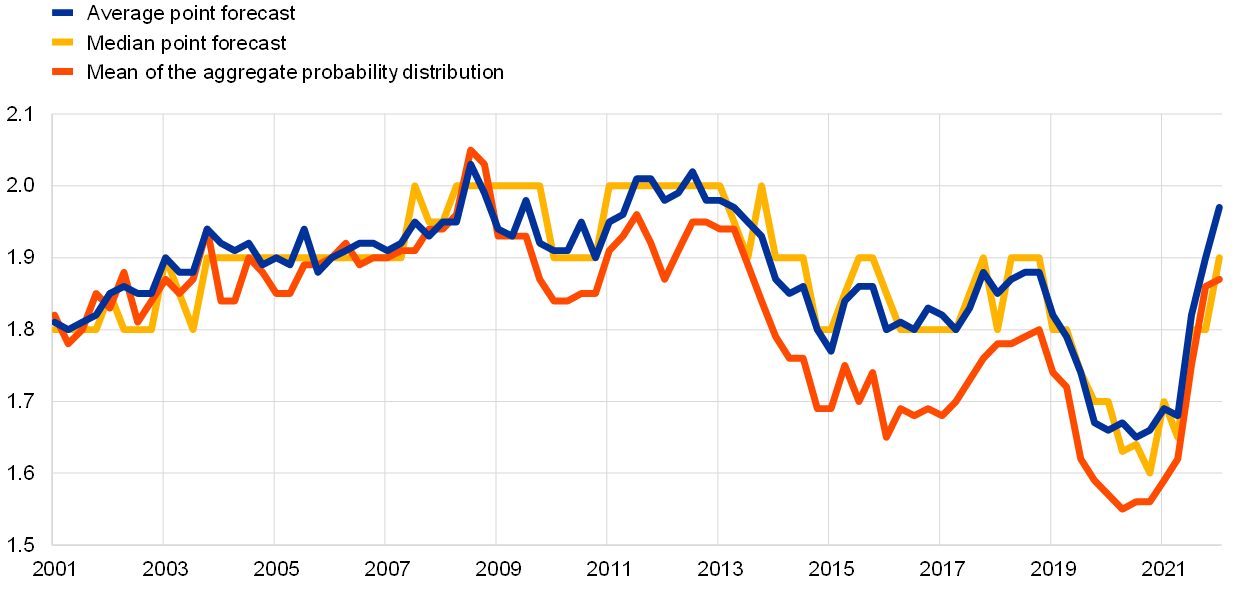
Chart 4
Distribution of point expectations for HICP inflation in the longer term
(x-axis: longer-term HICP inflation expectations, annual percentage changes; y-axis: percentages of respondents)
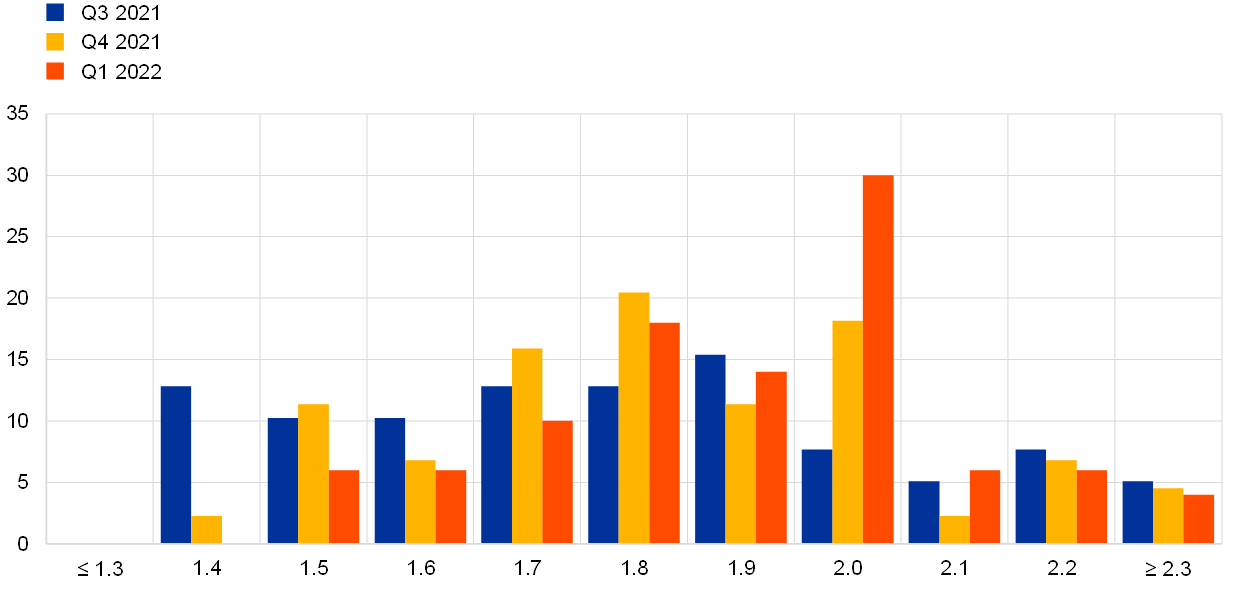
Notes: The SPF asks respondents to report their point forecasts and to separately assign probabilities to different ranges of outcomes. This chart shows the spread of point forecast responses.
Uncertainty surrounding longer-term inflation expectations increased further while the balance of risks became more negative. The increase in the standard deviation of the aggregate probability distribution (see Chart 5) owed to a combination of higher disagreement and higher individual uncertainty. The apparent downward shift in the balance of risk indicator was due to the outlier mentioned above – excluding the outlier, the balance of risks was still to the downside but broadly unchanged from the previous round. The probability associated with longer-term inflation being negative remained unchanged from the previous round, at around 2%. The probability associated with longer-term inflation being in the range of 1.5-2.5% remained unchanged at 52%, with a 20% probability above this range and a 28% probability below this range.
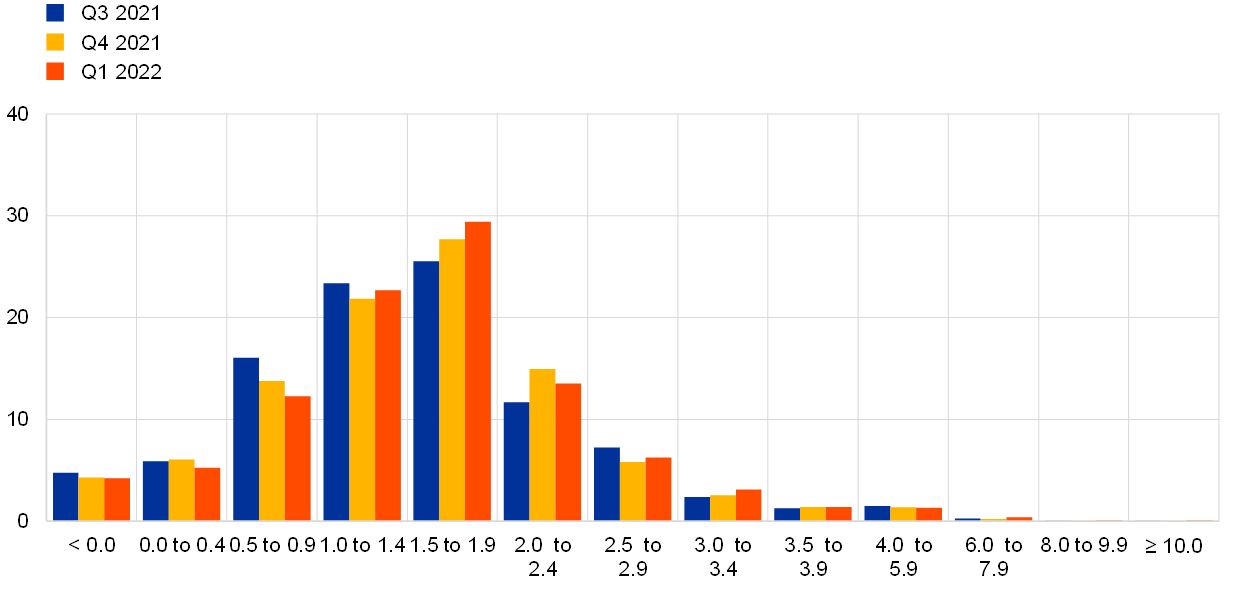
Chart 5
Aggregate probability distribution for longer-term inflation expectations
(x-axis: HICP inflation expectations, annual percentage changes; y-axis: probability, percentages)

Notes: The SPF asks respondents to report their point forecasts and to separately assign probabilities to different ranges of outcomes. This chart shows the average probabilities they assigned to different ranges of inflation outcomes in the longer term.
The longer-term expectations for HICP inflation excluding energy, food, alcohol and tobacco (HICPX) were also revised upward. They increased to 1.9% for 2026, up from 1.8% in the previous round. The median longer-term point expectation for HICPX was unchanged at 1.8%. Half of the respondents who provided longer-term HICPX expectations in both the first quarter of 2022 and fourth quarter of 2021 rounds revised them up and none revised them down. The evolution of longer-term expectations for HICP and HICPX inflation has been broadly similar for the period of available data since the fourth quarter of 2016, and the level difference of around 0.1 percentage points on average has remained broadly unchanged also in the first quarter of 2022 round.
3 Real GDP growth expectations largely unchanged
GDP growth expectations in the first quarter of 2022 survey round stood at 4.2% for 2022, 2.7% for 2023 and 1.7% for 2024 (see Chart 6). These imply opposing revisions compared with the previous round: a downward revision of 0.3 percentage points for 2022 and an upward revision of 0.5 percentage points for 2023. Respondents explained their downward revisions for 2022 by the loss of economic momentum caused by the Omicron variant of the coronavirus (COVID-19), higher energy prices curtailing purchasing power, and deferred production owing to persistent supply chain bottlenecks. Respondents pointed to downside risks to growth from economic sectors such as services industries, particularly tourism, hospitality and air travel, which continue to suffer from the effects of COVID-19. Looking ahead, they expected the euro area economy largely to continue its ongoing recovery from the pandemic. The spending of accumulated savings and fiscal stimulus from the European recovery plan were identified as upward risks by some respondents. Several also mentioned the probability that new strict lockdowns could be avoided as high vaccination rates should permit activity to return to a more normal path. They noted that the new COVID-19 variant seems to imply fewer hospitalisations than last winter, and that Europeans appear better prepared to cope. Further, according to some respondents, bottlenecks should start to ease in the second half of 2022 and into 2023, with less pandemic-related disruption and more capacity in maritime transportation, together with greater availability of semiconductors for manufacturing. Downside risks to this scenario from continuing high inflation, a slowdown in global trade and a worse than anticipated path of COVID-19 infections were mentioned. Longer-term growth expectations (which refer to 2026) remained at 1.5%.
Chart 6
Expectations for real GDP growth
(annual percentage changes)

Respondents were again asked to provide the profile of their short-term GDP outlook (from the fourth quarter of 2021 until the third quarter of 2022).[5] Actual quarterly GDP growth for the third quarter of 2021 was 2.2%, similar to the forecast of 2.1% in the previous SPF round.[6] In this round, forecasters expected a clearer slowdown in quarter-on-quarter growth in the fourth quarter of 2021 to 0.4% (lower than the 1.0% expected in the previous round). They then forecast growth in real GDP of around the same pace (0.5%) in the first quarter of 2022. Growth was then expected to be higher in the second and third quarters of 2022, at 1.2% and 1.0% respectively (see Chart 7). Compared with the December 2021 Broad Macroeconomic Projection Exercise (BMPE), SPF respondents were on average more optimistic for the fourth quarter of 2021 and the first quarter of 2022, and slightly less optimistic for the second and third quarters of 2022. On average, over the four quarters, expectations were broadly similar.
Chart 7
Expected profile of quarter-on-quarter GDP growth
(quarter-on-quarter percentage changes)

Notes: Grey area indicates one standard deviation (of individual expectations) around average SPF expectation.
Real GDP is estimated to have returned above its pre-pandemic level in the fourth quarter of 2021 and is expected to exceed the pre-COVID-19 profile in 2023 – see Chart 8. The counteracting revisions to expected growth in the fourth quarter of 2021 and the first quarter of 2022 (downwards) and those for the second and third quarters of 2022 (upwards) mean that the expected profile of GDP in level terms is broadly unchanged. However, GDP in level terms is now expected to exceed the path expected prior to the pandemic in 2023 compared with 2024 in the previous round. Expected GDP levels are also marginally higher than forecast in the December 2021 Eurosystem staff macroeconomic projections.
Chart 8
Forecast profile of real GDP level
(2019 = 100)
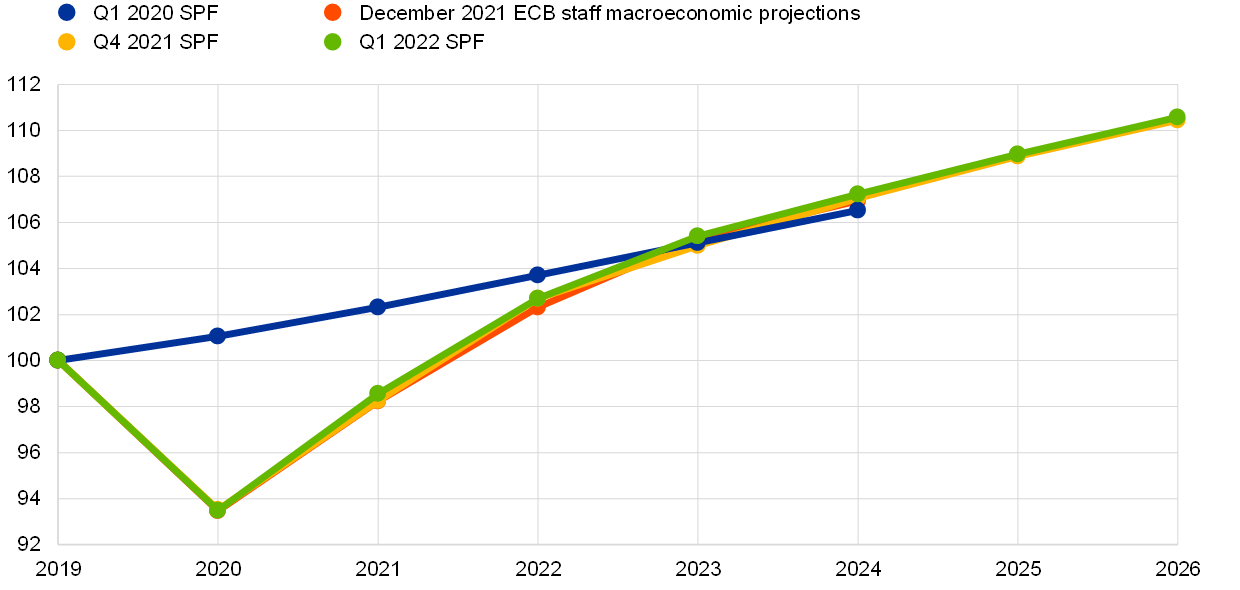
Notes: Growth expectations for years not surveyed have been interpolated linearly.
Quantitative measures of uncertainty provided mixed signals in this round (see Chart 9 and Chart 10). Aggregate uncertainty decreased somewhat at the two-year ahead horizon but increased slightly for the longer term. Overall, uncertainty was still elevated by historical standards but also considerably lower than at its peak in the second and third quarters of 2020. Many of the risk factors identified in the qualitative comments were the same factors mentioned when explaining the baseline forecasts. On the upside these included the possibility that the pandemic situation evolves more favourably as well as the possible release of pent-up consumer demand and savings. Respondents also pointed to downside risks, with the most cited ones being supply bottlenecks and rising inflation, which threaten to reduce the disposable income of households and therefore demand, as well as the uncertainty surrounding the future path of the pandemic.
Chart 9
Aggregate probability distributions for GDP growth expectations for 2022, 2023 and 2024
(x-axis: real GDP growth expectations, annual percentage changes; y-axis: probability, percentages)
Notes: The SPF asks respondents to report their point forecasts and to separately assign probabilities to different ranges of outcomes. This chart shows the average probabilities they assigned to different ranges of real GDP growth outcomes in 2022, 2023 and 2024. For outcomes above 4%, bins are 2 percentage points wide. Expectations for 2024 were not surveyed in the previous two rounds.
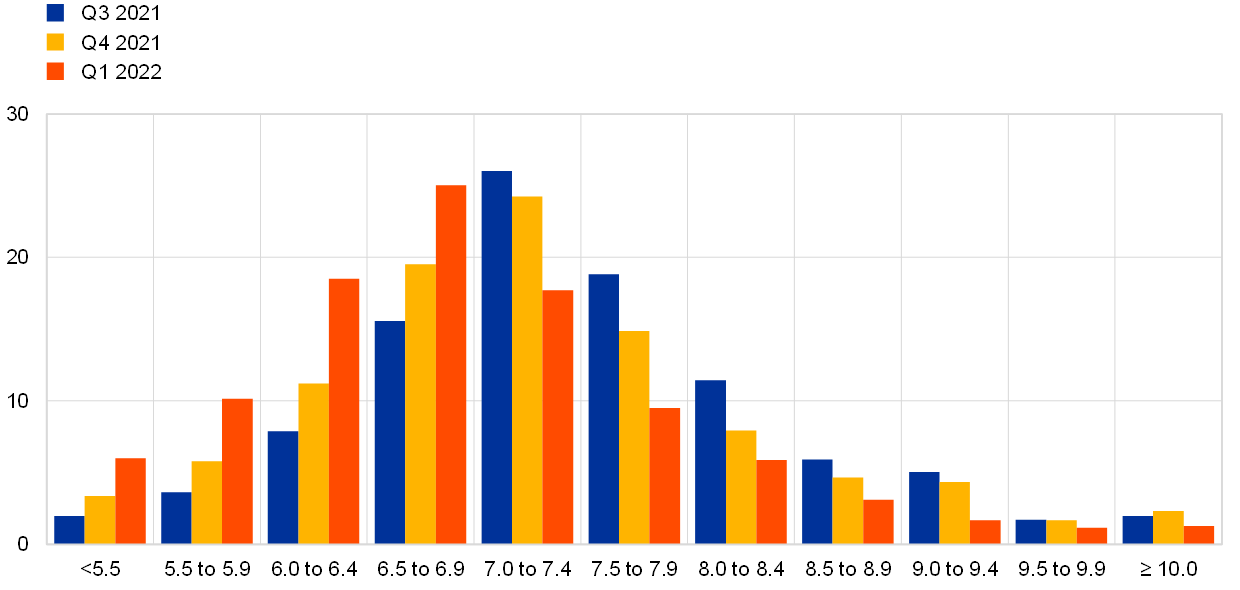
Chart 10
Aggregate probability distribution for longer-term GDP growth expectations
(x-axis: real GDP growth expectations, annual percentage changes; y-axis: probability, percentages)
Notes: The SPF asks respondents to report their point forecasts and to separately assign probabilities to different ranges of outcomes. This chart shows the average probabilities they assigned to different ranges of real GDP growth outcomes in the longer term.
4 Unemployment rate expectations revised down for all horizons
The average point forecasts for the unemployment rate in the first quarter of 2022 round were revised further down to 7.2%, 6.9% and 6.8% for 2022, 2023 and 2024 respectively. The expectation for 2026 was 6.7% and is the lowest rate recorded for long-term unemployment expectations since the third quarter of 2008. The downward sloping trajectory is broadly similar to that of the previous round but at a level lower by 0.2-0.3 percentage points (see Chart 11). Respondents attributed the downward revisions to the continued improvement in the labour market, the lower realised data of 2021 and the ongoing economic recovery. The end of government support measures was mentioned as the main upside risk to unemployment, together with labour scarcity from some sectors and the possible impact of the large accumulation of household savings on labour force participation rates. However, a few respondents also mentioned the possibility that higher wages might compensate for higher inflation as an upside risk to unemployment.
Chart 11
Expectations for the unemployment rate
(percentages of the labour force)

Uncertainty surrounding unemployment rate expectations increased for the shorter horizons and still stands at elevated levels, while overall risks were to the upside for all horizons. On balance, the probability distributions showed marginally (positive) skewness toward higher unemployment rate outcomes for both short and long horizons (see Chart 12 and Chart 13). The balance of risk indicator for longer-term expectations remained positive as the mean of the aggregated probability distribution (at 6.9%) was higher than the average point forecast (6.7%).
Chart 12
Aggregate probability distributions for the unemployment rate in 2022, 2023 and 2024
(x-axis: unemployment rate expectations, percentages of the labour force; y-axis: probability, percentages)
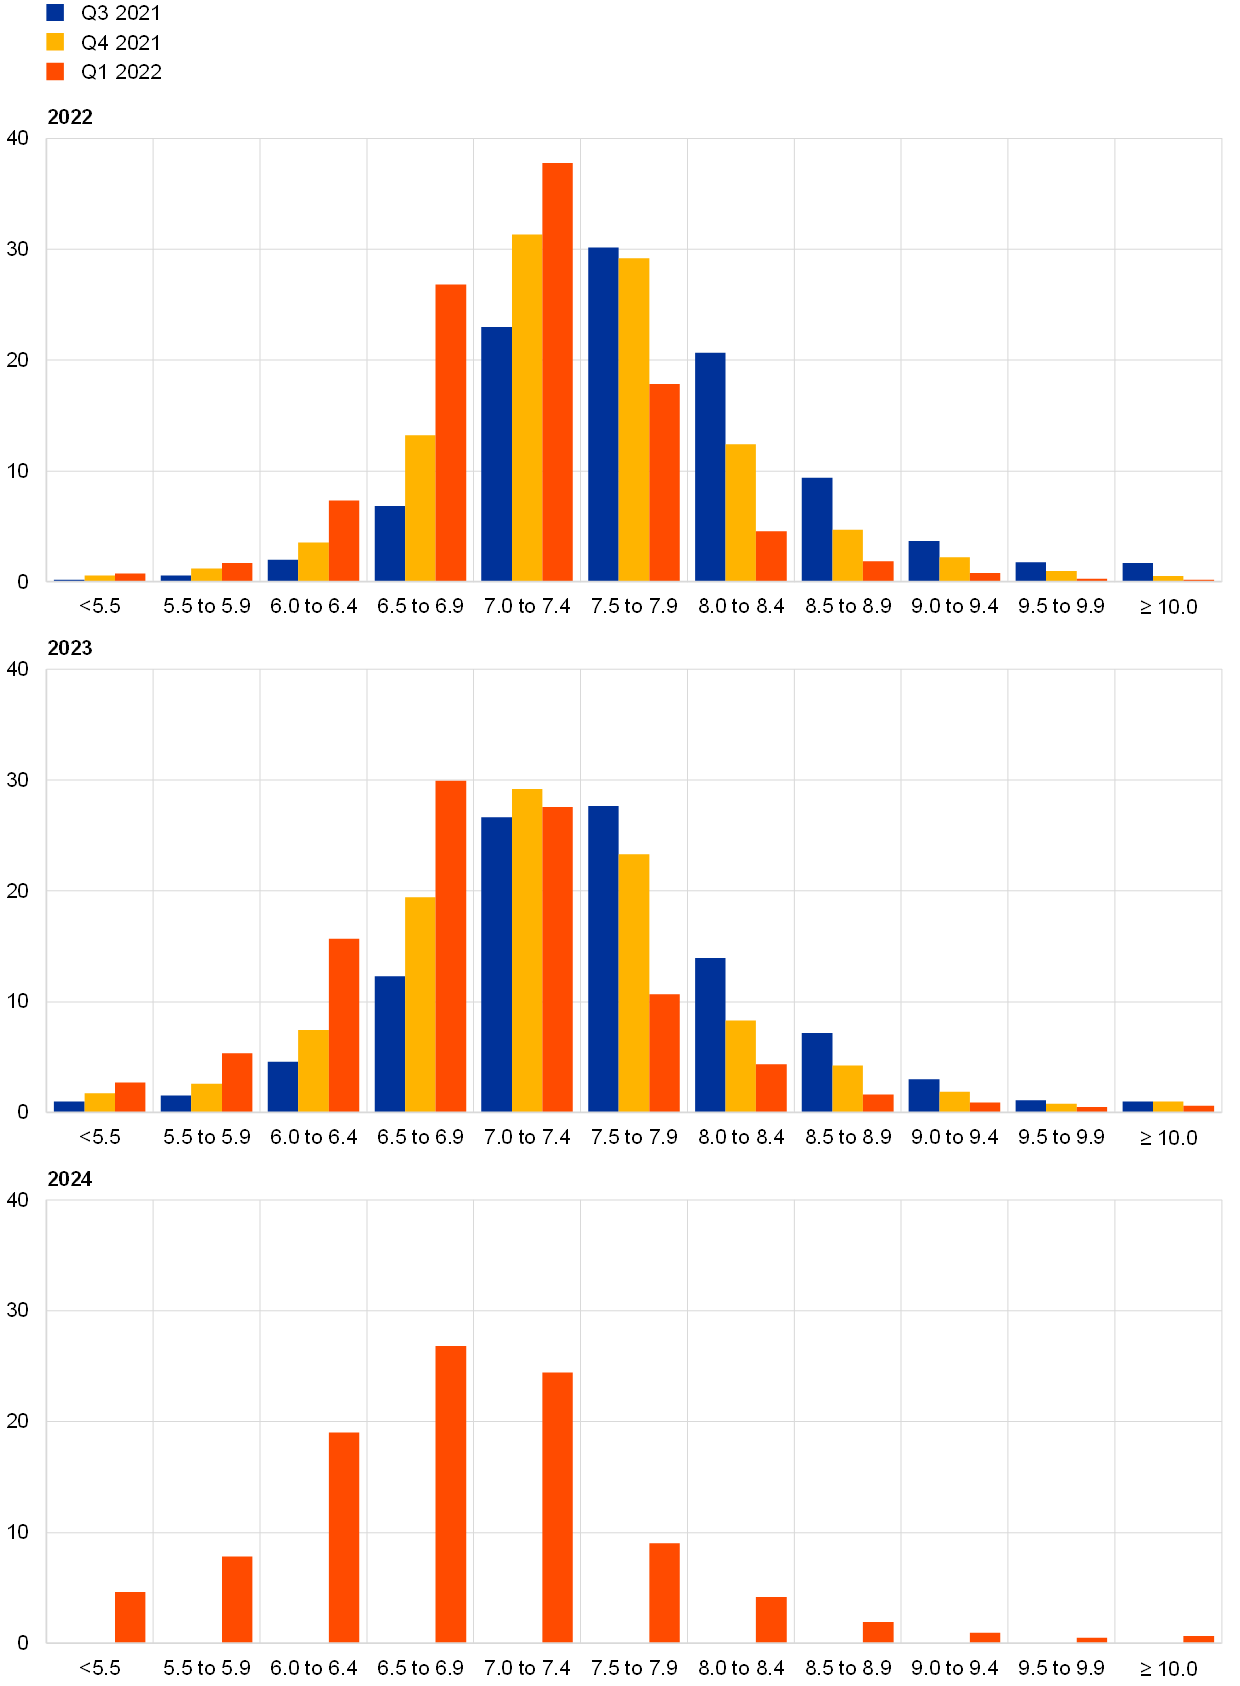
Notes: The SPF asks respondents to report their point forecasts and to separately assign probabilities to different ranges of outcomes. This chart shows the average probabilities they assigned to different ranges of unemployment rate outcomes for 2022, 2023 and 2024. Expectations for 2024 were not surveyed in the previous two rounds.
Chart 13
Aggregate probability distribution for the unemployment rate in the longer term
(x-axis: unemployment rate expectations, percentages of the labour force; y-axis: probability, percentages)
Notes: The SPF asks respondents to report their point forecasts and to separately assign probabilities to different ranges of outcomes. This chart shows the average probabilities they assigned to different ranges of unemployment rate outcomes in the longer term.
5 Expectations for other variables
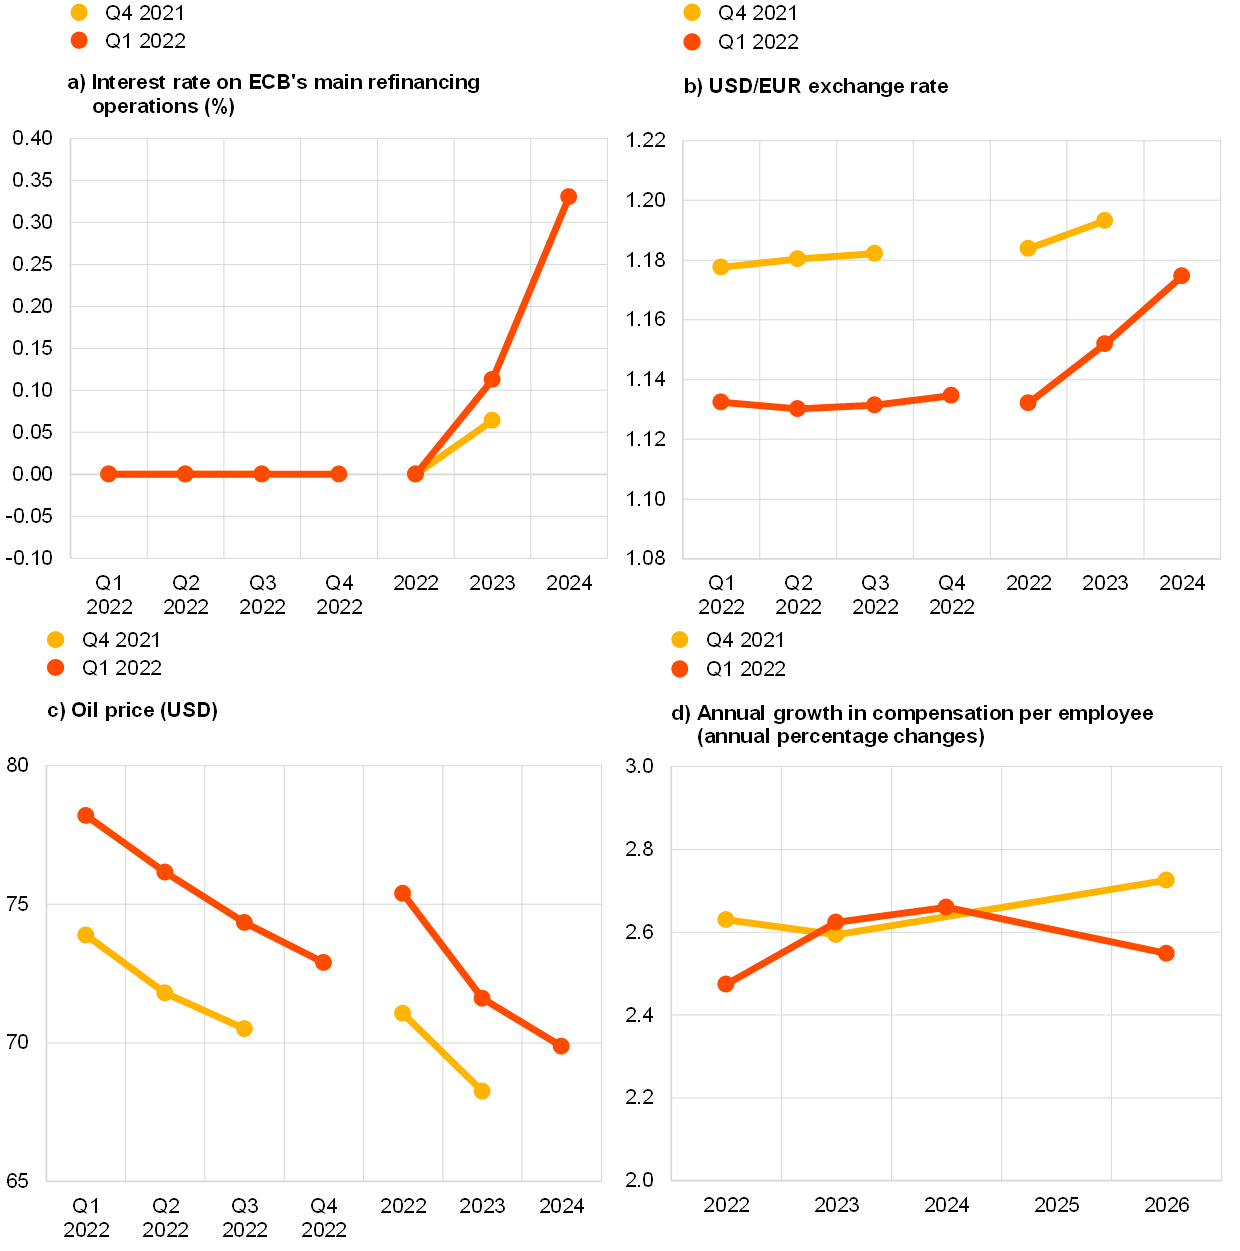
Forecasters expected: the ECB’s key interest rates to remain largely unchanged in 2022 and to increase very marginally in 2023 and 2024; the euro to be largely stable against the dollar at about 1.13 until 2023; oil prices to decrease gradually to levels around USD 70 per barrel until 2023; and nominal wage growth to hover above but close to 2.5% until 2026.
The median (and majority) expectation was for the rate on the Eurosystem’s main refinancing operations to remain at 0% for the year 2022. Thereafter, however, respondents on average expected interest rates to rise slightly to 0.11% (up from 0.05%) in 2023 and to reach 0.33% by 2024 (see Chart 14a). Overall, expectations for a rise in interest rates in 2023 and 2024 became stronger with about 52% (up from 25%) of forecasters reporting a positive interest rate in 2023 and 74% in 2024, the highest shares since the second quarter of 2019 round.
The expected average USD/EUR exchange rate was revised downward to around 1.13 for the first quarter of 2022 and was expected to remain at that level for the whole of 2022, before marginally increasing at a constant rate up to 1.17 by 2024 (see Chart 14b).
Compared with the previous round, the level of US dollar-denominated oil prices (per barrel) was revised upwards. The revisions were around USD 4 and USD 3 per barrel for 2022 and 2023 respectively. Overall, the profile of expected oil prices follows a downward trajectory from about USD 78 per barrel in the first quarter of 2022 to around USD 70 per barrel in 2024 (see Chart 14c). Given the marginally weaker expectations for the USD/EUR exchange rate over near horizons, the implied revisions to the profile for the oil price in euro terms are somewhat larger compared with revisions in US dollar terms – EUR 6.6 in 2022 and 5.0 EUR in 2023. This implies a profile largely in line with that of assumptions used for the December 2021 Eurosystem staff macroeconomic projection exercise.
Expectations for the annual growth in compensation per employee were revised down by 0.2 percentage points in 2022 compared with the previous round, while remaining roughly the same in 2023 (see Chart 14d). Although revised down by 0.2 percentage points, long-term expectations stand at 2.5% thereby remaining above the average expected growth rate of about 2.2% recorded between 2012 and 2019 for that horizon. Wage growth is expected to increase from 2.5% in 2022 to 2.7% in 2024 but ease to 2.5% by 2026.
Chart 14
Expectations for other variables
6 Annex (chart data)
Excel data for all charts can be downloaded here.
© European Central Bank, 2022
Postal address 60640 Frankfurt am Main, Germany
Telephone +49 69 1344 0
Website www.ecb.europa.eu
All rights reserved. Reproduction for educational and non-commercial purposes is permitted provided that the source is acknowledged.
For specific terminology please refer to the ECB glossary (available in English only).
PDF ISSN 2363-3670, QB-BR-22-001-EN-N
HTML ISSN 2363-3670, QB-BR-22-001-EN-Q
- The survey was conducted on 7–13 January 2022 with 62 responses received – this is slightly above the historical average response of 60 for the first quarter (January) round. Participants were provided with a common set of the latest available data for annual HICP inflation (December 2021 flash estimates: overall inflation, 5.0%; underlying inflation, 2.6%), annual GDP growth (third quarter of 2021, 3.9%) and unemployment (November 2021, 7.2%).
- See the Section entitled “Expectations for other variables” for more detailed information on assumptions regarding oil prices, the USD/EUR exchange rate, ECB policy rates and wage growth.
- The width of the reported probability distributions indicates the perceived degree of overall uncertainty, whereas the asymmetry of the distributions indicates whether that uncertainty is more concentrated on higher or lower outturns, i.e. it measures the perceived balance of risks. Regarding uncertainty, it can be shown that the width (or standard deviation) of the aggregated probability distribution (i.e. “aggregate uncertainty”) is a function of the average width (or standard deviations) of the individual probability distribution (i.e. “individual uncertainty”) and standard deviation of the individual point forecasts (i.e. “disagreement”).
- Of the 40 respondents providing longer-term inflation expectations in both rounds (first quarter of 2022 and fourth quarter of 2021), 19 revised them up, three revised them down, and 18 were unchanged.
- 48 respondents provided this profile.
- At the time the survey was conducted, the second estimate of GDP in the third quarter of 2021 reported quarter-on-quarter growth of 2.2%. This was revised to 2.3% in the third estimate (released on 19 January 2022).
-
4 February 2022