

This 21st annual review of the international role of the euro published by the European Central Bank (ECB) presents an overview of developments in the use of the euro by non-euro area residents.
The report covers developments in 2021. During this period, the euro area and other major economies recovered from the coronavirus (COVID-19) pandemic recession. The euro area has experienced one of the steepest recoveries in its history, thanks also to ample fiscal and monetary policy support. Now we face rising global inflation driven by higher energy costs, supply bottlenecks and normalising demand as economies reopen. On balance, however, these developments have not resulted in a significant change in the international role of the euro. On the one hand, the share of the euro in global foreign exchange reserves increased slightly, and the share of the euro in international bond issuance, in outstanding international loans and in outstanding international deposits increased markedly. On the other hand, the share of the euro in foreign exchange settlements declined. The share of the euro in the outstanding stock of international debt securities, as well as in invoicing of both extra-euro imports and exports, remained broadly stable in the review period.
Moreover, the report discusses the implications of the Russian invasion of Ukraine and of the financial sanctions imposed on Russia for the future of international currencies. The Union’s economic and financial resilience to the current geopolitical challenges can also support the international role of the euro.
The international role of the euro is primarily supported by a deeper and more complete Economic and Monetary Union (EMU), including advancing the capital markets union, in the context of the pursuit of sound economic policies in the euro area. The Eurosystem supports these policies and emphasises the need for further efforts to complete EMU.
The ECB will continue to monitor developments and publish information on the international role of the euro on a regular basis.
Christine Lagarde
President
1 Main findings
The international role of the euro remained stable in 2021. Over this period, the euro area and other major economies recovered from the COVID-19 pandemic recession. The euro area experienced one of the steepest recoveries in its history, bolstered by ample fiscal and monetary policy support, in an environment of rising global inflation driven by higher energy costs, supply bottlenecks and the normalisation of demand as economies reopen. On balance, these developments did not result in a significant change in the international role of the euro.
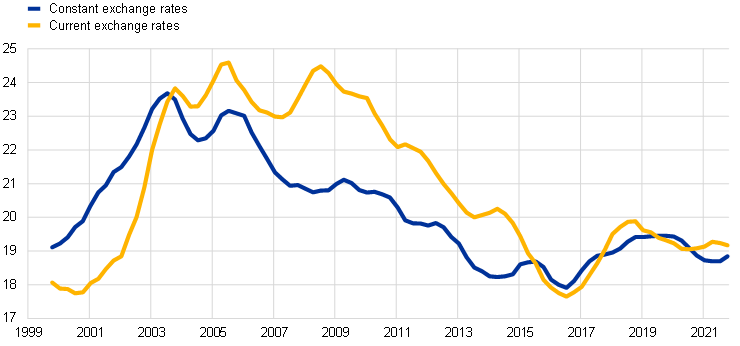
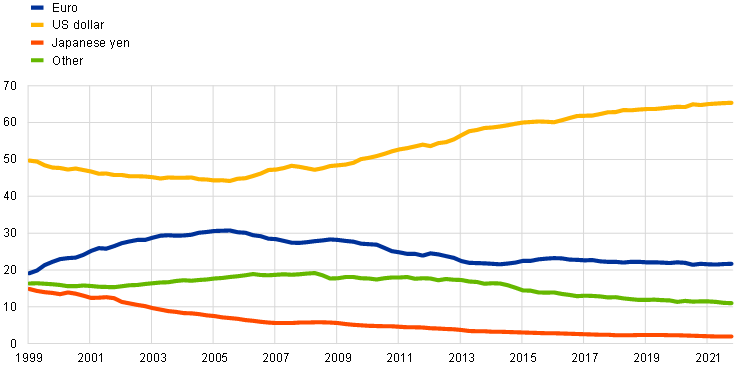
A composite index of the euro’s international role remained stable over the review period (Chart 1). Adjusting for exchange rate valuation effects, the index remained unchanged. At current exchange rates, it increased marginally by 0.1 percentage points. The share of the euro across various indicators of international currency use remained close to historical lows, averaging around 19%. The euro remained the second most important currency in the international monetary system (Chart 2).
Chart 1
The international role of the euro remained stable in 2021
Composite index of the international role of the euro
(percentages; at current and Q4 2021 exchange rates; four-quarter moving averages)
Sources: Bank for International Settlements (BIS), International Monetary Fund (IMF), CLS Bank International, Ilzetzki, Reinhart and Rogoff (2019) and ECB calculations.
Notes: Arithmetic average of the shares of the euro at constant (current) exchange rates in stocks of international bonds, loans by banks outside the euro area to borrowers outside the euro area, deposits with banks outside the euro area from creditors outside the euro area, global foreign exchange settlements, global foreign exchange reserves and global exchange rate regimes.
The estimates for the share of the euro in global exchange rate regimes are based on IMF data for the period post-2010; pre-2010 shares were estimated using data from Ilzetzki, E., Reinhart, C. and Rogoff, K. (2019), “Exchange Arrangements Entering the 21st Century: which anchor will hold?”, Quarterly Journal of Economics, Vol. 134, Issue 2, May, pp. 599‑646.
The latest observations are for the fourth quarter of 2021.
Chart 2
The euro remained the second most important currency in the international monetary system
Snapshot of the international monetary system
(percentages)

Sources: BIS, IMF, Society for Worldwide Interbank Financial Telecommunication (SWIFT) and ECB calculations.
Notes: The latest data for foreign exchange reserves, international debt and international loans are for the fourth quarter of 2021. Foreign exchange turnover data as of April 2019. SWIFT data as of December 2021.
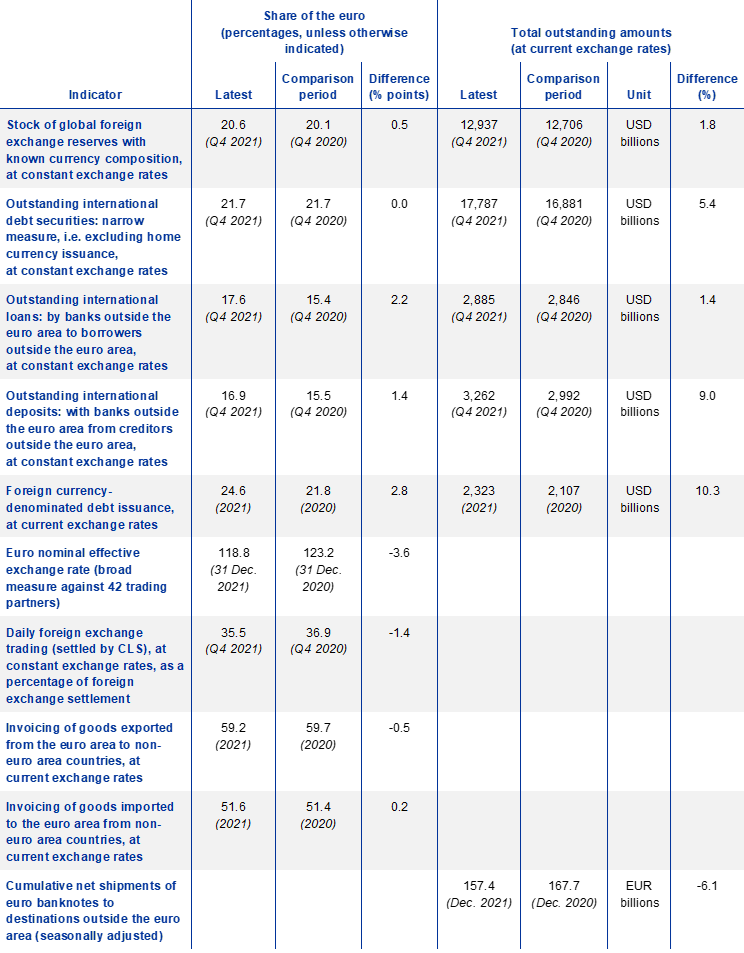
The share of the euro in global official holdings of foreign exchange reserves increased by 0.5 percentage points to 20.6%, when measured at constant exchange rates (Table 1). Foreign official investors increased their euro-denominated reserves, although evidence from surveys suggests that low yields continued to be one of the primary concerns affecting their investment strategies in 2021. However, additional survey-based evidence suggests that the sentiment of official reserve managers towards the euro might have improved in the course of the past year.
The share of the euro increased markedly in international bond issuance, in outstanding international loans and in outstanding international deposits. The share of the euro in international bond issuance increased by almost 3 percentage points, from 21.8% in 2020 to 24.6% in 2021. The increase in euro-denominated bond issuance was broad-based across borrower residence. It was driven especially by strong issuance by financial and other services firms. The share of the euro in the outstanding stock of international loans increased by over 2 percentage points to 17.6% between 2020 and 2021, while the share of the euro in the outstanding stock of international deposits rose by over 1 percentage point to almost 17% over the same period, in an environment characterised by the ECB’s accommodative monetary policy stance.
Other indicators of the international role of the euro suggest that the global attractiveness of the euro remained stable overall over the review period. These indicators include the share of the euro in the outstanding stock of international debt securities, which remained unchanged, while the share of the euro in invoicing of both extra-euro imports and exports changed in absolute terms by half a percentage point or less.
International issuance of green bonds denominated in euro almost doubled in volume to €41 billion in 2021. However, the share of the euro in this market segment declined by 5 percentage points, to around 30%, amid strong issuance of green bonds denominated in the US dollar and other currencies. The share of the euro in foreign exchange settlements at constant exchange rates declined by 1.4 percentage points, to about 36%.[1] Finally, net shipments of banknotes also declined significantly in 2021, by around 6 percentage points, possibly reflecting, inter alia, the lingering effects of the pandemic on tourism and migrant workers’ remittances.
The Council of the European Union (EU) stressed, in its conclusions adopted on 5 April 2022, that a stronger international role of the euro, including through the strengthening and deepening of Economic and Monetary Union (EMU), is one of the key pillars of the EU’s strategy to achieve economic and financial strategic autonomy in an open economy.[2]
The policy implications stressed by the Eurosystem in the past remain fully valid. The international role of the euro is primarily supported by a deeper and more complete EMU, including advancing the capital markets union, in the context of the pursuit of sound economic policies in the euro area. The Eurosystem supports these policies and emphasises the need for further efforts to complete EMU.
This year’s interim edition of the report includes five analytical boxes. Box 1 discusses the implications of the Russian invasion of Ukraine and of the financial sanctions imposed on Russia for the prospective global roles of the euro and the US dollar. First, it has been argued that the sanctions might accelerate the erosion of the US dollar as a global reserve currency, that it could provide a fillip to official reserve managers seeking to bypass the US dollar and the euro in the international monetary and financial system, and that international payment systems could become more segmented. However, the implications of these developments remain uncertain. Recent research suggests that the direction of causality between reserve management decisions and other international currency uses matters. Shifts in the currency composition of global reserve portfolios per se might not necessarily herald broader changes. Second, the role of the US dollar in all dimensions of international currency use besides foreign reserves has remained stable – or even increased – in the past two decades. Third, alternatives to major international currencies often lack the depth, liquidity or other economic and financial attributes required to appeal to global investors. In particular, China cannot diversify its very large foreign exchange reserve holdings of more than USD 3 trillion – or about one-quarter of global foreign exchange reserves – in its own domestic currency, which limits the potential upside for a stronger international role for the renminbi. Finally, the Russian invasion of Ukraine might serve as a reminder of the relevance of sound institutions, the ability to maintain price stability over the medium term, and geopolitical considerations as determinants of international currency status.
Box 2 reviews recent developments in the international role of the Chinese renminbi, which remains more limited than the global economic and financial importance of China. However, several recent developments might herald signs of a potential turnaround in the international role of the renminbi. These include progress in developing a digital yuan, which might be used at some point for payments in cross-border trade with China, the inclusion of Chinese bonds in major global bond benchmarks, and the possibility that the Russian invasion of Ukraine could benefit the renminbi as a global reserve and payment currency. However, several factors continue to weigh on the global appeal of the renminbi, such as the incomplete openness of China’s capital and financial account (particularly for outflows) and the lack of full flexibility of the renminbi exchange rate.
Box 3 provides insights into the international use of the euro as a financing currency across different economic sectors and the trends over time using new international locational banking statistics from the BIS. The box shows that euro-denominated international loans to non-bank financial institutions (NBFIs) have grown rapidly in recent years, and that the euro is particularly important as a financing currency for this segment of the international loan market. Given that non-banks are expected to play an increasingly strong role in the global financial system in the future, these developments might contribute to bolstering the global appeal of the euro as a financing currency in the period ahead.
Box 4 examines the interplay between the exchange rate elasticities of euro area external trade and the role of the euro as an invoicing currency. Using panel local projections on monthly bilateral data, the box shows that higher euro invoicing shares are related to a stronger response of export volumes and weaker reactions of external trade prices to exchange rate movements in the short to medium term. Thus, in the presence of strong exchange rate movements, euro invoicing plays a key role in altering the impact of these movements on external trade export volumes and prices.
Finally, Box 5 examines the role of the euro in the global market for stablecoins, which are digital assets designed to minimise price volatility, typically pegged against a single fiat currency (or a basket of fiat currencies). At 0.2%, the share of the euro in this market is extremely small, given that almost all stablecoins are linked to the US dollar – i.e. 99% of the market capitalisation (equal to USD 160 billion in 2021). ECB staff empirical estimates on the first euro-based stablecoin ever issued (Stasis euro) suggest that it does not provide holders with a hedge against financial market volatility, given that its value declines in periods of global financial market stress. Further evidence suggests that transactions in stablecoins are largely driven by transactions in other crypto-assets. This suggests that stablecoins are not viewed as a new safe financial asset class that investors would arbitrage against other asset classes, but as vehicles for transactions in more volatile crypto-assets. Potential risks triggered by more widespread stablecoin adoption can be managed through the existing Eurosystem’s oversight framework that covers stablecoin arrangements that qualify as payment systems, regardless of the technology used. Moreover, the Eurosystem is reviewing its oversight framework for payment instruments and schemes with a view to broadening its scope. In particular, the issuance of stablecoins and provision of crypto-asset services in Europe will be regulated under the Markets in Crypto-Assets (MiCA) Regulation, which is currently at the negotiation stage.[3] These efforts are likely to be complemented by stronger international cooperation on the regulation of crypto-assets.
Table 1
The international role of the euro from different perspectives
Summary of data in this report
Sources: BIS, CLS Bank International, Dealogic, IMF, national sources and ECB calculations.
Notes: An increase in the euro nominal effective exchange rate indicates an appreciation of the euro. For foreign exchange trading, currency shares add up to 200% because transactions always involve two currencies.
Box 1
The Russian invasion of Ukraine and international currencies
The Russian invasion of Ukraine and financial sanctions imposed on Russia, such as the decisions to freeze about half of its official foreign reserves and to ban selected Russian banks from SWIFT,[4] have fuelled speculation about the implications of these developments for the prospective roles of the US dollar and the euro globally.
It has been argued that the recent sanctions might provide a fillip to countries seeking to bypass the US dollar and the euro in the international monetary and financial system.[5] Russia had already cut its US dollar exposures significantly after the seizure of Crimea and the introduction of international sanctions in 2014. Russia had diversified its official foreign reserve holdings of USD 630 billion away from the US dollar, had attempted to shift the currency denomination of its international payments and reduced domestic dollarisation. By mid-2021, gold exceeded the US dollar in Russia’s official foreign reserves – equating to 22% compared with 16% for the US dollar. The share of the renminbi, at 13%, was close to that of the US dollar, while euro-denominated assets accounted for the largest share (32%). Virtually all of Russia’s official holdings of US Treasuries have been liquidated.[6]
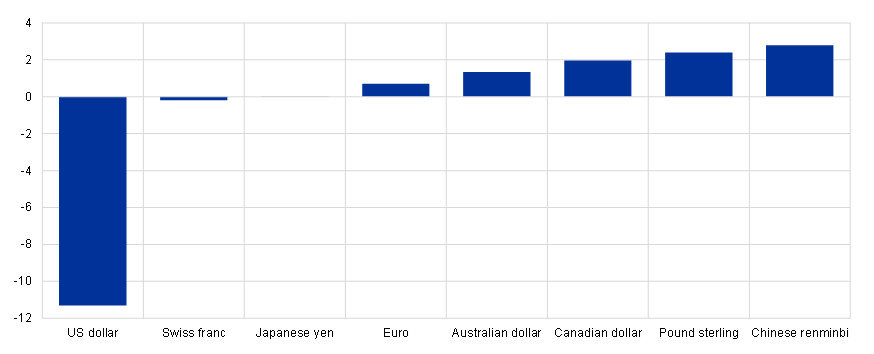
Following the latest sanctions, Russia and other countries may, it is alleged, diversify their portfolios further away from the US dollar and other traditional reserve currencies into other assets, such as the renminbi, gold and crypto-assets. They may try to find alternatives to SWIFT for international payments, such as China’s Cross-Border Interbank Payments System, which would bolster the renminbi’s global role. International payment systems could become more segmented. Russia has demanded that importers of Russian gas should no longer pay in dollars or euro, but in roubles. The Russian invasion of Ukraine is therefore seen as accelerating the “stealth erosion” of the US dollar’s role as a global reserve currency. Since the turn of the millennium, the share of the US dollar in global foreign exchange reserves has declined by more than 10 percentage points, mainly to the benefit other non-traditional reserve currencies, including the Chinese renminbi (see Chart A).[7]
However, the implications of these developments on the global appeal of the major international currencies remain unclear.
First, the direction of causality between reserve management decisions and other international currency uses matters. Recent research has pointed to the fact that the role of a currency in global trade and finance determines its importance in global foreign exchange reserves.[8] There are strong complementarities between the various functions of international currencies, but causality flows primarily in one direction. Therefore, unless more significant changes to international payments or debt issuance patterns occur, shifts in the currency composition of global reserve portfolios might not necessarily herald broader changes in other dimensions of international currency use.[9]
Second, although the share of the US dollar as a global reserve currency has declined, in other dimensions of international currency use, it has remained stable, such as in global foreign exchange turnover and for the invoicing of global trade, or it has increased significantly, such as in international bond issuance.
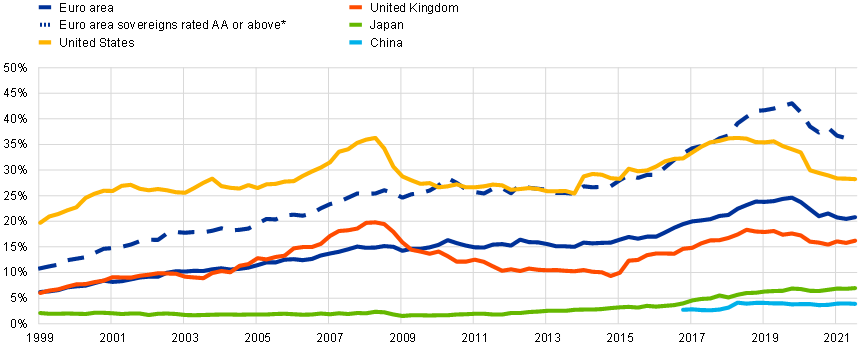
Third, alternatives to major international currencies often lack the depth, liquidity or other economic and financial attributes required to appeal to global investors. At more than USD 23 trillion, the US Treasury market remains deeper and more liquid than markets in any other safe assets, including the euro government debt market, which is still fragmented among different issuers.[10] China’s government debt market in renminbi, at more than USD 7 trillion, might offer an alternative to US Treasuries in the medium term. The share of the renminbi in global official foreign exchange reserves has more than doubled since 2016 to almost 3% in 2021. However, despite recent measures to lift restrictions, access to renminbi-denominated bonds and bank deposits for foreign official investors is not fully liberalised. The rebalancing of global official foreign exchange reserves away from the US dollar in the past two decades has mostly benefited currencies more easily traded than the renminbi (see Chart A).[11] Foreign official investors hold between one-fifth and one-third of the stock of general government debt issued by the United States, the euro area or the United Kingdom, but less than 5% of the stock issued by China (see Chart B). About a quarter of the USD 12 trillion in global official foreign exchange reserves are held by China and cannot be diversified into renminbi. Gold may not be a more attractive alternative for official reserve managers seeking to diversify away from the US dollar or the euro, being neither remunerated nor usable for international payments; it is also subject to physical storage costs. Rebalancing portfolio holdings into crypto-assets is challenging, too. Some of the crypto-assets, such as bitcoin, are supplied in fixed quantities, have highly volatile prices and behave similarly to risky speculative assets. This makes them unappealing to official reserve managers. Stablecoins might be more attractive in the future. However, at least so far, they may lack guarantees in terms of redeemability – if issuers are able to lock tokens in the wallets of holders – and the required scale, with a market capitalisation of just USD 185 billion in 2021 – only 1% of global foreign exchange reserve holdings. Most stablecoins are pegged to the US dollar, which suggests that complementarities between the various uses of international currencies benefit the incumbent unit – the US dollar.[12] In addition, financial supervisors are increasingly scrutinising market transactions to identify those that might be conducted with a view to evading financial sanctions, and encourage crypto exchanges to remain mindful of reputational risk.
Chart A
The decline of the role of the US dollar in global foreign exchange reserves
Change in the share of selected currencies in global official holdings of foreign exchange reserves since 1999
(percentage points, at constant Q4 2021 exchange rates)
Sources: IMF and ECB calculations.
Notes: The change in the share of the renminbi is estimated using data available since 2016; the change in the shares of the Australian and Canadian dollars are estimated using data available since 2012. The latest observation is for the fourth quarter of 2021.
Finally, the Russian invasion of Ukraine might serve as a reminder of the relevance of sound institutions, macroeconomic fundamentals, including price stability over the medium term, and geopolitical considerations as determinants of international currency status. Research suggests that, since the early nineteenth century, the leading international currency or currencies have been those of countries where the rule of law is respected, which emphasise checks and balances, build durable international alliances, and where creditors are well represented.[13] Moreover, research also stresses that the choice of international reserve currencies depends on broad strategic and geopolitical considerations. In particular, one study found that military alliances boost the share of a currency in the partner’s foreign reserve holdings by about 30 percentage points.[14]
Overall, time will tell whether more significant changes in the international role of currencies will unfold. What is possible, however, is that the Russian invasion of Ukraine might have acted as a catalyst in related domains. For instance, some countries have accelerated plans to explore central bank digital currencies (CBDC) in the wake of the invasion, which may have implications for the global appeal of major currencies.[15]
Chart B
Share of foreign official investors in government debt: high for the US dollar and the euro, low for the Chinese renminbi
Share of foreign official holdings of outstanding general government debt
(percentages)
Sources: BIS, IMF and ECB calculations.
Notes: * Euro area sovereigns rated AA or above include Belgium, Germany, France, Luxembourg, the Netherlands, Austria and Finland. The latest observation is for September 2021.
2 Key developments
2.1 Use of the euro as an international reserve and investment currency
The share of the euro in global official holdings of foreign exchange reserves increased slightly in 2021. The share of the euro in global official holdings of foreign exchange reserves stood at 20.6% at the end of 2021, rising by 0.5 percentage points compared with the previous year, when measured at constant exchange rates. By contrast, the share of the euro declined by 0.6 percentage points at current exchange rates as a result of the depreciation of the euro exchange rate against the US dollar by around 8 percentage points over the review period (Charts 3 and 5). The share of the US dollar – the major global reserve currency – remained broadly stable, at around 59%, when measured at current exchange rates. Over the review period, the share of the US dollar declined by about 1.5 percentage points at constant exchange rates. Over the past seven years, the share of the euro in global official holdings of foreign exchange reserves continued to remain broadly stable, hovering around a relatively narrow range.
Chart 3
The share of the euro in global foreign exchange reserves increased slightly in 2021
Shares of the euro, US dollar and other currencies in global official holdings of foreign exchange reserves
(percentages; at constant Q4 2021 exchange rates)
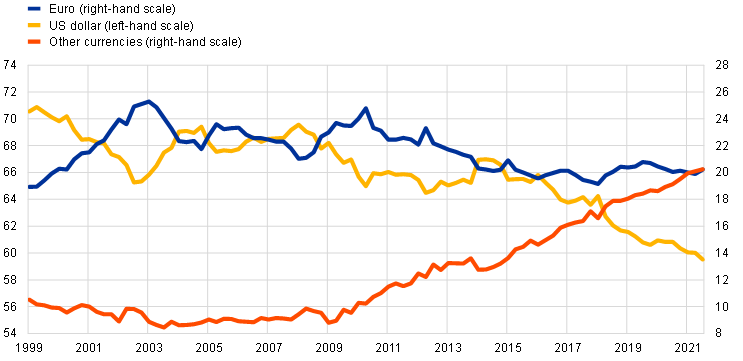
Sources: IMF and ECB calculations.
Note: The latest observation is for the fourth quarter of 2021.
Foreign official investors accumulated euro-denominated reserves despite the low interest rates prevailing in the euro area compared with other major economies. Purchases of euro-denominated reserves by official investors are estimated to have topped USD 150 billion during the review period compared with almost USD 100 billion for purchases of US dollar assets.[16] Interest rates and fixed- income yields in the euro area were negative in the review period, hovering around -0.5%, between 0.6 and 1.3 percentage points lower than in the United States, depending on the maturity considered (Chart 4). Indeed, as in previous years, lower and negative yields in euro area fixed-income markets might have been one of the main factors moderating the global appeal of the euro as a reserve currency. According to a regular survey conducted by the investment bank UBS,[17] around 86% of respondents cited this as one of the primary concerns for their investment strategy, this percentage having risen from around 70% in 2020. However, the survey indicates that sentiment among official reserve managers towards the euro might have improved, given that one-third of respondents indicated that they were planning to increase their portfolio allocation towards the euro.
Chart 4
Interest rates in the euro area were still in negative territory in 2021
Five-year and one-month interest rate in the major economies in 2021
(percentages)
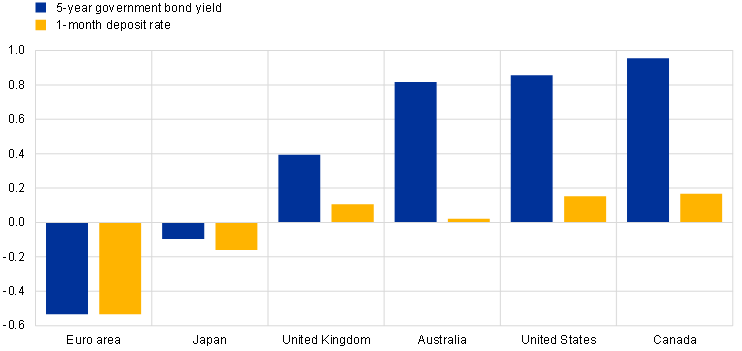
Sources: Refinitiv Datastream, BIS and ECB calculations.
Note: The five-year government yield for the euro area is calculated as a debt-weighted average of five-year euro area yields of sovereigns with a Standard and Poor’s credit rating of at least AA.
Official reserve managers continued to diversify their portfolios in 2021 towards non-traditional reserve currencies, particularly the Chinese renminbi. At constant exchange rates, the share of currencies other than the euro and the US dollar increased by 1 percentage point over the review period (Chart 3). The share of official reserve assets denominated in Chinese renminbi increased by 0.4 percentage points to 2.8% of global reserves, rising at a similar pace to the previous year. Net purchases of renminbi by official investors amounted to an estimated USD 60 billion in the review period (see Box 2 for a review of the internationalisation of the Chinese renminbi). The share of the Canadian dollar rose by around 0.3 percentage points. The share of other major reserve currencies remained broadly stable (Chart 5).
Chart 5
Official reserve managers continued to diversify towards non-traditional reserve currencies
Change in the share of selected currencies in global official holdings of foreign exchange reserves
(percentage points; at current and constant Q4 2021 exchange rates)
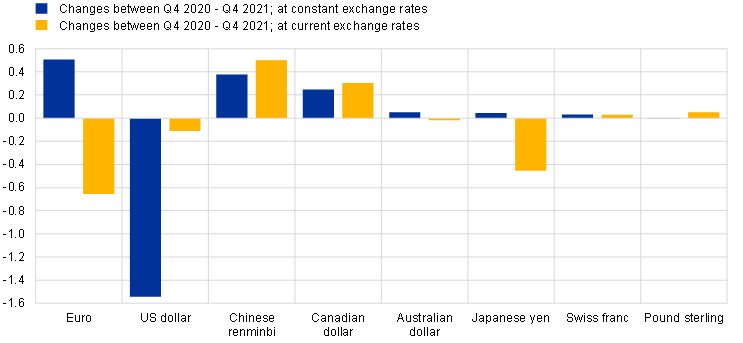
Sources: IMF and ECB calculations.
Note: The latest observation is for the fourth quarter of 2021.
Box 2
The internationalisation of the renminbi: regaining strength?
Notwithstanding earlier predictions that the renminbi would dethrone the US dollar as the leading international currency, the global role of the renminbi remains more limited than the shares of China in global trade and output.[18] In 2021 China accounted for 19% of global output, whereas the share of the renminbi in various measures of international use was much lower (see Chart A).
Several recent developments, however, might herald signs of a potential turnaround in the international role of the renminbi. First, China has made rapid progress in the development of a digital yuan which, if allowed to be used across borders, could support the international role of the renminbi. In January 2022 China launched a large retail central bank digital currency pilot project to enable domestic residents and foreign visitors to the Winter Olympics in February 2022 to use the digital yuan, with some restrictions. Take-up by foreigners during the Winter Olympics was limited. However, the digital yuan may still be used at some point in the future to settle a share of Chinese imports and exports, for example in the context of the Belt and Road Initiative, thereby supporting the global status of the Chinese renminbi.[19]
Another relevant development pointing to an increase in the international appeal of the renminbi was the inclusion of Chinese bonds in major global bond benchmarks.[20] In line with evidence for other emerging markets in the past, this development led to an increase in foreign ownership of Chinese domestic government bonds, especially among US and euro area private sector investors.[21] For example, fixed-income funds domiciled in and operating outside the United States increased their exposures to assets denominated in renminbi from close to zero in 2017 to over 5% of total assets in 2021.[22] A further factor that may potentially support the international role of the renminbi is the resilience of the net capital flows to China – especially inflows – which remained positive in the past years. In particular, net bond inflows amounted to USD 147 billion in 2020 and USD 53 billion in 2021, despite the COVID-19 pandemic.
Finally, according to some observers, the recent Russian invasion of Ukraine and the financial sanctions imposed on Russia could accelerate a rebalancing of global reserve portfolios and payments away from the US dollar and the euro towards the renminbi (see Box 1 in this report).
Based on the evidence to date, the share of the renminbi as a reserve currency has increased in the recent years, but remains modest compared with other major currencies, at around 2.8% of global official foreign exchange reserves in 2021 (see Chart A(a)). Since 2020, the countries with the largest share of official foreign exchange reserves in renminbi have included Russia (17%) and Tanzania (16%).[23] Use of the renminbi as an international financing currency remains limited; renminbi-denominated bonds account for less than 1% of the total issuance of international bonds. Use of the renminbi for international loans, i.e. by lenders resident outside China, is negligible (see Chart A(a)). However, cross-border lending by Chinese institutions has grown significantly. Based on available data up to 2017, China has become the world's largest official creditor, ahead of the World Bank and the IMF.[24] In the period 2000-2017, the average share of the renminbi in China’s official lending was 11%. The renminbi share is usually higher in Asia and Africa (see Chart B) and when loans are provided on concessional terms, through a government agency, with a developmental or representational intent.[25]
In terms of cross-border payments, SWIFT data point to a pickup in the share of the renminbi to above 2% in 2021 (see Chart A(a)). In December 2021 the renminbi exceeded the Japanese yen as a global payment currency by value, becoming the fourth most active unit, behind the US dollar, the euro and the pound sterling. Use of China’s cross-border interbank payment system (CIPS), which the People’s Bank of China launched in 2015, has increased steadily. Average daily transactions have surged from RMB 8 billion in value in 2015 to RMB 334 billion in 2021. The volume of transactions in CIPS remains roughly 1% of the volume of global payments handled by the SWIFT system, but it might rise further following the imposition of sanctions on Russia, such as the ban of some Russian banks from SWIFT. Use of the renminbi for invoicing imports and exports has also increased, although it remains at low levels (see Chart A(b)). Research suggests that renminbi invoicing has been supported by the establishment of currency swap lines by the People’s Bank of China and other central banks.[26] Finally, more recently, following stable demand for yuan-denominated oil futures contracts, initially launched in 2018, China launched yuan-denominated energy options contracts open to foreigners.
Various factors might have hindered further progress in the international use of the renminbi. For instance, research suggests that geopolitical tensions, particularly China’s trade disputes with the United States, might have been one such factor.[27] Incomplete openness of China’s capital and financial account (particularly for capital outflows), capital controls and the lack of full exchange rate flexibility are other factors believed to impair the internationalisation of the renminbi.[28] The recent slight increase in the weighting of the renminbi as part of the revision of the Special Drawing Rights (SDRs) basket, which will come into effect in August 2022, may support the global profile of the renminbi.[29] However, a clear-cut impact of the inclusion of the renminbi in the SDR basket in 2016 on the international role of the Chinese currency is not visible so far.
Chart A
Evidence of an increase in the global role of the renminbi from a low level
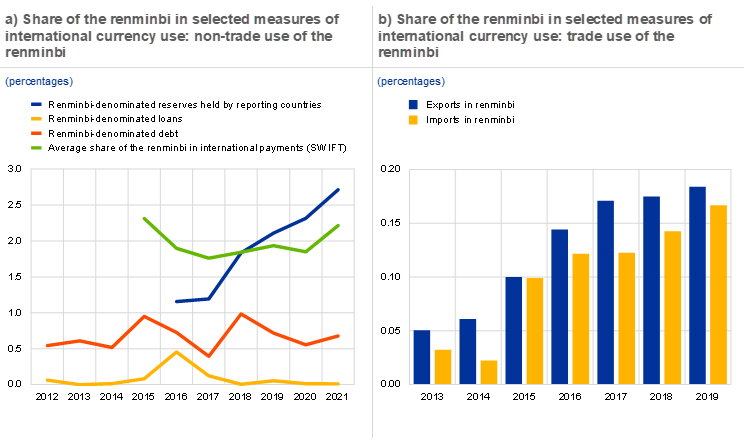
Sources: Dealogic, Haver Analytics, IMF, People’s Bank of China, SWIFT, Boz et al., op. cit. and ECB calculations.
Note: Exports and imports in renminbi are constructed as the weighted average of global trade invoiced in renminbi.
The latest observations are for 2021 (left panel) and 2019 (right panel).
Chart B
China’s official lending in renminbi is more significant in some parts of Asia and Africa
Share of the renminbi in China’s official lending between 2000 and 2017
(percentages)
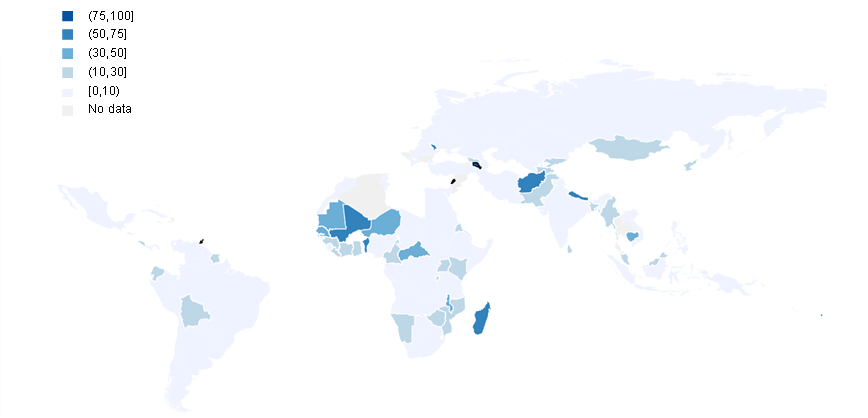
Sources: AidData and ECB calculations.
2.2 The euro in global foreign exchange markets
While the euro remains the second most actively traded currency in global foreign exchange markets after the US dollar,[30] its share in global foreign exchange settlements declined in 2021. According to quantity-based evidence on foreign exchange transactions settled in the CLS system, the share of the euro in foreign exchange settlements stood at 35.5% in the fourth quarter of 2021 (see Chart 6(a)), reflecting a noticeable decrease of almost 1.4 percentage points compared with the previous year when measured at constant exchange rates.[31] The decline in the share of the US dollar was similar at around 1.4 percentage points. However, the US dollar remains the leading currency in the foreign exchange market by a wide margin, as it was involved in just over 90% of all settlements in the fourth quarter of 2021.[32] Volumes of euro settlements increased by over 1.4% in the fourth quarter of 2021 compared with the previous year, extending the trend of the past decade (Chart 6(b)).
Chart 6
The share of the euro in global foreign exchange settlements declined in 2021
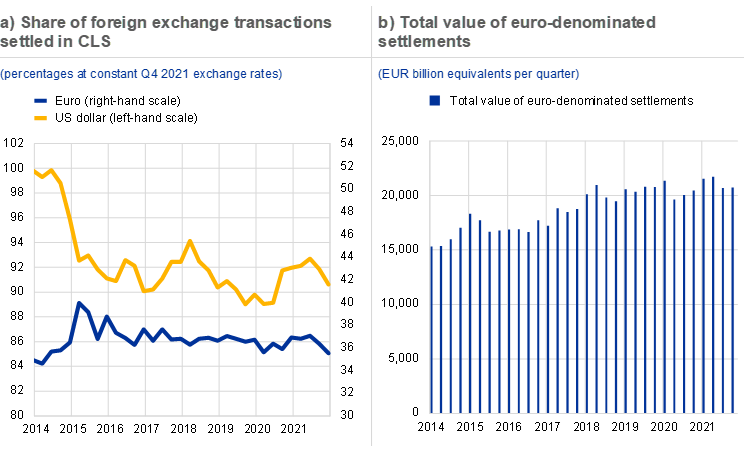
Sources: CLS Bank International and ECB calculations.
Note: The latest observation is for the fourth quarter of 2021.
2.3 Use of the euro in international debt and loan markets
2.3.1 The euro in international debt markets
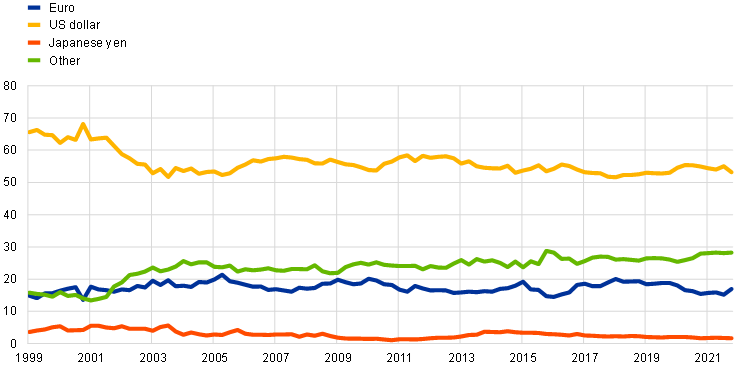
The share of the euro in the stock of international debt securities remained stable in 2021 at around 21.7% at constant exchange rates.[33] As such, the share of the euro has remained over 9 percentage points lower than at the peak of the mid-2000s. By contrast, the share of the US dollar has continued to increase gradually, by 0.6 percentage points, confirming the upward trend of recent years. The US dollar has consolidated its dominant role as an international financing currency, given that it now accounts for more than 65% of the stock of international debt securities (see Chart 7 and Table A4).
Chart 7
The share of the euro in the stock of international debt securities remained stable in 2021
Currency composition of outstanding international debt securities
(percentages; at constant Q4 2021 exchange rates)
Sources: BIS and ECB calculations.
Notes: Narrow measure. The latest observation is for the fourth quarter of 2021.
Granular data on international issuance of foreign currency-denominated bonds suggest that the volume of international bond issuance rose markedly in 2021, with euro-denominated securities accounting for an increasing share of issuance.[34] In 2021 the total volume of foreign-currency denominated bond issuance increased by 10% to more than USD 2.3 trillion. This increase occurred amid strong bond issuance globally, driven by the global economic recovery from earlier disruptions caused by the pandemic, and ample fiscal and monetary policy support in major economies. Issuance of euro-denominated bonds increased by 24% to USD 571 billion in 2021 compared with the previous year. The share of the euro in international bond issuance increased by almost 3 percentage points to 24.6% in 2021. Issuance of US dollar-denominated bonds slowed, increasing by just over 2.5% to USD 1,453 billion in 2021 (see Chart 8(a)).[35] The share of the US dollar decreased by almost 5 percentage points in 2021. However, the US dollar remained by far the leading currency for international issuance of foreign currency-denominated bonds, accounting for more than 60% of total issuance in the review period (see Chart 8(b)).[36]
Chart 8
The share of the euro in international issuance of foreign currency-denominated bonds increased in 2021

Sources: Dealogic and ECB calculations.
Note: The latest observation is for end-2021.
The increase in euro-denominated international bond issuance was broad-based, with issuance from borrowers resident in the United Kingdom being particularly dynamic, where it increased by 77% in 2021, and in emerging market economies, where it increased by 53% compared with the previous year. As a result, residents of the United Kingdom are now the largest issuers of euro-denominated international bonds, ahead of US residents (see Chart 9(b)). These developments suggest that London currently continues to play an important role as a centre for intermediation of euro-denominated funding despite Brexit.[37] Emerging market economies remained the largest issuers of international US dollar-denominated bonds (see Chart 9(a)), although issuance by these borrowers decreased by 5% over the review period. However, emerging market issuance of foreign-currency bonds remained more resilient than domestic currency-denominated issuance due to the loose global financial conditions and robust global risk appetite that prevailed throughout most of the pandemic period.[38]
Chart 9
Emerging market borrowers still the largest issuers of US dollar-denominated international bonds in 2021, while borrowers resident in the United Kingdom became the largest issuers of euro-denominated bonds outside the euro area
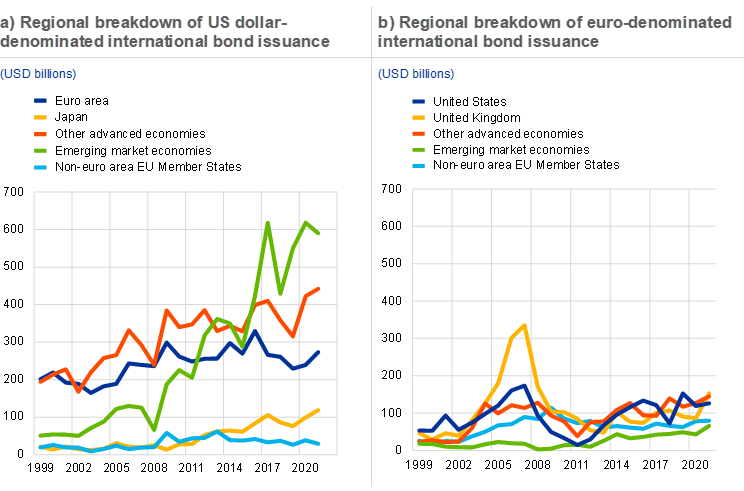
Sources: Dealogic and ECB calculations.
Note: The latest observation is for end-2021.
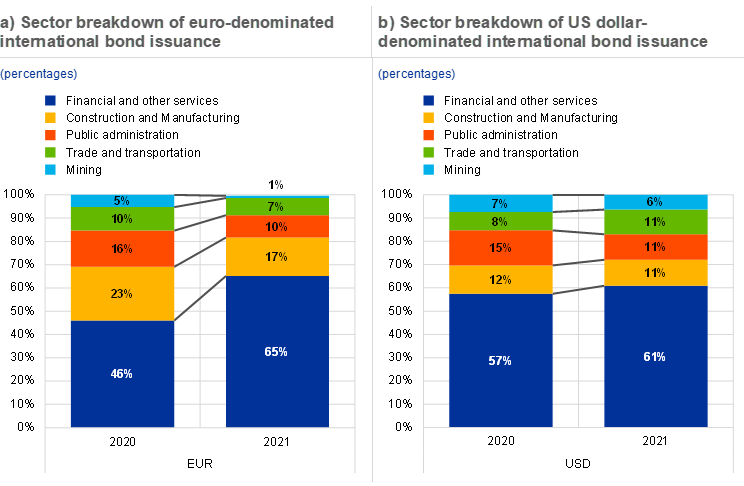
Looking at developments across sectors, the share of financial and other services firms in international issuance of euro-denominated bonds rose considerably, rising by 19 percentage points from 46% in 2020 to 65% in 2021 (see Chart 10(a)).[39] This increase may reflect the greater disruption to services-based firms caused by the pandemic.[40] By contrast, all other sectors saw a decrease in their share of euro-denominated bond issuance, with the construction and manufacturing sectors experiencing the largest declines of around 6 percentage points, perhaps reflecting the more limited impact of pandemic-induced lockdowns on these sectors. A broadly similar, albeit less pronounced, pattern can be observed for US dollar-denominated international bond issuance, with the share of financial and other services firms increasing by approximately 4 percentage points, while the share of public administration borrowers recorded a similar decline(see Chart 10(b)).
Chart 10
The financial and other services sector accounted for a larger share of issuance of euro-denominated bonds in 2021
Sources: Dealogic and ECB calculations.
The growth of global issuance of green bonds accelerated in 2021. It reached close to USD 500 billion in 2021 (€420 billion), more than double the total volume of issuance of the previous year (see Chart 11(a)). This expansion was supported by various factors, such as greater investor focus on environmental issues, and an increasing willingness on the part of borrowers to adapt their business practices and funding strategies to environmental considerations. Sustainable finance was also supported by the 2021 United Nations Climate Change Conference (COP26) and announcements of country goals for energy consumption and transition to a net-zero economy.[41]
The Next Generation EU (NGEU) stimulus package also helped to sustain the expansion of the green bond market and, indirectly, the role of the euro in this market. In October 2021 the European Commission issued a €12 billion green bond, the largest ever issuance in this specific market segment. While most of the initial investors were domiciled in the EU, more than one-third came from outside the euro area, in particular the United Kingdom (see Chart 11(b)).[42] The European Commission plans to issue up to €250 billion in green bonds as part of the NGEU bond programme to become the largest issuer of green bonds globally. Announcements by several central banks of their increasing awareness of climate change implications for the conduct of monetary and financial stability policies have been mentioned as a factor that might affect demand for green bonds.[43] The ECB’s monetary policy strategy review included a commitment to consider climate change in monetary policy operations in the areas of disclosure, risk assessment, collateral frameworks and corporate sector asset purchases.[44]
Chart 11
Global issuance of green bonds increased rapidly in 2021, including public issues such as green NGEU bonds
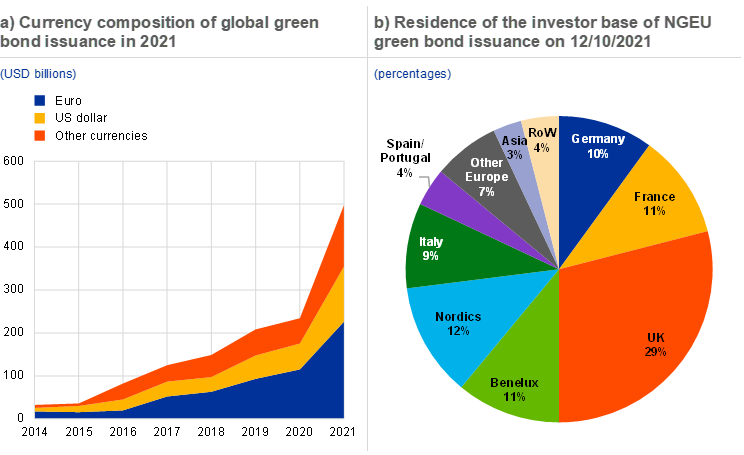
Sources: Dealogic, European Commission and ECB calculations.
Notes: The left panel shows annual totals based on aggregation of individual deals; the latest observation is as of end-2021. The right panel shows data on green NGEU bonds issued on 12 October 2021.
International issuance of green bonds has also increased markedly over the past five years.[45] In absolute terms, the amount of international green bonds issued in major currencies has increased steadily since 2016 and accelerated in the course of 2021 (see Chart 12(a)). International green bond issuance denominated in euro increased from USD 26 billion (€23 billion) in 2020 to USD 48 billion (€41 billion) in 2021, while US dollar-denominated issuance increased from USD 35 billion to USD 80 billion. The share of euro-denominated green bonds declined by about 5 percentage points in 2021, whereas the share of the US dollar increased by 2 percentage points (see Chart 12(b)). This development is partly due to the sharp increase in green bond issuance in emerging markets, which have primarily been denominated in US dollars, this being consistent with emerging market bond issuance more generally.
Chart 12
Euro-denominated international green bond issuance almost doubled in volume in 2021, even though the share of the euro in total issuance declined

Sources: Dealogic and ECB calculations.
Notes: Annual totals based on the aggregation of individual deals. The latest observation is for end-2021.
2.3.2 The euro in international loan and deposit markets
The share of the euro in the outstanding stock of international loans continued to increase in 2021. At constant exchange rates, it rose by over 2 percentage points over the review period (see Chart 13 and Table A6).[46] However, at below 18%, the share of the euro remains 4 percentage points below the peak of almost 22% reached in 2005. Having declined continuously since 2016, the share of the US dollar in international loan markets stabilised compared with the previous year. However, the US dollar remained the leading currency in international loan markets by a large margin, accounting for about 55% of total loans.
Chart 13
The share of the euro in outstanding international loans increased in 2021
Currency composition of outstanding amounts of international loans
(percentages; at constant Q4 2021 exchange rates)

Sources: BIS and ECB calculations.
Notes: The latest observation is for the fourth quarter of 2021. International loans are defined as loans by banks outside the currency area to borrowers outside the currency area.
The ECB’s accommodative monetary policy stance continued to support the euro in international loan markets in 2021, with volumes of international loans denominated in euro increasing further. Volumes of euro-denominated loans by banks outside the euro area to non-euro area borrowers increased by around 8% in the review period (see Chart 14). This expansion coincided with the ECB’s sustained accommodative monetary policy stance, which served to ease financing conditions in euro funding markets. The stock of euro-denominated loans is now almost twice as large as in 2016.
Chart 14
Volumes of international loans denominated in euro continued to increase in 2021
Amounts outstanding of international loans denominated in euro
(USD billions; at current exchange rates)

Sources: BIS and ECB calculations.
Note: The latest observation is for the fourth quarter of 2021.
The share of the euro in outstanding international deposits increased in 2021. There was a notable increase of 1.4 percentage points in the share of the euro over the review period, when measured at constant exchange rates, to stand at almost 17% (see Chart 15 and Table A7).[47] As noted last year, the rise of US dollar-denominated deposits was particularly pronounced in the first quarter of 2020 when the outbreak of the pandemic led to a dash for (US dollar) cash.[48] Although the share of the US dollar in the stock of international deposits declined by 1.7 percentage points in 2021, it remains close to the pre-pandemic levels, at around 53%.[49]
Chart 15
The share of the euro in outstanding international deposits increased in 2021
Currency composition of outstanding amounts of international deposits
(percentages; at constant Q4 2021 exchange rates)
Sources: BIS and ECB calculations.
Notes: The latest observation is for the fourth quarter of 2021. International deposits are defined as deposits with banks outside the currency area from creditors outside the currency area.
Box 3
New insights from sectoral developments in international loans
This box provides insight into the international use of the euro as a financing currency across economic sectors and the related trends. It uses BIS international locational banking statistics (LBSs), which include information on international loans.[51] The LBS statistics have been enhanced since the fourth quarter of 2013 to provide additional sectoral granularity and shed light on developments in financial linkages through internationally active banks. The box shows that euro-denominated international loans to non-bank financial institutions (NBFIs) have expanded in recent years and that the euro is an important financing currency in this segment of the international loan market.[52]
Chart A(a) combines data on euro-denominated international loans with information on the euro legacy currencies. It shows the remarkable growth in amounts outstanding of euro-denominated loans in the past four decades. This expansion was largely driven by loans to banks until the mid-2000s. However, loans to banks declined substantially during the global financial crisis and the European sovereign debt crisis. By contrast, loans to non-banks have remained relatively resilient and continued to rise in recent years. These developments have led to a marked increase in the share of non-banks, which now account for about one-half of total euro-denominated international loans.[53]
Chart A(b) shows the newly enhanced disaggregated data, which have been available since the fourth quarter of 2013. The data provide a breakdown of total euro-denominated international loans to non-banks into four sub-sectors, namely: NBFIs, corporates, government and households.[54] Most of the recent rise in euro-denominated international loans is attributable to NBFIs. Data on breakdowns by counterparty and country (not shown in the chart) reveal that this is primarily due to loans to NBFIs located in the United States and the United Kingdom.
Chart A
Growth in euro-denominated international bank loans driven by loans to non-bank financial institutions

Sources: BIS LBSs; BIS and ECB calculations.
Notes: Pre-1999 data based on euro legacy currencies. The number of reporting countries varies across quarters. In the right panel, the gap between the height of the area and the blue line represents the value of non-bank loans that are unallocated by sub-sector. The latest observation is for the fourth quarter of 2021. NBFI stands for non-bank financial institutions, CORP for non-financial corporates, GOVT for governments, HOUS for households and NBKS for non-banks.
Chart B(a) shows a currency breakdown of total international loans across different non-bank sub-sectors. For loans denominated in euro, the share is highest for NBFIs, standing at around 33%, while the shares of loans to other sub-sectors are 12% for households, 15% for corporates and 23% for general government. By contrast, the US dollar’s importance is strongest for loans to corporates.
Chart B(b) shows the persistent growth in the total volume of international loans to NBFIs in all currencies (see the light-blue line), while the share of the euro has remained relatively stable (see the dark-blue area). The share of loans to NBFIs (in all currencies) in total loans to non-banks has increased from just over 43% in 2014 to almost 57% in 2021. The relatively rapid growth of loans to NBFIs may have therefore supported the international role of the euro through composition effects.
Chart B
The large share of the euro in loans to non-bank financial institutions has supported its role in international loan markets through composition effects
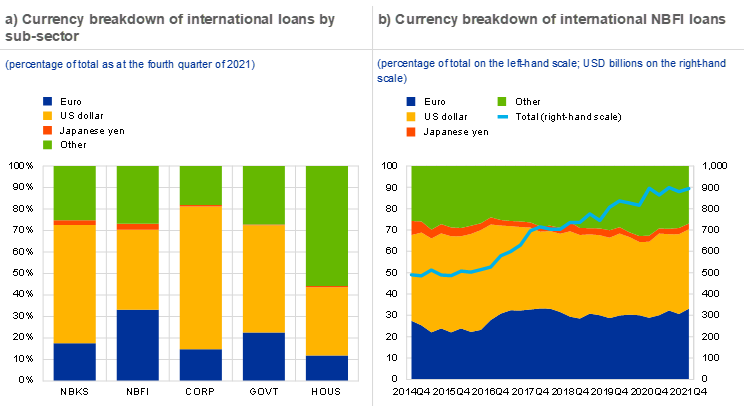
Sources: BIS LBSs; BIS and ECB calculations.
Note: The number of reporting countries varies across the respective quarters. The latest observation is for the fourth quarter of 2021. NBKS stands for non-banks, NBFI for non-bank financial institutions, CORP for non-financial corporates, GOVT for governments and HOUS for households.
Overall, the importance of euro-denominated loans in total bank claims to NBFIs has implications for policy. From a global financial stability perspective, exposures of NBFIs located outside the euro area to euro-denominated-loans is a potential channel of spillovers from developments in euro area liquidity to global financial markets and vice versa. Moreover, given that NBFIs are expected to play an increasingly important role in the global financial system, further development of the NBFI sector may support the global appeal of the euro as a financing currency going forward.[55]
2.4 Use of the euro as an invoicing currency
The share of the euro as an invoicing or settlement currency for extra-euro area trade declined slightly in 2021. Around 59% of extra-euro area exports of goods were invoiced in euro in 2021, half a percentage point less than in 2020. The share of extra-euro area imports of goods invoiced in euro remained broadly unchanged in 2021, at above 51% (see Chart 16(a) and Table A8). The relatively large share of euro invoicing in euro area exports and imports has significant implications for the pass-through of exchange rate changes to trade prices and volumes (see Box 4). Around 59% of extra-euro area services exports were invoiced in euro in 2021, down from around 62% in the previous year. Likewise, around 52% of extra-euro area imports of services were invoiced in euro in 2021, down from over 54% in the previous year (see Chart 16(b)).
Chart 16
The share of the euro as an invoicing currency of extra-euro area transactions declined slightly in 2021
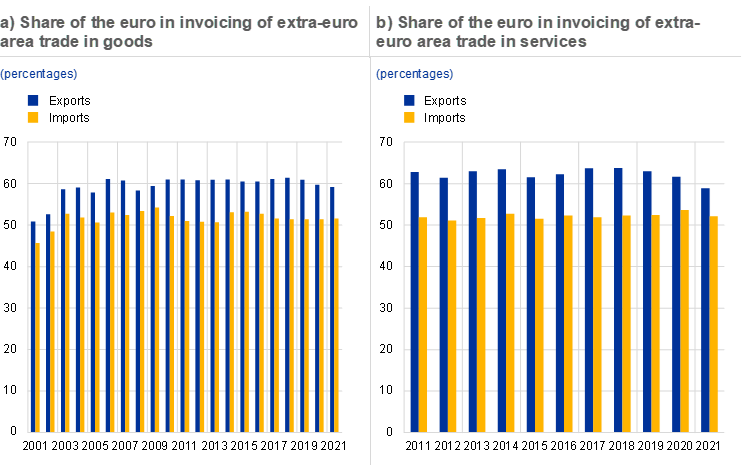
Sources: ECB, IMF direction of trade statistics (DOTS) and ECB calculations.
Note: The latest observation is for 2021.
Box 4
How important is invoicing currency choice for the impact of exchange rate fluctuations on trade?
The magnitude and speed of the trade impact of exchange rate changes is of significant importance for economic activity and inflation. This is especially the case for open economies such as the euro area. Yet, structural characteristics, such as firms’ choices of invoicing currency for international trade and their participation in global value chains (GVCs), may influence the pass-through of exchange rate changes to trade prices and volumes.
The choice of invoicing currency for international trade has consequences for exchange rate elasticities. For countries or regions with widely used currencies, such as the euro area or the United States, trade adjustments to exchange rate changes manifest themselves mainly in export volumes but only to a small extent in import volumes. This is because, if prices are settled in an international currency, e.g. the euro, exchange rate variations would immediately translate into changes in export prices faced by customers in their own domestic currency, driving demand for euro area exported goods and services. Conversely, many euro area import prices are sticky in euro terms in the short run, i.e. they do not change with the exchange rate. Invoicing in euro thus lowers the pass-through of exchange rate fluctuations to import prices, limiting the implications of exchange rate fluctuations for euro area demand for imports.[56] [57]
In this box, the dynamic reaction of trade prices and trade volumes to changes in the euro exchange rate is estimated on the basis of trade equations that consider structural factors, such as invoicing shares and GVC participation. In a sample of euro area bilateral trade with countries outside the euro area, panel local projections[58] are used to examine the historical correlations between exchange rate changes and trade prices (in unit values) and trade volumes over a two-year horizon. The estimated equations take into account and investigate the role of the trading partners’ invoicing shares and GVC participation by means of interaction terms.[59]
Higher trading partners’ euro invoicing shares are related to a stronger sensitivity of euro area export volumes and a lower sensitivity of trade prices to changes in the exchange rate. Chart A reports the estimated short-run (i.e. up to the first quarter, in Chart A(a)) and medium-run (i.e. up to two years, in Chart A(b)) elasticities of trade volumes and unit values, also accounting for the role of GVCs.[60] While euro area import volumes do not seem to react to exchange rate movements regardless of the share of euro invoicing,[61] export volumes rise more strongly following a euro depreciation when the share of exports denominated in euro is large with a partner country than they do when euro invoicing shares are low. As regards trade unit values, the higher the share of prices invoiced in euro, the less an exchange rate depreciation would affect prices, as shown in Chart A, where the unit values responses are nullified in the presence of high euro invoicing shares. These results are consistent with existing theoretical and empirical contributions.[62]
Chart A
Trade elasticities vis-à-vis the exchange rate and invoicing currency
a) Effect of a 1 percentage point euro depreciation – short term
(percentage points)
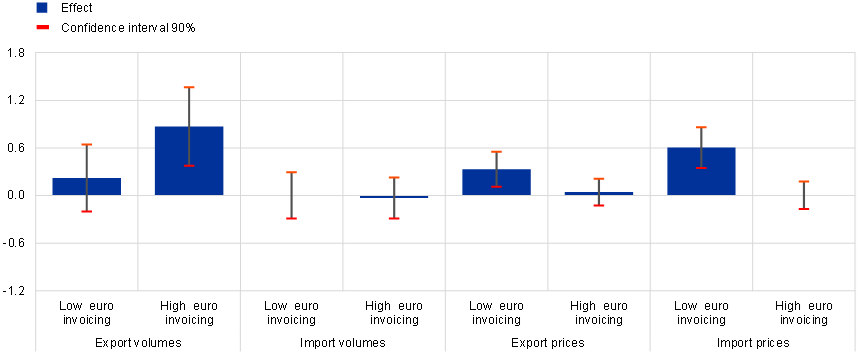
b) Effect of a 1 percentage point euro depreciation – medium term
(percentage points)

Sources: ECB, Eurostat, de Soyres et al., op. cit., Boz et al., op. cit., CPB Netherlands Bureau for Economic Policy Analysis, Bloomberg and ECB calculations.
Notes: The reported effects consider sample mean values of GVC indices. Import and export prices are unit values expressed in euro (trade values divided by trade volumes). The bars are the cumulative impulse response functions and the whiskers are 90 percent confidence intervals. Short term refers to the first quarter (3rd month) after the change. Medium term refers to two years after the change. Low and high euro invoicing correspond to the 25th and 75th percentile of the euro invoicing share distribution in the sample, namely to 5.8% and 55.9% for imports and 2.4% and 54.2% for exports.
In the event of strong exchange rate movements, invoicing thus plays a key role in terms of trade implications. Euro area export and import prices (and hence inflation) are partially shielded from large euro exchange rate movements when a sizeable share of trade flows is invoiced in euro. On the other hand, euro area export volumes respond more strongly, including in the short-to-medium term, when exports are invoiced in euro.
2.5 Use of euro cash outside the euro area
Foreign demand for euro cash outside the euro area decreased significantly in 2021, possibly due to the lingering effects of the pandemic on tourism and remittances. Net registered shipments of euro banknotes to destinations outside the euro area declined by around 6% over the review period – the largest decline since the launch of the euro (see Chart 17). Data collected from banknote wholesalers, which act as intermediaries between the national central banks of the Eurosystem and financial institutions outside the euro area, suggest a similar pattern. Sales (exports) of euro banknotes to regions outside the euro area in 2021 increased by 11% compared with 2020, but purchases (imports) of euro banknotes increased much more (by 45%). Entities in countries neighbouring the euro area remained the main exporters and importers of euro banknotes (see Chart 18), with 78% of all euro banknote exports going to European regions and 73% of all euro banknote imports coming from European regions. Foreign demand for euro banknotes, which are used both for transactions and as store of value, depends on various factors. Recent research suggests that the determinants of developments in flows of euro cash are mainly local (including those affecting a country’s demand for euro, such as local inflation, exchange rate developments, economic activity and foreign tourism) rather than external (such as global uncertainty or short-term interest rates in the euro area).[63] For example, in 2021 the Turkish lira stabilised in exchange markets towards the end of the year and a de-hoarding of euro banknotes could be observed in Turkey. Tourism and remittances are also important determinants of foreign demand for euro cash outside the euro area and might have been still affected by the lingering effects of the pandemic in 2021.
Chart 17
Net extra-euro area shipments of euro banknotes declined in 2021
Net monthly shipments of euro banknotes to destinations outside the euro area
(EUR billions; adjusted for seasonal effects)
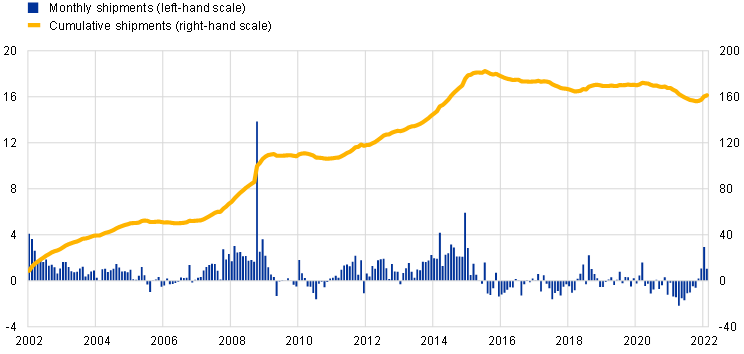
Source: Eurosystem.
Notes: Net shipments are euro banknotes sent to destinations outside the euro area minus euro banknotes received from outside the euro area. The latest observation is for February 2022.
Chart 18
In 2021, euro banknotes were mainly exported to and imported from European regions

Source: ECB calculations based on data from international banknote wholesalers.
Note: The data are for 2021.
Box 5
Euro-based stablecoins
Stablecoins are digital assets designed to minimise price volatility typically against a single fiat currency (or a basket of fiat currencies). There are different types of stablecoins – tokenised, collateralised, algorithmic – which use different mechanisms to ensure that stability against the target fiat currency is maintained.[64] Price stability may vary significantly across different coins due to differences in the ways in which they are pegged, the type and volatility of reserve assets (if any) and their governance structure. Recent empirical evidence suggests that it is likely that stablecoins have acted primarily as a bridge between traditional fiat currencies and volatile digital assets and as collateral in crypto-asset derivative transactions.[65]
From a financial stability perspective, due to full backing of their liabilities at par, stablecoins have been compared to money market funds or currency boards. However, stablecoins are particularly vulnerable to reserve outflows and therefore exposed to the risk of digital runs in the event that doubts about the backing of a coin issuance surface.[66] Large-scale redemptions of stablecoin units, possibly triggered by confidence shocks, could lead to fire sales of reserve assets, creating disruptions in markets used to invest the reserves. Therefore, stablecoins should not be regarded as a new class of safe asset but rather as a less volatile but risky crypto-asset.[67]
The vast majority of stablecoins are linked to the US dollar, which could support its international profile if private stablecoins were to gain broader acceptance.[68] Stablecoins pegged to the euro have started to gain popularity, although the market remains in its infancy. Given the potential systemic importance of stablecoins should the market develop further in the future, this box aims to assess the role of the euro in this market and whether euro-denominated stablecoins follow trends specific to crypto-asset markets or those of traditional financial instruments.
The stablecoin market has boomed in the past two years. It was valued at about USD 160 billion in 2021. As shown by Chart A, the stablecoin ecosystem is strongly dominated by coins linked to the US dollar, which account for about 99% of total capitalisation. The two largest stablecoins, USD Tether and USD Coin, have a combined market capitalisation of about USD 120 billion. Euro-denominated stablecoins are the second largest market segment, but their value is very limited (about €500 million). Their share is very small, at about 0.2% of the total stablecoin market. The market for euro-denominated stablecoins is also dominated by two large coins, EUR Tether and Stasis euro, that together account for about half of the total.
Chart A
Stablecoin issuance has increased noticeably in the last two years

Sources: CryptoCompare and ECB calculations.
Note: The latest observation is for 31 March 2022.
All major stablecoins trade at a small premium relative to parity on average (see Table A). This phenomenon might reflect the use of stablecoins as vehicles for crypto-asset trading or the existence of transaction frictions.[69] Prices are also volatile and may fall below parity, although volatility is substantially lower than riskier crypto-assets, such as bitcoin.[70] This is particularly the case for euro-based stablecoins that are traded on relatively small and shallow markets compared to US dollar-based coins.[71]
Retail investors have significantly increased their exposures to crypto-assets since 2018. Recent analysis suggests that crypto and equity markets have become increasingly interconnected across economies and over time.[72] The evidence can be re-examined by contrasting developments for Stasis euro (the most important euro-backed stablecoin, which has a history of over two years) and USD Tether (the largest stablecoin by market capitalisation) relative to a control group, which includes bitcoin and other financial variables. The analysis examines developments since 2020 – the period over which the stablecoin market has boomed – and consists in comparing returns in periods of global financial market stress, identified by large increases in the VIX index. The aim is to assess whether stablecoins are good hedges against global risk shocks.[73]
Table A
Dollar and euro stablecoins
Characteristics of stablecoin premia since 2020
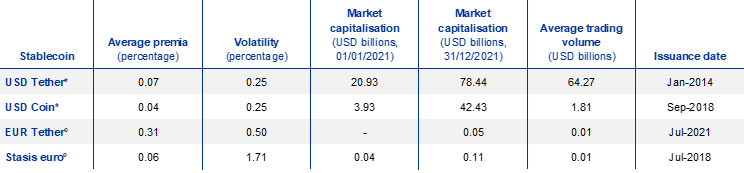
Sources: Coingeko and ECB calculations.
Notes: Stablecoin premia are defined as the percentage deviation of the stablecoin price from parity with the pegging currency. Because each reporting platform aggregates data using different algorithms and sources, reported values can vary depending on the source used. * Indicates a US dollar-based stablecoin, ° Indicates a stablecoin linked to the euro. Market capitalisation and trading volumes are in billions of US dollars.
The latest observation is for 31 March 2022.
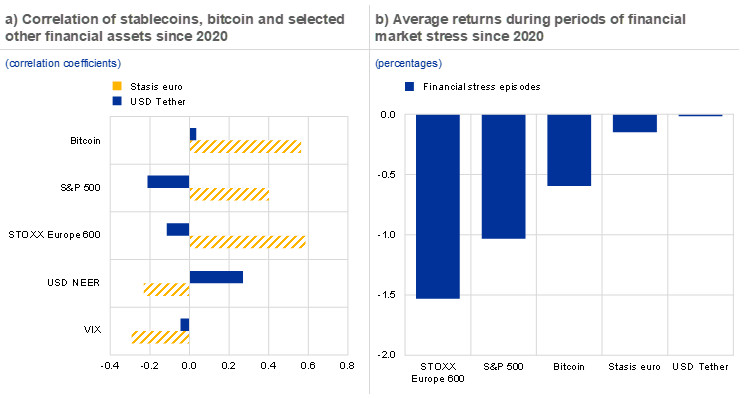
On average, USD Tether returns correlate positively – albeit to a moderate extent – with US dollar exchange rate returns, negatively with stock market returns, and they are uncorrelated with both bitcoin returns and the VIX index (see the blue bars in Chart B(a)). However, the correlation coefficients are not statistically significant. USD Tether returns do not therefore appear to be significantly associated with stock market nor with bitcoin price fluctuations. By contrast, returns for the euro-pegged stablecoin, Stasis euro, are positively and significantly correlated with stock market and bitcoin returns (see the dashed yellow bars in Chart B(a)). The value of Stasis euro, unlike that of USD Tether, declines when stock market volatility rises. This feature is also evident from the negative correlation between Stasis euro returns and the VIX index. Differences between US dollar and euro-linked stablecoin returns might reflect differences in relative liquidity and risk profiles. Euro-based coins are less liquid and tend to be sold similarly to other risky assets rather than behaving like a vehicle in digital transactions and trading.
A similar picture emerges from the analysis of high-risk episodes, defined as periods in which changes in the VIX index lie within the top 5th percentile of the distribution of weekly changes. In these episodes, stock market returns are negative (by around -1 to -1.5 percent), as are bitcoin returns (by around half a percent), as shown in Chart B(b). This suggests that investors sell risky assets and that bitcoin is considered to be a risky asset. Prices of stablecoins do not decline to a similar extent. However, returns on stablecoins become marginally negative when global financial market volatility rises, in particular those of Stasis euro, which depreciates by about 13 basis points, more than twice the average premium on this instrument. This suggests that investors sell stablecoins alongside other riskier asset classes, thereby raising potential financial stability concerns if larger shocks to global risk were to occur. This confirms the findings of recent studies on the stability of stablecoins.[74]
Chart B
Stasis euro was not a good hedge against corrections in risky asset prices
Sources: Coingeko, Haver Analytics and ECB calculations.
Notes: The left panel reports the correlation coefficients of weekly returns between stablecoin prices, financial market variables and bitcoin. The dashed bars indicate coefficients significant at the 10% level of confidence. The USD NEER is the US dollar nominal effective exchange rate. The right panel shows the averages of the returns in these variables in periods when changes in the VIX index lie within the top 5th percentile of the distribution of weekly changes.
The latest observation is for 31 March 2022.
Transaction volumes of stablecoins suggest that they are influenced by developments specific to crypto-assets. This is particularly the case for USD Tether, the largest stablecoin by market capitalisation. Chart C plots daily changes in traded volumes of stablecoins against those in bitcoin; it shows that purchases of USD Tether strongly co-move with bitcoin transactions (see Chart C(a)). For Stasis euro, the correlation is positive but less strong (see Chart C(b)). This suggests that euro-denominated stablecoins are used less frequently as vehicles for bitcoin purchases, perhaps because they are less liquid. Additional regression-based estimates show that financial market and crypto-assets returns explain a very low share of transactions in stablecoins. In contrast, transactions in stablecoins, particularly in US dollar stablecoins, are largely driven by transactions in crypto-assets. This suggests that stablecoins are not considered as a new financial asset class that investors would arbitrage against other asset classes, but as vehicles for transactions in more volatile crypto-assets.[75] Potential risks triggered by more widespread stablecoin adoption could be managed through the existing Eurosystem’s oversight framework that covers stablecoin arrangements that qualify as payment systems, regardless of the technology used. Moreover, in Europe the issuance of stablecoins and provision of crypto-asset services will be regulated under the Markets in Crypto-Assets (MiCA) Regulation, which is currently at the negotiation stage between the European Parliament, Council and Commission. Any stablecoin transfer function that qualifies as a payment system would either need to comply with the ECB Regulation on oversight requirements for systemically important payment systems or be assessed against the Eurosystem’s oversight framework for retail payment schemes.[76] These efforts would need to be complemented by stronger international cooperation on the regulation of crypto-assets.
Chart C
Transactions in stablecoins correlate with transactions in crypto-assets

Sources: Coingeko and ECB calculations.
Notes: The latest observation is for January 2022.
3 Statistical annex
See more.
© European Central Bank, 2022
Postal address 60640 Frankfurt am Main, Germany
Telephone +49 69 1344 0
Website www.ecb.europa.eu
All rights reserved. Reproduction for educational and non-commercial purposes is permitted provided that the source is acknowledged.
For specific terminology please refer to the ECB glossary (available in English only).
The cut-off date for the statistics included in this report was 30 April 2022.
PDF ISBN 978-92-899-5162-3, ISSN 1725-6593, doi:10.2866/104549, QB-XN-22-001-EN-N
HTML ISBN 978-92-899-5161-6, ISSN 1725-6593, doi:10.2866/30827, QB-XN-22-001-EN-Q
Note that currency shares in this market segment sum up to 200% because each exchange rate transaction involves two currencies.
See Council Conclusions on the EU’s economic and financial strategic autonomy: one year after the Commission’s Communication, adopted on 5 April 2022.
See ECB Crypto-Assets Task Force (2020), “Stablecoins: Implications for monetary policy, financial stability, market infrastructure and payments, and banking supervision in the euro area”, Occasional Paper Series, No. 247, European Central Bank, Frankfurt am Main, September.
SWIFT is a global messaging network through which international payments between banks are conducted.
See, for example, Buttonwood (2022), “Can foreign currency reserves be sanction-proofed?”, The Economist, London, 15 March.
Back in 2013, before the invasion of Crimea, Russia was the eleventh largest holder of US Treasuries, with holdings to the tune of almost USD 140 billon. In January 2022, Russia’s holdings stood at barely USD 4 billion. However, it is possible that some holdings are being held indirectly in other jurisdictions.
See Arslanalp, S., Eichengreen, B. J. and Simpson-Bell, C. (2022), “The stealth erosion of dollar dominance: active diversifiers and the rise of non-traditional reserve currencies”, Working Paper, No 2022/058, International Monetary Fund, Washington, March 24.
Gopinath, G. and J. Stein (2021), “Banking, trade, and the making of a dominant currency”, Quarterly Journal of Economics, Volume 136, Issue 2, pp. 783-830.
According to press reports, Saudi Arabia has held discussions with China to denominate their bilateral oil transactions in renminbi rather than US dollars. Russia has also recently started to invoice its exports of coal and oil to China in renminbi.
In a related vein, it has been argued that the dominant role of the US dollar as a reserve currency is unlikely to be affected as the United States has the largest, most liquid government bond market and a fully open capital account (see Brunnermeier, M.K., James, H., Landau, J. P., “Sanctions and the international monetary system”, VoxEU, 5 April 2022).
Such as the Australian dollar, Canadian dollar, Swedish krona and Swiss franc. See also Arslanalp, S., Eichengreen, B. J. and Simpson-Bell, C., op. cit.
See Box 5, “Euro-based stablecoins”, in this report for further details.
Barry Eichengreen (2013), “Number one country, number one currency?”, World Economy, Volume 36(4), April, pp. 363-374.
See Eichengreen, B., Mehl, A. and Chiţu, L. (2019), “Mars or Mercury? The geopolitics of international currency choice”, Economic Policy, Volume 34(98), April, pp. 315-363.
On 9 March 2022 President Biden signed an executive order that directs the US Government to assess the technological infrastructure and capacity needs for a potential US CBDC and encourages the Federal Reserve to continue its research, development, and assessment efforts for a US CBDC.
Purchases were derived from changes in holdings over the review period. The estimates accounted for exchange rate valuation effects that influenced the amount of reserves denominated in euro and reported in US dollar terms. Estimates for purchases of US dollars and euro did not account for potential valuation effects stemming from changes in the price of the underlying securities in the portfolio of official investors where these were reported at market value.
See UBS (2021), “UBS Annual Reserve Manager Survey”, Zurich, June.
On whether the Chinese renminbi would dethrone the US dollar as the leading global currency, see, for example, Subramanian, A. (2011), “Eclipse: living in the shadow of China’s economic dominance”, Peterson Institute for International Economics.
The Belt and Road Initiative is a Chinese-led project launched in 2013 aimed at expanding trade links between Asia, Africa and Europe. China is taking part in pilot projects to test a potential multi CBDC framework (mBridge). See the BISIH (Bank for International Settlements Innovation Hub) (2021), “Inthanon-LionRock to mBridge - Building a Multi CBDC Platform for International Payments”, joint report by the BIS Innovation Hub Hong Kong Centre, the Hong Kong Monetary Authority, the Bank of Thailand, the Digital Currency Institute of the People's Bank of China and the Central Bank of the United Arab Emirates, Bank for International Settlements, Basel, 28 September.
Chinese bonds were included in Bloomberg’s Barclays Global Aggregate Bond Index (with a weighting of 7.8% in 2019), in JP Morgan’s Government Bond Index for Emerging Markets (with a weighting of 10% in 2020), and in the FTSE Russell World Government Bond Index (with an estimated weighting of 5.3% in 2021).
See Raddatz, C., Schmukler, S. and Williams, T. (2017), “International asset allocations and capital flows: the benchmark effect”, Journal of International Economics, Volume 108, September, pp. 413-430; Broner, F., Martin, A., Pandolfi, L. and Williams, T. (2021), “Winners and losers from sovereign debt inflows," Journal of International Economics, Volume 130, May; Clayton, C, Dos Santos, A., Maggiori, M. and Schreger, J. (2022), “Internationalizing like China”, mimeo.
The shares are calculated using a commercial dataset (Lipper for investment Management) and update analysis in the previous edition of this report (Anaya Longaric, P. and Habib M. (2021), “The US dollar bias of US fixed-income funds”, The International role of the euro, European Central Bank, Frankfurt am Main, June 2021.
See Arslanalp, S., Eichengreen, B. J. and Simpson-Bell, C., op. cit.
See Horn, S., Reinhart, C. and Trebesch, C. (2021), "China's overseas lending", Journal of International Economics, Volume 133, November.
Custer, S., Dreher, A., Elston, T.B., Fuchs, A., Ghose, S., Lin, J., Malik, A., Parks, B.C., Russell, B., Solomon, K., Strange, A., Tierney, M.J., Walsh, K., Zaleski, L., and Zhang, S. (2021), “Tracking Chinese development finance: an application of AidData’s TUFF 2.0 Methodology”, AidData, William and Mary, Williamsburg, 29 September.
Boz, E., Casas, C., Georgiadis, G., Gopinath, G., Le Mezo, H., Mehl, A. and Nguyen, T. (2022), "Patterns of invoicing currency in global trade: New evidence ", Journal of International Economics, Volume 136; Bahaj, S., Reis, R. (2020), “Jumpstarting an international currency”, CEPR Discussion Paper, No. 14793; Georgiadis, G., Le Mezo, H., Mehl, A. and Tille, C. (2021), "Fundamentals vs. policies: can the US dollar's dominance in global trade be dented?", Working Paper, No 2574, ECB, July.
Cheung, Y.W., Grimm, L. and Westermann, F. (2021), “The evolution of offshore renminbi trading: 2016 to 2019”, Journal of International Money and Finance, Volume 113, Issue 113.
See latest update of dataset described in Fernandez, A., Klein, M., Rebucci, A., Schindler, M., Uribe, M. (2016), “Capital Control Measures: A New Dataset”, IMF Economic Review, Volume 64, August and Allen, F., Gu, X. and Jagtiani, J. (2022), “Fintech, cryptocurrencies, and CBDC: financial structural transformation in China”, Journal of International Money and Finance, Volume 124, June.
With effect from 1 August 2022, the IMF has determined that the five currencies that meet the selection criteria for inclusion in the SDR valuation basket will be assigned the following weights based on their roles in international trade and finance: U.S. dollar 43.38 percent, euro 29.31 percent, Chinese renminbi 12.28 percent, Japanese yen 7.59 percent, pound sterling 7.44 percent.
This is broadly consistent with the latest available evidence from the Triennial Central Bank Survey of Foreign Exchange and Over-the-counter (OTC) Derivatives Markets conducted by the Bank for International Settlements in 2019. Results of the next survey are expected to be published later this year.
CLS is operated by CLS Bank International, a specialised financial institution providing settlement services to its members in the foreign exchange market. Although not all foreign exchange transactions are settled in CLS, which partly reflects the fact that the foreign exchange market is largely decentralised, it has been estimated that over 50% of eligible global foreign exchange transactions are settled in CLS. This suggests that data on activity in CLS might be indicative of broader market trends.
Since transactions in foreign exchange markets always involve two currencies, shares add up to 200%.
The discussion here is based on the “narrow” definition of international debt issuance, which focuses on the foreign-currency principle. This definition therefore excludes all domestic currency issuance, i.e. all those securities denominated in the currency of the economy in which the issuer resides, from the standard (also known as “broad”) definition of international debt issuance. For instance, the narrow definition excludes a euro-denominated bond issued by a German company, whether issued outside the euro area (e.g. in the United States) or inside the euro area (e.g. in France).
The fact that the data on the share of the euro in foreign currency-denominated bond issuance reveal a different pattern to the data on the stock of international debt securities may be due to the fact that the latter depend additionally on net redemptions and developments in money market instruments.
Issuance in currencies other than the US dollar and the euro increased by 29% in 2021.
The share of other currencies increased by 2 percentage points to stand at approximately 13% in 2021.
See McCauley, R., McGuire, P. and Wooldrige, P. (2021), “Seven decades of international banking”, BIS quarterly review, Bank for International Settlements, Basel, September; and Avdjiev, S., Everett, M. and Shin, H.S. (2019), “Following the imprint of the ECB’s asset purchase programme on global bond and deposit flows”, BIS quarterly review, Bank for International Settlements, Basel, March.
See Goel, R. and Evan, P. (2021), “Drivers of Emerging Market Bond Flows and Prices”, Global Financial Stability Notes, No 2021/04, International Monetary Fund, Washington, December.
See “International role of the euro”, European Central Bank, Frankfurt am Main, June 2021.
See “An asynchronous and divergent recovery may put financial stability at risk”, Global Financial Stability Report, International Monetary Fund, Washington, April 2021.
See Sustainable Debt Market, Summary H1 2021, Climate Bonds Initiative, September 2021.
On 24 January 2022, the European Commission tapped the issuance of green bonds through an auction of €2.5 billion.
See footnote 41.
ECB (2021), “Climate change and monetary policy in the euro area”, Occasional Paper Series, No 271, European Central Bank, Frankfurt am Main, September.
International issuance of green bonds refers here to issuance in a foreign currency based on the nationality of the issuer or the parent entity of the issuer.
International loans are defined as loans by banks outside the currency area to borrowers outside the currency area. For instance, international loans in euro correspond to all euro-denominated loans by banks outside the euro area to borrowers outside the euro area.
The definition of international deposits is equivalent to the definition of international loans. International deposits are defined as deposits with banks outside the currency area made by creditors from outside the currency area. For instance, international deposits in euro correspond to all euro-denominated deposits with banks outside the euro area made by creditors from outside the euro area.
See “The international role of the euro”, European Central Bank, Frankfurt am Main, June 2021. See also Aldasoro, I., Eren, E. and Huang, W. (2021), “Dollar funding of non-US banks through Covid-19”, BIS Quarterly Review, Bank for International Settlements, Basel, March; Acharya, V. and Steffen, S. (2020), “The risk of being a fallen angel and the corporate dash for cash in the midst of COVID”, The Review of Corporate Finance Studies, Volume 9, Issue 3, November.
Other research has suggested that the introduction of international dollar liquidity facilities by the US Federal Reserve following the dash for cash, while effective in the short run, left patterns of cross-border liquidity and capital flows broadly unchanged over longer time horizons. See Goldberg, L.S. and Ravazzolo, F. (2021), “The Fed’s International Dollar Liquidity Facilities: New Evidence on Effects”, Staff Reports, No 997, Federal Reserve Bank of New York, December.
The views expressed here do not reflect those of the Bank for International Settlements.
Cross-border loans outside the respective currency area are referred to here as the narrow measure of international loans, consistent with annex Tables A6 and A7. Thus, euro-denominated loans by resident banks to local residents outside the euro area are excluded (e.g. euro loans to UK residents by banks in the UK). The stock of such euro-denominated local loans outside the euro area stood at about USD 720 billion as at the fourth quarter of 2021.
NBFIs comprise insurance companies and pension funds, finance companies, broker-dealers, special purpose vehicles, money market funds, hedge funds, other investment funds and central counterparties.
The charts show observations from the fourth quarter of 2014 given that the number of countries reporting the data was limited prior to this. The gap between the height of the area and the top blue line is due to claims that remain unallocated by non-bank subsectors. In the fourth quarter of 2021, around 21% of euro-denominated international loans to non-banks were not allocated to a sub-sector, while the equivalent figure for international loans in all currencies was 46%. Note that unallocated values more likely reflect claims on the non-financial corporations, government and household sectors, for which reporting is only on an encouraged basis, in contrast to claims on the NBFI sector, for which reporting is mandatory.
See Panetta, F. (2021), “Stay safe at the intersection: the confluence of big techs and global stable coins”, Speech delivered at the UK G7 Presidency Conference on “Safe Openness in Global Trade and Finance” hosted by the Bank of England, 8 October; Emter, L., Killeen, N. and McQuade, P. (2021), “Bank and non-bank financial institutions’ cross-border linkages: New evidence from international banking data”, Financial Stability Notes 2021, Volume 2021, No 03, Central Bank of Ireland, Dublin, June.
See Gopinath, G., Boz, E., Casas, C., Díez, F.J., Gourinchas, P.O. and Plagborg-Møller, M. (2020), “Dominant currency paradigm”, American Economic Review, Volume 110, Issue 3, pp. 677-719.
GVC linkages are known to dampen the effect of exchange rate fluctuations on export volumes, given that the competitiveness gains on the exporting side are counteracted by a change in the cost of imported intermediate inputs or exported products reimported after undergoing processing. As regards trade prices in euro and import volumes, GVCs are expected to increase exchange rate effects given that more imported inputs are used in export production or a sizable share of exports returns to the euro area as final products (see de Soyres, F., Frohm, E., Gunnella, V. and Pavlova, E. (2021), “Bought, sold and bought again: the impact of complex value chains on export elasticities”, European Economic Review, Volume 140, November).
See Jordà, Ò. (2005), “Estimation and inference of impulse responses by local projections”, American Economic Review, Volume 95, Issue 1, pp.161-182.
The regressor for the baseline specification is the bilateral exchange rate, its interaction with bilateral GVC participation indices and most importantly its interaction with trading partners’ invoicing share in overall trade (invoicing shares of bilateral trade are not available). Interaction terms are the product of the bilateral exchange rate and the GVC participation index or invoicing share. The regression also includes both a trading-partner-fixed effect and a time-fixed effectas well as 14 lags of the dependent variable and additional controls (extra-euro area export producer price index (PPI) and the trading partners’ export unit value in the export price regression, the domestic PPI and the trading partners’ import unit value in the import price regression, import volumes of the trading partner in the export volumes regression and the euro area industrial production to approximate for euro area import demand in the import volumes regression; one-year ahead proportional deviation of forecasted euro exchange rates to spot exchange rates in all regressions, to take into account expectations of exchange rate developments). The sample includes monthly data from April 2001 to December 2019.
Average shares of GVC participation over time are considered.
The import volumes’ elasticity and interaction terms turn out to be only mildly significant over the horizon considered (i.e. only at specific times). This result may be partly explained by the composition of euro area imports, where energy products are particularly relevant. On the one hand, the exchange rate pass-through to energy product prices is generally larger than to manufacturing product prices – being homogenous, non-differentiated goods (see Campa, J. and Goldberg, L. (2008), “Pass-Through of Exchange Rates to Consumption Prices: What has Changed and Why?”, International Financial Issues in the Pacific Rim: Global Imbalances, Financial Liberalization and Exchange Rate Policy, National Bureau of Economic Research, pp. 139-176, and Ben Cheikh, N. and Rault, C. (2017), “Investigating first‐stage exchange rate pass‐through: Sectoral and macro evidence from euro area countries”, The World Economy, Volume 40, Issue 12, February, pp. 2611-2638). On the other hand, and correspondingly, euro area energy demand, and thus import volumes, may be characterised by relatively low elasticity owing to limited substitution possibilities.
For instance, in the case of exports, the results when euro invoicing is low correspond to local currency pricing where at the limit no reaction in volumes to exchange rate changes is expected and results for high euro invoicing is akin to producer currency pricing where full adjustment of quantities is expected.
See Lalouette, L., Zamora-Pérez, A., Rusu, C., Bartzsch, N., Politronacci, E., Delmas, M., Rua, A., Brandi, M. and Naksi, M. (2021), “Foreign demand for euro banknotes”, Occasional Paper Series, No 253, European Central Bank, Frankfurt am Main, January.
For the definition of alternative backing schemes for stablecoins and the difference between tokenised, collateralised and algorithmic coins, see Bullmann, D., Klemm, J. and Pinna, A. (2019), “In search for stability in crypto-assets: are stablecoins the solution?”, Occasional Paper, No 230, European Central Bank, August.
See Griffin, J. and Shams, A. (2022), ”Is Bitcoin Really Untethered?”, Journal of Finance, Vol. 75, Issue 4, 2020, pp. 1913-1964; International Monetary Fund (2022), “Global Financial Stability Report”, Washington, October, and Financial Stability Board (2022), “Assessment of Risks to Financial Stability from Crypto-assets”, Basel, February.
See Lyons, R. and Viswanath-Natraj, G. (2020), ”What Keeps Stablecoins Stable?”, Working Paper, No. 27136, National Bureau of Economic Research, Cambridge, May.
Panetta, F. (2021), “The present and future of money in the digital age”, Lecture at the 2021 Federcasse annual meeting, Rome, 10 December; Arner, D., Auer, R. and Frost, J. (2021), “Stablecoins: risks, potential and regulation”, BIS Working Paper, No. 905, Bank for International Settlements, Basel, 24 November.
Prasad, E., “Digital currencies carry threats as well as promises”, Financial Times, 14 February 2022; Garratt, R., Lee, M., Martin, A. and Torregrossa, J. (2022), “The Future of Payments Is Not Stablecoins”, The Federal Reserve Bank of New York, 7 February. The President’s Working Group on Financial Markets Report and Recommendations on Stablecoins (2021), US Department of the Treasury, 1 November, reached similar conclusions.
See Baur, D., Hoang, D. and Lai, T. (2021), “A crypto safe haven against Bitcoin”, Finance Research Letters, Vol. 38, January.
Bitcoin daily returns had an average volatility of 4% in 2020 and 2021, with negative returns in excess of 1% on 30% of the days.
Stasis euro, for example, traded below parity about 25% of all days in 2021, against 18% for EUR Tether. Negative spikes are also significant. Stasis euro traded at a discount of 10 basis points or more against parity in 21% of all days in 2021. The largest negative deviation from parity was almost 9%. In comparison for USD Tether the largest discount was only 0.8%.
See Iyer, T. (2022), “Cryptic Connections: Spillovers between Crypto and Equity Markets”, IMF Global Financial Stability Note, No. 2022/01, International Monetary Fund, Washington, January.
Results are similar when the early phase (January to March 2020) of the COVID-19 pandemic is excluded.
See Gorton, G.B., Ross, C.P. and Ross, S.Y., (2021), “Making Money”, Working Paper, No 29710, National Bureau of Economic Research, January: “Stablecoins have not developed individual reputations, nor are they accepted as money, no-questions-asked. As a result, stablecoins do not yet earn a positive convenience yield”.
See Griffin and Shams, op. cit., and Lyons and Viswanath-Natraj, op. cit.
See ECB Crypto-Assets Task Force (2020), “Stablecoins: Implications for monetary policy, financial stability, market infrastructure and payments, and banking supervision in the euro area”, Occasional Paper Series, No 247, European Central Bank, Frankfurt am Main, September.
- 14 June 2022