Credit risk transmission during the pandemic: the sovereign-bank-corporate nexus
Published as part of the Financial Stability Review, May 2021.
It has been argued that the coronavirus pandemic has strengthened what is known as the sovereign-bank-corporate nexus, also intensifying the transmission of credit risk shocks across sectors.[1],[2] An increase in interdependencies among sovereigns, banks and corporates may mean that if vulnerabilities arise in one sector, they become more likely to spill over to other sectors. This box sheds light on how the structure of cross-sectoral credit risk transmission has evolved since the start of the pandemic. It does so by using high-frequency, firm-level data on expected default frequencies (EDFs) to estimate the direction and intensity of credit risk spillovers between the sovereign, bank, non-bank financial and corporate sectors.[3]
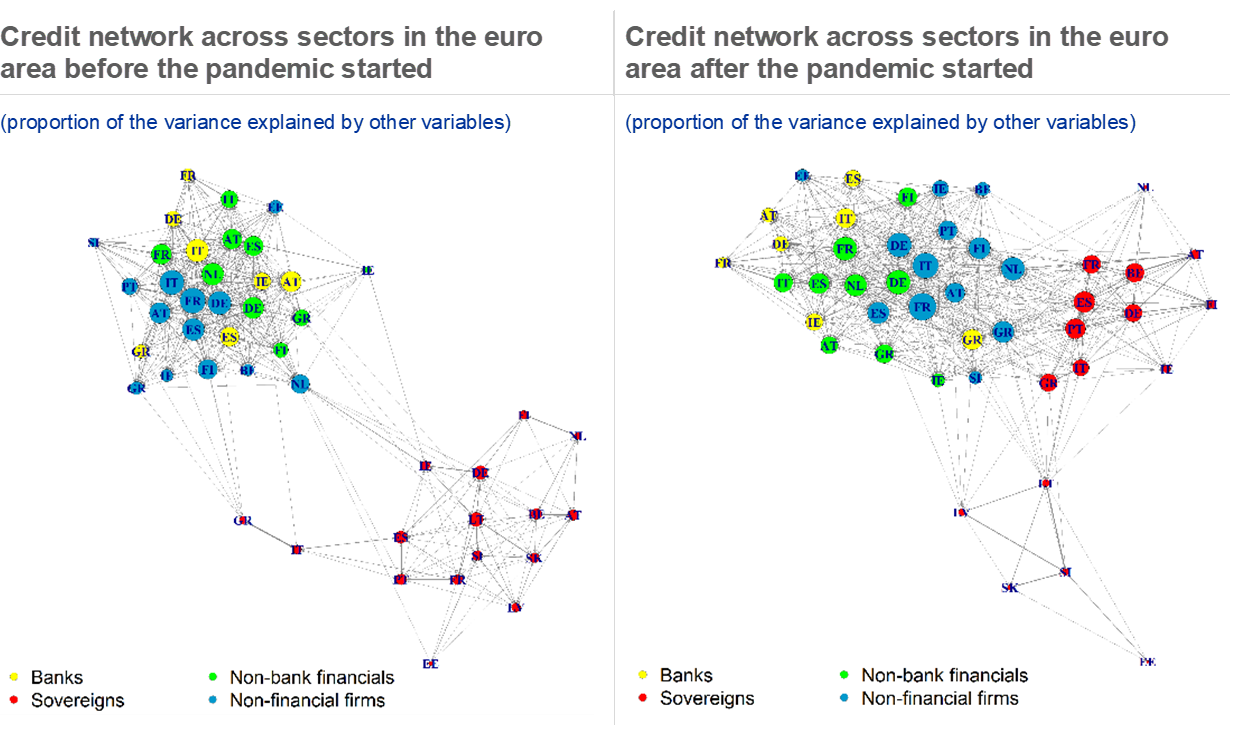
The credit risk interdependency of euro area financials and corporates with sovereigns has increased markedly in the wake of the pandemic, and the corporate sector has become more central to the network. Before the pandemic started, there was a strong clustering of credit risk links between banks, non-bank financials and non-financial firms (see Chart A, left panel), which reflected their substantial dependencies in terms of credit risk. However, euro area sovereigns formed their own cluster, visibly separated from the rest of the network, reflecting the limited risk transmission between sovereigns and the other sectors of the economy. After the coronavirus outbreak (see Chart A, right panel), the majority of nodes moved closer to each other, suggesting higher contagion risk across sectors, with the non-financial corporate sectors of major euro area economies at the centre of the network. Most notably, sovereigns increased their integration with the rest of the network, indicating that a transfer of risk to sovereigns took place.
Chart A
The shape of the cross-sectoral credit risk network changed after the pandemic started

Sources: Moody’s Analytics and ECB calculations.
Notes: The network visualisation was derived on the basis of the methodology proposed by Diebold and Yilmaz (2014) and Gross and Siklos (2020), which is based on forecast error variance decompositions in large-scale VARs. A 150-day rolling-window approach was adopted to estimate time variation. The underlying data are five-year EDFs for firms and sovereigns, which act as a proxy for probability of default. EDFs of individual firms have been aggregated to form weighted country-level indices for the three corporate sectors. The chart in the left panel shows the credit risk network across sectors in the euro area on 19 February 2020, before the coronavirus outbreak (i.e. the 150-day estimation window ends on this date). The chart in the right panel shows the credit risk network across sectors in the euro area on 11 March 2020, when the World Health Organization declared the coronavirus a global pandemic (i.e. the 150-day estimation window ends on this date). Node size in the network is proportional to credit risk contributions. Sectors that contribute relatively more credit risk to other sectors are represented by bigger nodes. Node location is determined by a force-directed algorithm which positions the nodes according to pair-wise links between two sectors. EDF sectors that are linked through high pair-wise connectedness are thus positioned close to each other, whereas EDF sectors that are linked through low pair-wise connectedness are shown further apart. As a result, EDF sectors with many strong links to other sectors are located in the network’s centre (these entities are more systemically important), whereas nodes for EDF sectors with weak links to other sectors are located in the network’s periphery (less systemically important). Link thickness is a linear function of pair-wise connectedness, with a thicker link between two nodes indicating strong pair-wise connectedness.
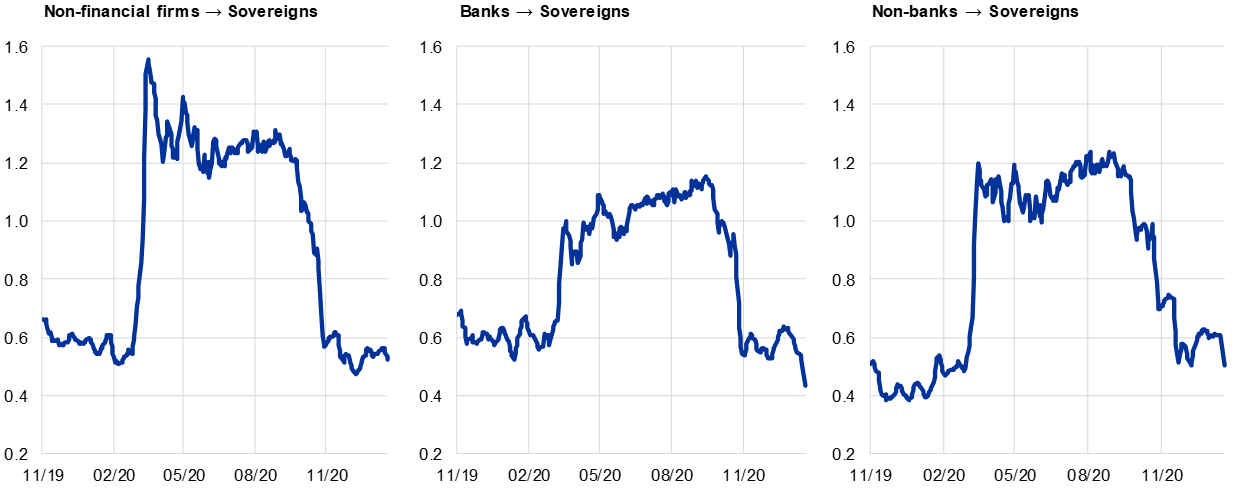
Risk transmission from the corporate sector to sovereigns increased substantially and remained elevated between March and October 2020 (see Chart B, left panel). During the first months of the pandemic, the increase in the transmission of risk from non-financial firms and non-bank financials to sovereigns was more pronounced than from banks to sovereigns. This would be consistent with fiscal and prudential measures adopted to support corporates, implying a substantial transfer of credit risk from the other sectors to sovereigns. The transmission of risk began to wane in autumn 2020, coinciding with the announcements of effective coronavirus vaccines and the finalisation of the agreement on the Next Generation EU recovery fund (see Chart B). By early 2021, risk transmission to sovereigns had fallen to near pre-pandemic levels.
Chart B
The transmission of risk from non-financial and non-bank financial sectors to sovereigns was more pronounced than from banks to sovereigns
Credit risk transmission from non-financial firms, banks and non-bank financials to sovereigns in the euro area during the coronavirus pandemic
(average proportion of the variance of sovereign EDFs explained by the variance of individual EDFs in each sector (five-day moving average))

Sources: Moody’s Analytics and ECB calculations.
Notes: The charts show smoothed estimates (five-day moving average) of aggregate directional connectedness between various segments of the corporate sector and sovereigns during the period from 1 November 2019 to 19 January 2021. The underlying VAR model was estimated using a rolling window of 150 days, building on the methodology introduced by Diebold and Yilmaz (2014) and extended by Gross and Siklos (2020).
Elevated sovereign risk contributed to higher credit risk in the financial and non-financial sectors for a brief period at the start of the pandemic. Risk transmission from sovereigns to other sectors spiked immediately after the pandemic first appeared (see Chart C).
Chart C
The transmission of risk from sovereigns to the private sector was relatively more contained and short-lived
Credit risk transmission from sovereigns to the other sectors in the euro area during the coronavirus pandemic
(average proportion of the variance of non-financial and financial EDFs explained by the variance of sovereign EDFs (five-day moving average))

Sources: Moody’s Analytics and ECB calculations.
Notes: The charts show smoothed estimates (five-day moving average) of aggregate connectedness between sovereigns and various segments of the corporate sector during the period from 1 November 2019 to 19 January 2021. The underlying VAR model was estimated using a rolling window of 150 days, building on the methodology introduced by Diebold and Yilmaz (2014) and extended by Gross and Siklos (2020). The vertical lines denote policy actions or announcements by the ECB in response to the pandemic: 1. Announcement of new longer-term refinancing operations (LTROs), the third series of targeted longer-term refinancing operations (TLTRO III) and the expansion of the asset purchase programme (APP), 12 March 2020; 2. Start of the PEPP, 26 March 2020; 3. ECB says it will do “everything necessary”, 16 April 2020.
However, in contrast to the credit risk transmitted to sovereigns, risk transmission from sovereigns to the private sector was relatively more contained and short-lived. The decline in the transmission of risk from sovereigns coincided with major policy action, including the launch of the pandemic emergency purchase programme (PEPP). By May 2020, the transfer of risk from sovereigns to the other sectors had already significantly declined. These findings suggest that the ECB policy actions helped mitigate the spread of sovereign contagion risk, thereby preventing the emergence of an adverse feedback loop similar to that seen during the 2010-12 euro area sovereign debt crisis, which would have further exacerbated the credit risk of the European corporate sector.[4]
Examining the credit risk dependencies of sovereigns, financials and corporates in the euro area shows how interlinkages increased at the start of the pandemic but have fallen since, reflecting improved economic prospects. While increased interlinkages might be regarded as a source of concern for contagion risk, the increased transmission of credit risk seen from the start of the pandemic often coincided with the launch of policy measures which transferred risk away from corporates to other sectors, supported economic growth and protected financial stability.[5]
- See the speech entitled “The sovereign-bank-corporate nexus – virtuous or vicious?” by Isabel Schnabel at the LSE conference on “Financial Cycles, Risk, Macroeconomic Causes and Consequences”, Frankfurt, 28 January 2021.
- The term sovereign-bank-corporate nexus refers to the tight interdependencies between these sectors which are linked by multiple interacting channels. See, for example, Dell’Ariccia, G., Ferreira, C., Jenkinson, N., Laeven, L., Martin, A., Minoiu, C. and Popov, A., “Managing the sovereign-bank nexus”, Working Paper Series, No 2177, ECB, September 2018.
- This analysis relies on the methodology developed by Diebold and Yilmaz (2014) and Gross and Siklos (2020) and uses Moody’s EDFs at daily frequency for up to 16 euro area countries for four sectors (sovereigns, banks, non-bank financials and non-financial firms). The methodology enables the derivation of estimates of directional connectedness based on variance decompositions in large-scale vector autoregressions (VARs) that trace the impact of individual shocks on all variables considered in the system of equations. Results are visualised by means of graphical network representations which portray the empirical estimates in an informative manner. See Diebold, F.X. and Yilmaz, K., “On the network topology of variance decompositions: Measuring the connectedness of financial firms”, Journal of Econometrics, Vol. 182, Issue 1, 2014, pp. 119-134, and Gross, C. and Siklos, P., “Analyzing credit risk transmission to the nonfinancial sector in Europe: A network approach”, Journal of Applied Econometrics, Vol. 35, Issue 1, 2020, pp. 61-81.
- The emergence of an adverse feedback loop similar to that seen during the 2010-12 euro area sovereign debt crisis was averted also due to the stronger resilience of the banking sector, which has in recent years strengthened its capital position as a result of the post-financial crisis regulatory reforms.
- For example, fiscal policies limited the economic fallout due to the containment measures through direct measures to protect firms and workers in the affected industries and provided liquidity to firms to avoid liquidity shortages. Prudential measures helped banks to maintain a sustainable supply of credit to the economy and limited the scope for the banking sector to amplify the effects of the coronavirus pandemic.


