Economic, financial and monetary developments
Overview
At its meeting on 12 December 2024, the Governing Council decided to lower the three key ECB interest rates by 25 basis points. In particular, the decision to lower the deposit facility rate – the rate through which the Governing Council steers the monetary policy stance – was based on its updated assessment of the inflation outlook, the dynamics of underlying inflation and the strength of monetary policy transmission.
The disinflation process is well on track. According to the December 2024 Eurosystem staff macroeconomic projections for the euro area, headline inflation is expected to average 2.4% in 2024, 2.1% in 2025, 1.9% in 2026 and 2.1% in 2027 when the expanded EU Emissions Trading System becomes operational. For inflation excluding energy and food, staff project an average of 2.9% in 2024, 2.3% in 2025 and 1.9% in both 2026 and 2027.
Most measures of underlying inflation suggest that inflation will settle at around the Governing Council’s 2% medium-term target on a sustained basis. Domestic inflation has edged down but remains high, mostly because wages and prices in certain sectors are still adjusting to the past inflation surge with a substantial delay.
Financing conditions are easing, as the Governing Council’s recent interest rate cuts gradually make new borrowing less expensive for firms and households. But they continue to be tight because monetary policy remains restrictive and past interest rate hikes are still transmitting to the outstanding stock of credit.
In the December 2024 projections, staff now expect a slower economic recovery than in the September 2024 ECB staff macroeconomic projections for the euro area. Although growth picked up in the third quarter, survey indicators suggest it has slowed in the fourth quarter. Staff see the economy growing by 0.7% in 2024, 1.1% in 2025, 1.4% in 2026 and 1.3% in 2027. The projected recovery rests mainly on rising real incomes – which should allow households to consume more – and firms increasing investment. Over time, the gradually fading effects of restrictive monetary policy should support a pick-up in domestic demand.
The Governing Council is determined to ensure that inflation stabilises sustainably at its 2% medium-term target. It will follow a data-dependent and meeting-by-meeting approach to determining the appropriate monetary policy stance. In particular, the Governing Council’s interest rate decisions will be based on its assessment of the inflation outlook in light of the incoming economic and financial data, the dynamics of underlying inflation and the strength of monetary policy transmission. The Governing Council is not pre-committing to a particular rate path.
Economic activity
The economy grew by 0.4% in the third quarter of 2024, exceeding expectations. Growth was driven mainly by an increase in consumption, partly reflecting one-off factors that boosted tourism over the summer, and by firms building up inventories. But the latest information suggests it is losing momentum. Surveys indicate that manufacturing is still contracting and growth in services is slowing. Firms are holding back their investment spending in the face of weak demand and a highly uncertain outlook. Exports are also weak, with some European industries finding it challenging to remain competitive.
The labour market remains resilient. Employment grew by 0.2% in the third quarter of 2024, again by more than expected. The unemployment rate remained at its historical low of 6.3% in October. Meanwhile, demand for labour continues to weaken. The job vacancy rate declined to 2.5% in the third quarter, 0.8 percentage points below its peak, and surveys also point to fewer jobs being created in the fourth quarter.
The euro area economy is set to continue its gradual recovery over the coming years, amid significant geopolitical and policy uncertainty. In particular, rising real wages and employment, in a context of robust labour markets, are expected to support a recovery in which consumption remains one of the main drivers. Domestic demand should also be bolstered by an easing of financing conditions, in line with market expectations of the future path of interest rates. Although surrounded by high uncertainty, fiscal policies are assumed to be on a consolidation path overall. Nevertheless, funds from the Next Generation EU programme should support growth until the expiry of the programme in 2027. Under the baseline assumption that the trade policies of Europe’s key trading partners remain unchanged, foreign demand is expected to strengthen and support euro area exports. As a result, net trade is expected to make a broadly neutral contribution to GDP growth, despite existing competitiveness challenges. The unemployment rate is set to decline further to historically low levels. As some of the cyclical factors that have recently reduced productivity start to unwind, productivity is expected to pick up over the projection horizon, although structural challenges remain. Overall, according to the December 2024 projections, annual average real GDP growth is projected to be 0.7% in 2024, 1.1% in 2025 and 1.4% in 2026, before moderating to 1.3% in 2027. Compared with the September 2024 projections, the outlook for GDP growth has been revised down, mainly owing to revisions to data on investment in the first half of 2024, expectations of weaker export growth in 2025, and a small downward revision to the projected expansion of domestic demand in 2026.
Fiscal and structural policies should make the economy more productive, competitive and resilient. It is crucial to swiftly follow up, with concrete and ambitious structural policies, on Mario Draghi’s proposals for enhancing European competitiveness and Enrico Letta’s proposals for empowering the Single Market. The Governing Council welcomes the European Commission’s assessment of governments’ medium-term plans for fiscal and structural policies, as part of the EU’s revised economic governance framework. Governments should now focus on implementing their commitments under this framework fully and without delay. This will help bring down budget deficits and debt ratios on a sustained basis, while prioritising growth-enhancing reforms and investment.
Inflation
Annual inflation increased to 2.3% in November according to Eurostat’s flash estimate, from 2.0% in October. The increase was expected and primarily reflected an energy-related upward base effect. Food price inflation edged down to 2.8% and services inflation to 3.9%. Goods inflation went up to 0.7%.
Domestic inflation, which closely tracks services inflation, again eased somewhat in October. But at 4.2%, it remains high. This reflects strong wage pressures and the fact that some services prices are still adjusting with a delay to the past inflation surge. That said, underlying inflation is overall developing in line with a sustained return of inflation to target.
Most measures of longer-term inflation expectations stand at around 2%, and market-based indicators of medium to longer-term inflation compensation have decreased measurably since the Governing Council’s meeting on 17 October 2024.
The increase in compensation per employee moderated to 4.4% in the third quarter of 2024 from 4.7% in the second. Amid stable productivity, this contributed to slower growth in unit labour costs.
Easing labour cost pressures and the continuing impact of the Governing Council’s past monetary policy tightening on consumer prices should help inflation to settle sustainably at around the 2% medium-term target, as previous sharp falls in energy prices continue to drop out of the annual rates.
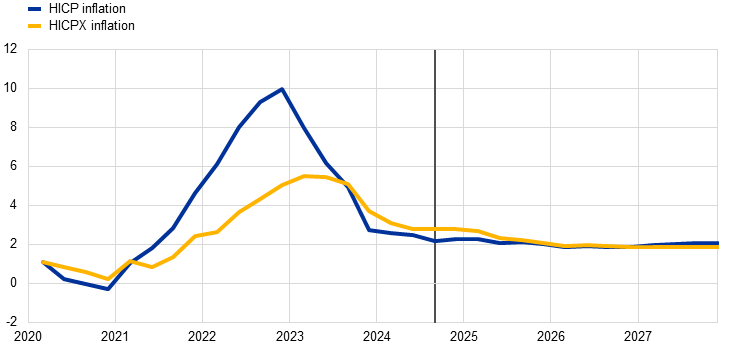
In the December 2024 projections, headline HICP inflation is projected to rise in late 2024, before declining to hover around the ECB’s inflation target of 2% from the second quarter of 2025. Base effects in the energy component are expected to be the main driver of the temporary increase in inflation at the start of the projection horizon. Based on assumptions of declining oil and gas prices, energy inflation is likely to remain negative until the second half of 2025 and to stay subdued thereafter, except for an uptick in 2027 owing to the introduction of new climate change mitigation measures. Food inflation is projected to rise until mid-2025, driven mostly by resurging unprocessed food price dynamics, before declining to an average of 2.2% by 2027. HICP inflation excluding energy and food (HICPX) is expected to decline in early 2025 as the indirect effects of past energy price shocks fade, labour cost pressures recede and the lagged impacts from past monetary policy tightening continue to feed through to consumer prices. This decline is expected to be led by a decrease in services inflation – which has thus far been relatively persistent. Overall, HICPX inflation is expected to moderate from 2.9% in 2024 to 1.9% in 2027. Wage growth will initially remain elevated but will decline gradually as inflation compensation pressures fade. The moderation in the growth of compensation per employee, coupled with a recovery in productivity growth, is expected to lead to significantly slower growth in unit labour costs. As a result, domestic price pressures are projected to ease, with profit margins initially buffering the still high labour cost pressures but recovering over the projection horizon. External price pressures should remain moderate overall. Compared with the September 2024 projections, the outlook for headline HICP inflation has been revised down marginally for 2024 and 2025, mainly owing to downward data surprises and lower oil and electricity price assumptions.
Risk assessment
The risks to economic growth remain tilted to the downside. The risk of greater friction in global trade could weigh on euro area growth by dampening exports and weakening the global economy. Lower confidence could prevent consumption and investment from recovering as fast as expected. This could be amplified by geopolitical risks, such as Russia’s unjustified war against Ukraine and the tragic conflict in the Middle East, which could disrupt energy supplies and global trade. Growth could also be lower if the lagged effects of monetary policy tightening last longer than expected. It could be higher if easier financing conditions and falling inflation allow domestic consumption and investment to rebound faster.
Inflation could turn out higher if wages or profits increase by more than expected. Upside risks to inflation also stem from the heightened geopolitical tensions, which could push energy prices and freight costs higher in the near term and disrupt global trade. Moreover, extreme weather events, and the unfolding climate crisis more broadly, could drive up food prices by more than expected. By contrast, inflation may surprise on the downside if low confidence and concerns about geopolitical events prevent consumption and investment from recovering as fast as expected, if monetary policy dampens demand more than expected, or if the economic environment in the rest of the world worsens unexpectedly. Greater friction in global trade would make the euro area inflation outlook more uncertain.
Financial and monetary conditions
Market interest rates in the euro area have declined further since the Governing Council’s October meeting, reflecting the perceived worsening of the economic outlook. Although financing conditions remain restrictive, the Governing Council’s interest rate cuts are gradually making it less expensive for firms and households to borrow.
The average interest rate on new loans to firms was 4.7% in October, more than half a percentage point below its peak a year earlier. The cost of issuing market-based debt has fallen by more than a percentage point since its peak. The average rate on new mortgages, at 3.6% in October, is about half a percentage point lower than at its highest point in 2023, even though the average rate on the outstanding stock of mortgages is still set to rise.
Bank lending to firms has gradually picked up from low levels, and increased by 1.2% in October compared with a year earlier. Debt securities issued by firms were up 3.1% in annual terms, which was similar to the increase in the previous few months. Mortgage lending continued to rise gradually in October, with an annual growth rate of 0.8%.
In line with its monetary policy strategy, the Governing Council thoroughly assessed the links between monetary policy and financial stability. Euro area banks remain resilient and there are few signs of financial market stress. Financial stability risks nonetheless remain elevated. Macroprudential policy remains the first line of defence against the build-up of financial vulnerabilities, enhancing resilience and preserving macroprudential space.
Monetary policy decisions
The interest rates on the deposit facility, the main refinancing operations and the marginal lending facility were decreased to 3.00%, 3.15% and 3.40% respectively, with effect from 18 December 2024.
The asset purchase programme portfolio is declining at a measured and predictable pace, as the Eurosystem no longer reinvests the principal payments from maturing securities.
In the second half of 2024, the Eurosystem no longer reinvested all of the principal payments from maturing securities purchased under the pandemic emergency purchase programme (PEPP) to reduce the PEPP portfolio by €7.5 billion per month on average. The Governing Council discontinued reinvestments under the PEPP at the end of 2024.
Banks repaid the remaining amounts borrowed under the targeted longer-term refinancing operations in December 2024, which concluded this part of the balance sheet normalisation process.
Conclusion
At its meeting on 12 December 2024, the Governing Council decided to lower the three key ECB interest rates by 25 basis points. In particular, the decision to lower the deposit facility rate – the rate through which the Governing Council steers the monetary policy stance – was based on its updated assessment of the inflation outlook, the dynamics of underlying inflation and the strength of monetary policy transmission. The Governing Council is determined to ensure that inflation stabilises sustainably at its 2% medium-term target. It will follow a data-dependent and meeting-by-meeting approach to determining the appropriate monetary policy stance. In particular, the Governing Council’s interest rate decisions will be based on its assessment of the inflation outlook in light of the incoming economic and financial data, the dynamics of underlying inflation and the strength of monetary policy transmission. The Governing Council is not pre-committing to a particular rate path.
In any case, the Governing Council stands ready to adjust all of its instruments within its mandate to ensure that inflation stabilises sustainably at its 2% target over the medium term and to preserve the smooth functioning of monetary policy transmission.
1 External environment
Over the review period (from 17 October to 11 December 2024) global economic growth remained strong, despite increasing headwinds. Survey data pointed to broad‑based improvements across sectors, with the services sector continuing to perform strongly. Global trade remained robust, reflecting to some extent frontloading of goods imports amid uncertainty surrounding future US trade policy. Inflation continued to moderate but upward pressures on services prices remained. The outlook for global growth and inflation, as reflected in the December 2024 Eurosystem staff macroeconomic projections for the euro area, is broadly unchanged from the September 2024 ECB staff macroeconomic projections. However, the outcome of the US presidential elections has added significant uncertainty to international trade policies. Global trade metrics were revised up significantly to reflect stronger data outturns in the second and third quarters. Following the recovery during 2024, global trade is projected to grow more in line with activity, although there are elevated downside risks relating to greater trade protectionism and fragmentation. Inflation across major advanced and emerging market economies is expected to decline gradually over the projection horizon.
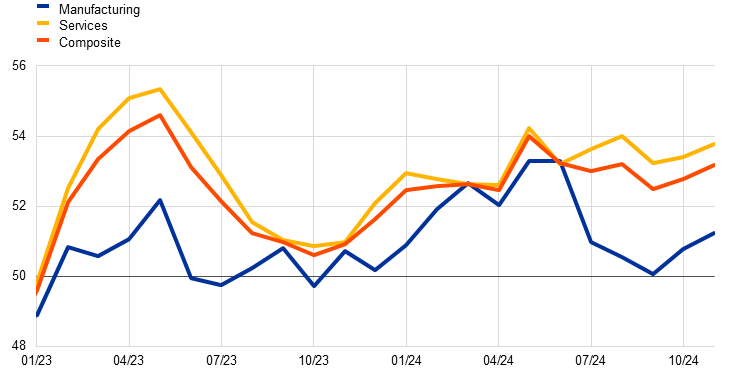
Global economic activity has remained strong, even though increasing headwinds highlight the fragility of the outlook. The global composite output Purchasing Managers’ Index (PMI) (excluding the euro area) remained firmly in expansionary territory in November 2024 at 53.2, up from 52.8 in October (Chart 1). While services sector activity continued to strengthen, manufacturing activity also improved, edging up further above the no‑growth threshold to 51.2 in November. The increase in the composite output PMI indicator was driven in particular by the United States and China. In the case of China, this reflected a strong expansion in the manufacturing sector, while in the United States services sector activity improved significantly. Recent data suggest that global growth remained robust in the fourth quarter of 2024. This is supported by stronger economic data in the United States and China, as well as recently announced fiscal support in China and, to a lesser extent, the United Kingdom. Geopolitical tensions, lingering weakness in the Chinese real estate sector and uncertainties about the policies of the next US Administration also suggest that the global growth outlook is still fragile.
Chart 1
Global output PMI
(diffusion indices)
Sources: S&P Global Market Intelligence and ECB staff calculations.
Notes: “PMI” stands for Purchasing Managers’ Index. The latest observations are for November 2024.
The outlook for global activity is projected to stay strong but to moderate slightly over the projection horizon. Global real GDP is projected to grow by 3.4% in 2024 and 3.5% in 2025, and to decrease to 3.3% in 2026 and 3.2% in 2027. The small decline in global growth later in the projection horizon is due mainly to expectations of slower growth in China, reflecting unfavourable demographics, and some deceleration in the United States. In the United Kingdom, fiscal loosening is assumed to boost real GDP growth only temporarily, as future corporate tax increases are likely to weigh on private sector activity. The outcome of the US elections has brought significant uncertainty since it is difficult at this stage to gauge the policy measures of the new US Administration. The December Eurosystem staff projections incorporate stricter immigration legislation and looser fiscal policies (particularly the extension of personal and corporate income tax cuts, which was introduced in 2017 and is set to expire in 2025).
After stronger than expected growth in the third quarter, the pace of global trade is likely to decelerate in the near term. Global imports surprised on the upside in the third quarter, driven by a sharp increase in US trade. Anecdotical evidence suggests that US firms frontloaded imports given the uncertainties about future trade policies and in anticipation of strike action in US East Coast ports in October. While global trade is inherently volatile, incoming data point to a softening in global imports in the fourth quarter. The easing reflects a still weak manufacturing cycle and a normalisation of goods imports following buoyant growth in previous quarters. This is exacerbated by a less favourable composition of global demand, which is currently influenced by the less trade-intensive services sector and public sector consumption. In line with decelerating trade momentum, the global (excluding the euro area) PMI for new export orders in manufacturing remained in contractionary territory, at 49.4, in November. In light of this, shipping costs are also beginning to normalise after the steep increases observed in the second quarter of 2024 that reflected higher demand for shipping, consistent with frontloading of imports.
Global trade is projected to recover this year and grow more in line with global activity over the rest of the projection horizon, although there are strong downside risks of increased trade protectionism and fragmentation. Global trade growth for 2024 has been revised up by 0.9 percentage points compared with the September 2024 projections, mainly as a result of stronger data outturns in the second and third quarters. Global trade is projected to increase by 3.6% in 2025, before moderating to 3.3% in 2026 and 3.2% in 2027. The outlook, however, remains very uncertain. Further frontloading driven by expectations of trade restrictions could strengthen trade in the short term. In the medium term trade could weaken further in light of ongoing geopolitical tensions, a significant increase in trade protectionism and fragmentation.
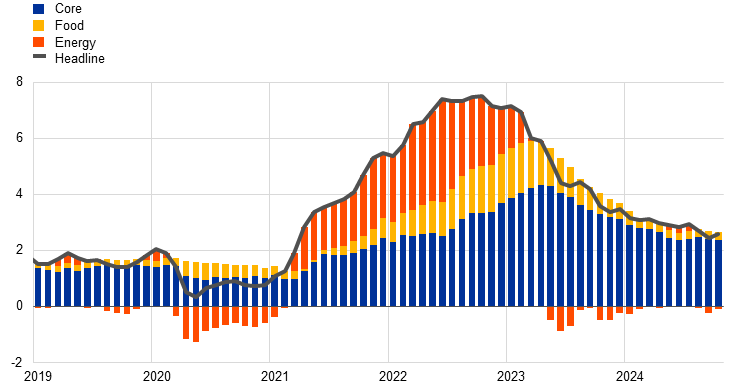
Inflation across the member countries of the Organisation for Economic Co‑operation and Development (OECD) continues to moderate, but underlying price pressures remain. In October the annual headline rate of consumer price index (CPI) inflation across OECD countries (excluding Türkiye) increased marginally to 2.6%, compared with 2.5% in the previous month (Chart 2). The slight increase in headline inflation was due to less negative energy inflation – at ‑0.8% in October, compared with -2.5% in September – while food and core inflation remained stable. Core inflation, which accounted for 90% of headline inflation in October compared with a median contribution of 64% before the COVID‑19 pandemic, is driven notably by elevated services inflation across advanced economies. As services inflation is in turn closely linked to wage growth, which is expected to ease in 2025 as labour markets cool, headline inflation across OECD economies is expected to normalise further.
Chart 2
OECD CPI inflation
(year-on-year percentage changes)
Sources: Organisation for Economic Co-operation and Development (OECD) and ECB staff calculations.
Notes: The OECD aggregate excludes Türkiye and is calculated using OECD annual weights of the consumer price index (CPI). The latest observations are for October 2024.
Since the October Governing Council meeting, Brent crude oil prices have fallen by 2.9% while European gas prices have risen by 17.7%.[1] Oil prices experienced significant volatility during the review period, owing primarily to geopolitical tensions in the Middle East. On the demand side, strong fuel consumption in the United States added to upward pressure on prices, as US petrol stocks had fallen to their lowest level since November 2022. This was nevertheless offset by the negative impact of weaker demand for oil in China, which contracted for the sixth consecutive month in September. European gas prices have risen by 17.7% since the October Governing Council meeting, driven by both supply and demand factors. On the supply side, the increase can largely be attributed to the impending expiration of the gas transit agreement between Ukraine and Russia at the end of 2024. Additionally, following an arbitration ruling against Gazprom in favour of the Austrian company OMV, Gazprom threatened to halt its gas supplies. On the demand side, reduced wind farm output in November in Europe has led to increased reliance on gas-fired power generation. This, coupled with cold weather, has significantly decreased gas storage levels across Europe, further contributing to rising gas prices. Meanwhile, metal prices have declined (‑4.5%), with China’s stimulus package falling short of expectations. Food prices have increased by 15.9%, driven by supply-related factors.
In the United States, economic activity remains robust. In the third quarter of 2024 real GDP continued to grow at a steady pace of 0.7% quarter on quarter, supported by strong domestic private demand and government consumption. In contrast, the contribution of private investment decelerated, while private inventories and net trade also contributed negatively to growth. The US labour market continued to cool, with the unemployment rate 0.1 percentage points higher at 4.2% in November, up from 3.7% at the start of 2024. Annual wage growth ticked up to 4.0% in October – having declined over the year – and remained above the 3‑3.5% range that the Federal Reserve System considers to be consistent with its inflation target. Headline CPI inflation also increased slightly to 2.6% in October from 2.4% in September, while core inflation remained at 3.3%. The Federal Open Market Committee (FOMC) decided to cut the federal funds rate by 25 basis points at its November meeting, which had been widely expected.[2]
Economic growth momentum in China has strengthened but the new fiscal package is not expected to provide much stimulus. Monthly indicators for October turned out stronger than expected, with significant improvements in retail sales and export growth. The recovery in retail sales – extending into early November – has been largely driven by the ongoing trade-in subsidies, with a notable gain in categories subsidised by the Chinese Government. At the same time the new fiscal package announced on 8 November, while substantial, is not expected to boost growth significantly. Aimed at addressing financial stability risk associated with local government debt, the package mainly represents a migration of debt towards bonds with lower service costs. Since it leaves the overall debt level unchanged, it does not produce a direct fiscal impulse. The potential additional spending associated with lower financing costs is likely to be small, providing only very limited support to growth. Chinese consumer price inflation slowed further in November, easing to 0.2% year on year from 0.3% in September. Producer price inflation remained negative at ‑2.5% in November, heightening deflationary concerns.
Activity in the United Kingdom has continued to slow, while headline inflation has risen owing to higher energy prices. In the third quarter of 2024 UK GDP grew only modestly by 0.1% (quarter on quarter). The Government’s new Autumn Budget entails a 2%‑of‑GDP increase in public spending, which, together with ongoing monetary easing, is expected to gradually support growth dynamics in 2025. Headline inflation increased significantly to 2.3% in October, from 1.7% in September. At its November meeting the Bank of England lowered the Bank Rate by 25 basis points to 4.75%.[3]
2 Economic activity
The economy grew by 0.4% in the third quarter of 2024, after expanding by 0.2% in the second quarter, amid a recovery in consumption and a build-up of inventories, while net trade contracted. Employment rose by 0.2% in the third quarter, implying some recovery in productivity. Across sectors, industrial activity, excluding Irish intellectual property products, continued to decline in the third quarter, reflecting weak demand, competitiveness losses and rising uncertainty. By contrast, the services sector remained in expansion, boosted mainly by non-market and business-related services. Survey indicators point to softening economic activity at the turn of the year. The Purchasing Managers’ Indices (PMIs) for both manufacturing and services have been below their respective third quarter levels in the fourth quarter, while orders and business expectations have declined, implying further weakness at the start of 2025. With regard to domestic demand, private consumption is likely to slow in the fourth quarter, after picking up strongly in the third quarter, as confidence remains low. Also, indicators for housing, business investment and exports suggest continued weakness in the short term. Looking ahead, the projected recovery of real incomes, supported by increased wages and a robust labour market, should allow households to consume more. In addition, foreign demand is expected to strengthen and support euro area exports.
This outlook is broadly reflected in the December 2024 Eurosystem staff macroeconomic projections for the euro area, which foresee annual real GDP growth of 0.7% in 2024, 1.1% in 2025 and 1.4% in 2026 respectively before moderating to 1.3% in 2027.[4]
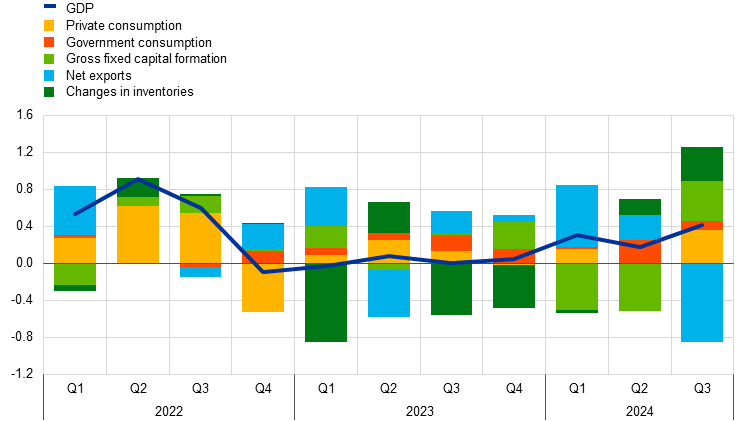
According to Eurostat’s latest estimate, real GDP increased by 0.4%, quarter on quarter, in the third quarter of 2024, having expanded by 0.2% in the second quarter (Chart 3). Domestic demand and changes in inventories made a positive contribution to growth in the third quarter, while net trade contracted. Although growth in total investment in the third quarter was positive, it is estimated to have been negative when excluding an unprecedentedly large increase in non-construction investment in Ireland.
Chart 3
Euro area real GDP and its components
(quarter-on-quarter percentage changes; percentage point contributions)
Sources: Eurostat and ECB calculations.
Note: The latest observations are for the third quarter of 2024.
Survey data point to a weaker fourth quarter of 2024. PMI output fell to 49.2 on average in October and November (from 50.3 in the third quarter), on the back of declines both in services and manufacturing. In the manufacturing sector, the PMI continued to contract in the fourth quarter, with the index now having been in contractionary territory for 20 consecutive months (Chart 4). The PMI for new orders also remains below 50, pointing to a weak short-term outlook for industry. In the services sector, the PMI fell below 50 in November – for the first time since January 2024 – although the average for October and November is still in modest growth territory, at 50.5. The European Commission’s business confidence indicators portray a similar picture. After falling in October, the Economic Sentiment Indicator moved broadly sideways in November, suggesting ongoing headwinds are hampering the recovery. The results of the Commission’s survey on factors limiting production for the fourth quarter show that manufacturing is still affected by insufficient demand and labour shortages, compared with the historical averages, while demand is not seen as a limiting factor in the services sector.
Chart 4
PMI indicators across sectors of the economy
a) Manufacturing | b) Services |
|---|---|
(diffusion indices) | (diffusion indices) |
 |  |
Source: S&P Global Market Intelligence.
Note: The latest observations are for November 2024.
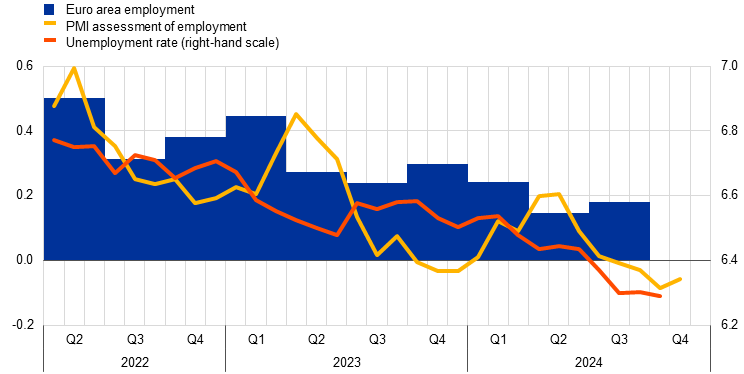
Employment increased by 0.2% in the third quarter of 2024. This was broadly the same rate as in the first half of the year (Chart 5). Employment growth was more aligned with GDP growth in the third quarter, allowing for some recovery in productivity, which rose by 0.2%.[5] Total hours worked were unchanged in the third quarter, leading to a 0.1% decline in average hours worked. The unemployment rate stood at 6.3% in October, the same as in September, remaining at its lowest level since the euro was introduced. Labour demand has declined somewhat from the high levels seen after the pandemic, with the job vacancy rate falling to 2.5% in the third quarter, 0.1 percentage points lower than in the previous quarter and closer to its pre-pandemic peak.
Chart 5
Euro area employment, PMI assessment of employment and unemployment rate
(left-hand scale: quarter-on-quarter percentage changes, diffusion index; right-hand scale: percentages of the labour force)
Sources: Eurostat, S&P Global Market Intelligence and ECB calculations.
Notes: The two lines indicate monthly developments, while the bars show quarterly data. The PMI is expressed in terms of the deviation from 50, then divided by 10 to gauge the quarter-on-quarter employment growth. The latest observations are for the third quarter of 2024 for euro area employment, November 2024 for the PMI assessment of employment and October 2024 for the unemployment rate.
Short-term labour market indicators point to stable employment in the fourth quarter of 2024. The monthly composite PMI employment indicator increased slightly from 49.2 in October to 49.4 in November, suggesting that employment in the fourth quarter is likely to be broadly unchanged. The PMI services indicator increased from 50.3 in October to 51.0 in November, while the PMI manufacturing and construction indicators remained in contractionary territory.
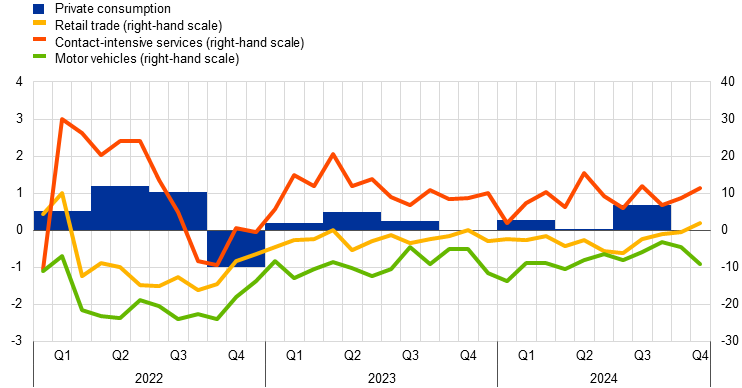
Private consumption rose strongly in the third quarter but is expected to moderate at the turn of the year. After weak average growth in the previous quarters, private consumption in the euro area increased by 0.7%, quarter on quarter, in the third quarter (Chart 6), probably boosted by temporary factors such as the Paris 2024 Olympic and Paralympic Games – albeit to a limited extent. The consumption of goods rebounded and increased broadly in line with consumption of services in the third quarter, as also suggested by a 1% rise in retail sales, quarter on quarter, in the third quarter, compared with the more modest rise of 0.2% in services production. However, incoming data suggest that household spending is likely to have moderated in the fourth quarter, as retail sales declined in October. The European Commission’s consumer confidence indicator also fell back towards its September level in November. Nevertheless, more forward-looking indicators point to a recovery in the quarters ahead, as reflected in the latest Eurosystem staff macroeconomic projections.[6] The European Commission’s indicators of business expectations for demand in contact-intensive services continued to improve in November, while the ECB’s latest Consumer Expectations Survey also showed that expected holiday purchases remain at a high level, despite some recent softening. Consumer expectations for major purchases in the next 12 months improved further in November, rising above their pre-pandemic levels and indicating an increase in consumer demand for goods. Higher purchasing power and continued rises in real labour income are expected to support consumption in the quarters ahead. At the same time, uncertainty remains elevated and households may continue to have concerns about longer-term geopolitical issues, which could have an adverse impact on their spending decisions (see Box 3).
Chart 6
Private consumption and business expectations for retail trade, contact-intensive services and motor vehicles
(quarter-on-quarter percentage changes; net percentage balances)
Sources: Eurostat, European Commission and ECB calculations.
Notes: Business expectations for retail trade (excluding motor vehicles), expected demand for contact-intensive services and expected sales of motor vehicles for the next three months refer to net percentage balances; “contact-intensive services” refers to accommodation, travel and food services. The latest observations are for the third quarter of 2024 for private consumption and November 2024 for business expectations for retail trade, contact-intensive services and motor vehicles.
Business investment contracted notably in the third quarter of 2024 and is likely to remain muted in the near term. Having shown modest growth in the first half of the year, non-construction investment, excluding Irish intangible investment, fell by 1.1%, quarter on quarter, in the third quarter. Investment growth in the fourth quarter is set to have continued to contract, as suggested by the PMI output and orders indicators and the European Commission’s confidence surveys for the capital goods sector up to November (Chart 7, panel a). The Commission’s latest survey on factors limiting production in the capital goods sector revealed weak demand and little need for further investment in equipment in the fourth quarter. The elevated uncertainty surrounding geopolitics, trade tariffs and economic policy is further dampening investment (see Box 3). In this environment, bankruptcies have continued to rise, standing about 23% higher than their 2019 levels in the third quarter of 2024. Looking ahead, investment is expected to gradually increase as the impact of tight financing conditions diminishes, demand improves, and green and digital investment plans are implemented.
Chart 7
Real investment dynamics and survey data
a) Business investment | b) Housing investment |
|---|---|
(quarter-on-quarter percentage changes; diffusion indices and mean-adjusted) | (quarter-on-quarter percentage changes; percentage balances and diffusion index) |
 |  |
Sources: Eurostat, European Commission (EC), S&P Global Market Intelligence and ECB calculations.
Notes: Lines indicate monthly developments, while bars refer to quarterly data (apart from the survey data for factors limiting production, which are also quarterly). The PMIs are expressed in terms of the deviation from 50. In panel a), business investment is measured by non-construction investment excluding Irish intangibles. Short-term indicators refer to the capital goods sector. “Limits to production from demand” is expressed as the average over the period from the first quarter of 1991 to the fourth quarter of 2019 and then inverted. The latest observations are for the third quarter of 2024 for business investment and November 2024 for all other items. In panel b), the line for the European Commission’s activity trend indicator refers to the weighted average of the building and specialised construction sectors’ assessment of the trend in activity compared with the preceding three months, rescaled to have the same standard deviation as the PMI. The line for PMI output refers to housing activity. The latest observations are for the third quarter of 2024 for housing investment and November 2024 for PMI output and the European Commission’s activity trend.
Housing investment fell slightly in the third quarter of 2024 and is expected to continue to decline in the short term. Housing investment in the euro area edged down by 0.2% in the third quarter, while production in building and specialised construction fell by 0.6%. Survey-based activity indicators point to further weakening in the fourth quarter of 2024, as both the PMI indicator for housing production and the European Commission’s indicator for building and specialised construction activity in the last three months remained in contractionary territory up to November (Chart 7, panel b). However, housing investment should stabilise in the course of 2025. According to the European Commission’s survey, the short-term intention of households to buy or build a house has improved further in the fourth quarter of 2024. Similarly, the ECB’s Consumer Expectations Survey shows that the proportion of households that consider housing as a good investment has significantly increased in 2024 overall, although it declined slightly in October. This improvement in sentiment is supported by falling mortgage rates and is reflected in a gradual recovery in housing loans, as also shown in the October euro area bank lending survey.
Euro area export growth continued to slow in the third quarter of 2024. Total euro area export growth slowed by 1.5%, quarter on quarter, in the third quarter. This deceleration confirms the persisting competitiveness challenges facing euro area exporters, even amid a recovery in global demand. Looking ahead, surveys suggest that the performance of exports will continue to be subdued in the near term. The latest PMIs for export orders remained well below the no-growth threshold in November for manufacturing and point to increasing weakness in services. At the same time, import growth saw a moderate increase of 0.2% in the third quarter, compared with the previous quarter, on the back of a modest rise in domestic consumption. Overall, net exports made a negative contribution of 0.9 percentage points to GDP in the third quarter.
Looking ahead, the euro area economy is expected to continue its gradual recovery over the projection horizon, albeit amid significant uncertainty. Following an estimated GDP increase of 0.7% in 2024, activity growth is expected to strengthen over the next three years. In particular, rising real wages and employment, in a context of robust – albeit softening – labour markets, are expected to support a sustained recovery in consumption. Domestic demand should also be bolstered by easing financing conditions, in line with market expectations for the future path of interest rates.
The economic recovery is now expected to be slower than anticipated in the September 2024 projections. Although growth picked up in the third quarter of this year, survey indicators suggest it has slowed in the current quarter. According to the December 2024 projections, the economy is expected to grow by 0.7% in 2024, 1.1% in 2025, 1.4% in 2026 and 1.3% in 2027. The projected recovery rests mainly on rising real incomes – which should allow households to consume more – and firms increasing investment. Over time, the gradually fading effects of restrictive monetary policy should support a pick-up in domestic demand.
3 Prices and costs
Euro area headline inflation increased to 2.3% in November 2024, up from 2.0% in October, primarily reflecting a rise in energy inflation.[7] At the same time, underlying inflation is overall developing in line with a sustained return to the 2% medium-term target for headline inflation. The indicator of domestic inflation edged down in October but remains high, reflecting strong wage growth and the fact that the prices of some items are still adjusting to the past inflation surge with a substantial delay. The overall rate of growth in labour costs is moderating, while unit profit growth continues to partially buffer the impact of still elevated labour cost pressures and thereby support the ongoing disinflation. Over the review period, most indicators of longer-term inflation expectations remained broadly stable at around 2%, and market-based measures fell closer to this level. The December 2024 Eurosystem staff macroeconomic projections for the euro area foresee headline inflation averaging 2.4% in 2024, 2.1% in 2025, 1.9% in 2026 and 2.1% in 2027 when the expanded EU Emissions Trading System becomes operational.[8]
Euro area headline inflation, as measured in terms of the Harmonised Index of Consumer Prices (HICP), increased further to 2.3% in November 2024, up from 2.0% in October (Chart 8). This was primarily attributable to the expected increase in energy inflation, which rose to ‑1.9% in November, up from ‑4.6% in October, owing mainly to an upward base effect. Food inflation fell slightly to 2.8% in November, down from 2.9% in October, reflecting a lower annual rate of change in unprocessed food prices, while the annual rate of change in processed food prices increased marginally. HICP inflation excluding energy and food (HICPX) stood at 2.7% in November, unchanged from October and September. This was due to a small decline in services inflation (3.9% in November, down from 4.0% in October) being offset by an increase in non-energy industrial goods (NEIG) inflation (0.7% in November, up from 0.5% in October). The annual rate of NEIG inflation remained close to its long-term average of 0.6% before the COVID-19 pandemic, while the more persistent services inflation reflects the impact of still elevated wage pressures in some of its items and the effects of lagged repricing in others.
Chart 8
Headline inflation and its main components
(annual percentage changes; percentage point contributions)

Sources: Eurostat and ECB calculations.
Notes: “Goods” stands for NEIG inflation. The latest observations are for November 2024 (flash estimate).
Most measures of underlying inflation suggest that inflation will settle at around the 2% medium-term target on a sustained basis, and the range of values across them has narrowed (Chart 9). In October 2024 – the latest month for which data are available – the bulk of the indicator values ranged from 2.0% to 2.8%.[9] The Persistent and Common Component of Inflation (PCCI), which tends to perform best as a predictor of future headline inflation, was at the bottom of this range, while the Supercore indicator, which comprises HICP items that are sensitive to the business cycle, was unchanged at 2.8%. HICPX inflation excluding travel-related items, clothing and footwear (HICPXX) also remained unchanged, at 2.6%, whereas the 10% and 30% trimmed means, which remove 5% and 15% of the annual rates of change from each tail of the distribution of HICP items respectively, both increased slightly. While it remained at a persistently high level, the indicator for domestic inflation fell slightly further to 4.2%, down from 4.3% and 4.4% in September and August respectively. This reflects the strong weight of services items such as insurance and rents, for which reactions to general inflationary pressures and the dampening of monetary policy restraint propagate more slowly.
Chart 9
Indicators of underlying inflation
(annual percentage changes)

Sources: Eurostat and ECB calculations.
Notes: The grey dashed line represents the ECB’s inflation target of 2% over the medium term. The latest observations are for November 2024 (flash estimate) for HICPX, HICP excluding energy and HICP excluding unprocessed food and energy, and for October 2024 for all other indicators.
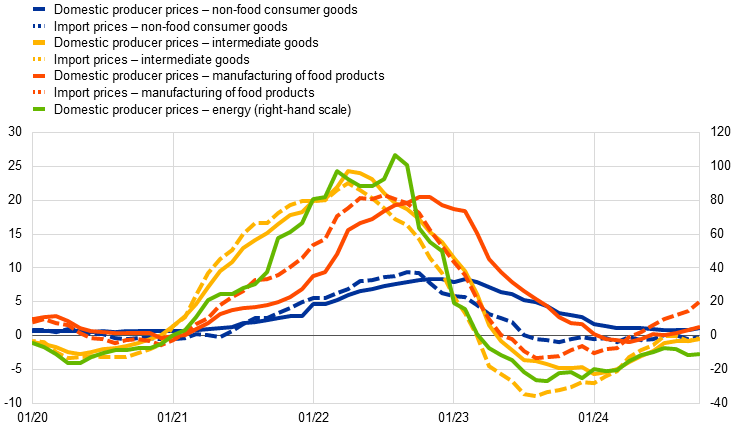
Pipeline pressures increased in October, although they remained moderate across all industry categories (Chart 10). At the early stages of the pricing chain, producer price inflation for energy, which has been negative since April 2023, edged up to ‑11.2% in October 2024 from ‑11.5% in September. The annual growth rate of producer prices for domestic sales of intermediate goods also remained negative, albeit less so than in the previous month (‑0.5% in October, up from ‑0.8% in September). Similarly, the corresponding annual growth rate of import prices for intermediate goods stood at ‑0.4% in October, up from ‑0.8% in September. At the later stages of the pricing chain, domestic producer price inflation for non-food consumer goods rose to 1.1% in October, up from 0.9% in September. There was also an increase in both domestic producer price inflation for the manufacturing of food products, which went up to 1.3% in October from 0.9% in September, and import price inflation for the manufacturing of food products, which climbed to 4.9% in October, possibly driven by the recent double-digit growth rates of international food commodity prices. Overall, pipeline pressures increased across all industry categories, albeit from still moderate levels, indicating an end to the easing of the pipeline pressures that had accumulated as a result of earlier cost shocks.
Chart 10
Indicators of pipeline pressures
(annual percentage changes)
Sources: Eurostat and ECB calculations.
Note: The latest observations are for October 2024.
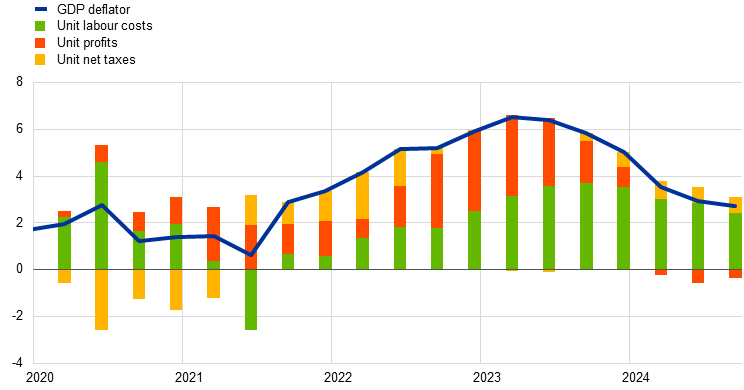
Domestic cost pressures, as measured by growth in the GDP deflator, fell further in the third quarter of 2024, albeit remaining at a high level (Chart 11). The annual growth rate of the GDP deflator declined to 2.7% in the third quarter of 2024, down from 2.9% in the previous quarter. This decrease reflected a smaller contribution from unit labour costs, while the contribution from unit net taxes was unchanged and that of unit profits rose slightly. Despite increasing, unit profit growth remained in negative territory, indicating that it is continuing to buffer still elevated labour cost pressures. The reduced contribution from unit labour costs was due to a decline in wage growth, measured in terms of compensation per employee, which fell from 4.7% in the second quarter of 2024 to 4.4% in the third quarter. A similar decrease was recorded for growth in compensation per hour. By contrast, negotiated wage growth increased to 5.4% in the third quarter of 2024, up from 3.5% in the second quarter, but data on the latest wage agreements in the ECB’s forward-looking wage tracker point to weaker growth in the fourth quarter of 2024.[10] Overall, the latest wage developments indicate that compensation for past high inflation and the corresponding real wage catch-up are playing a declining role. The December 2024 Eurosystem staff macroeconomic projections expect growth in compensation per employee to stand at 4.6% on average for 2024 and to continue moderating to 2.8% in 2027. However, it is expected to remain above historical levels owing to continuing tight labour markets and remaining inflation compensation.
Chart 11
Breakdown of the GDP deflator
(annual percentage changes; percentage point contributions)
Sources: Eurostat and ECB calculations.
Notes: The latest observations are for the third quarter of 2024. Compensation per employee contributes positively to changes in unit labour costs, and labour productivity contributes negatively.
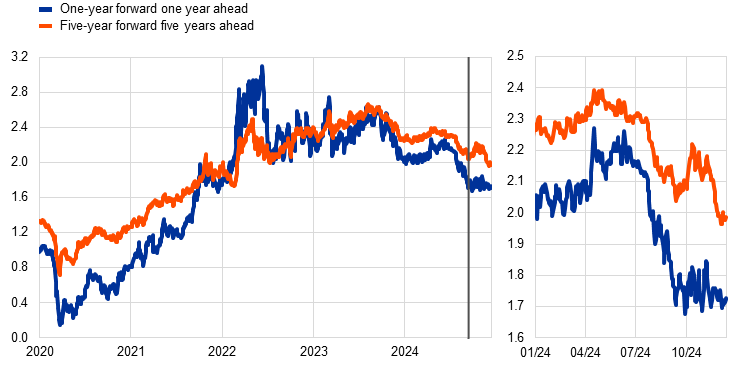
Most measures of longer-term inflation expectations stand at around 2%, and market-based indicators of medium to longer-term inflation compensation have declined measurably since the Governing Council’s meeting on 17 October 2024 (Chart 12). In both the ECB Survey of Professional Forecasters for the fourth quarter of 2024 and the ECB Survey of Monetary Analysts for December 2024, average and median longer-term inflation expectations remained at 2%. Shorter-term survey expectations for 2025 also stood at around 2%, but saw small movements depending on the incorporation of the latest data outcomes and movements in energy commodity prices. There was an increase in market-based measures of near-term inflation compensation, as measured by inflation fixings (based on the HICP excluding tobacco). This suggests that market participants expect inflation to stand slightly above 2% at the turn of the year, before reaching approximately 2% in 2025 and falling to slightly below 2% in 2026. The one-year forward inflation-linked swap rate one year ahead remained broadly unchanged at around 1.7% over the review period. Looking at the medium and longer term, market-based measures of inflation compensation declined slightly to around 2%. Specifically, the five-year forward inflation-linked swap rate five years ahead fell by 5 basis points over the review period, mostly on account of lower inflation risk premia. Model-based estimates of genuine inflation expectations, excluding inflation risk premia, also indicate that market participants continue to expect inflation to be around 2% in the longer term. On the consumer side, inflation expectations remained broadly stable. According to the ECB’s Consumer Expectations Survey (CES) for October 2024, median expectations for headline inflation over the next 12 months increased slightly to 2.5%, up from 2.4% in September, while expectations for three years ahead remained unchanged at 2.1%. Inflation perceptions over the previous 12 months declined further to 3.2% in October and have therefore fallen by more than 5 percentage points from their peak of 8.4% in September 2023.
Chart 12
Market-based measures of inflation compensation and consumer inflation expectations
a) Market-based measures of inflation compensation
(annual percentage changes)
b) Headline HICP inflation and ECB Consumer Expectations Survey
(annual percentage changes)

Sources: LSEG, Eurostat, CES and ECB calculations.
Notes: Panel a) shows forward inflation-linked swap rates over different horizons for the euro area. The vertical grey line indicates the start of the review period on 12 September 2024. In panel b), the dashed lines show the mean rate and the solid lines the median rate. The latest observations are for 11 December 2024 for the forward rates, November 2024 (flash estimate) for the HICP and October 2024 for all other measures.
The December 2024 Eurosystem staff macroeconomic projections expect headline inflation to average 2.4% in 2024 and to decline further to 2.1% in 2025 and 1.9% in 2026, before rising to 2.1% in 2027 when the expanded EU Emissions Trading System becomes operational (Chart 13). Headline inflation is projected to increase slightly in the last quarter of 2024, owing mainly to base effects in energy prices, before starting to fall again. It is then expected to gradually ease further over the coming years, as inflation compensation pressures in a tight labour market continue to fade and wage growth declines as a result. The projected increase in headline inflation in 2027 mainly reflects a largely temporary upward impact from the implementation of the EU’s Fit for 55 package – specifically a new Emissions Trading System (ETS2) for heating of buildings and for transport fuels. Compared with the September 2024 projections, the outlook for headline inflation has been revised down slightly by 0.1 percentage points for 2024 and 2025, mainly owing to downward data surprises and lower oil and electricity price assumptions. At the same time, Eurosystem staff continue to expect a rapid decline in core inflation, from 2.9% in 2024 to 2.3% in 2025 and 1.9% in 2026 and 2027, primarily driven by a decrease in services inflation. Compared with the September 2024 projections, HICPX inflation has been revised down by 0.1 percentage points for 2026.
Chart 13
Euro area HICP and HICPX inflation
(annual percentage changes)
Sources: Eurostat and Eurosystem staff macroeconomic projections for the euro area, December 2024.
Notes: The grey vertical line indicates the last quarter before the start of the projection horizon. The latest observations are for the third quarter of 2024 for the data and the fourth quarter of 2027 for the projections. The December 2024 Eurosystem staff macroeconomic projections for the euro area were finalised on 27 November 2024, and the cut-off date for the technical assumptions was 20 November 2024. Both historical and projected data for HICP and HICPX inflation are reported at a quarterly frequency.
4 Financial market developments
During the review period from 12 September to 11 December 2024 important factors behind financial market developments included the market assessment of the implications of the US presidential elections and ongoing geopolitical tensions. Euro area short-term risk-free interest rates shifted downwards, reflecting expectations of deeper and more rapid cuts in the key ECB interest rates as markets observed weaker euro area macroeconomic data releases. Markets fully priced in a rate cut of 25 basis points at the December Governing Council meeting. Euro area long-term risk-free interest rates also declined, primarily reflecting a fall in the real rate component. Sovereign bond yields decreased by less than risk-free swap rates, with some differences across countries amid the uncertain political and fiscal outlook in some of them. Euro area equity prices fluctuated over the review period and ended the period somewhat higher. Corporate bond spreads tightened at the beginning of the review period but edged up thereafter. In foreign exchange markets, the euro depreciated against the US dollar and somewhat less in trade-weighted terms.
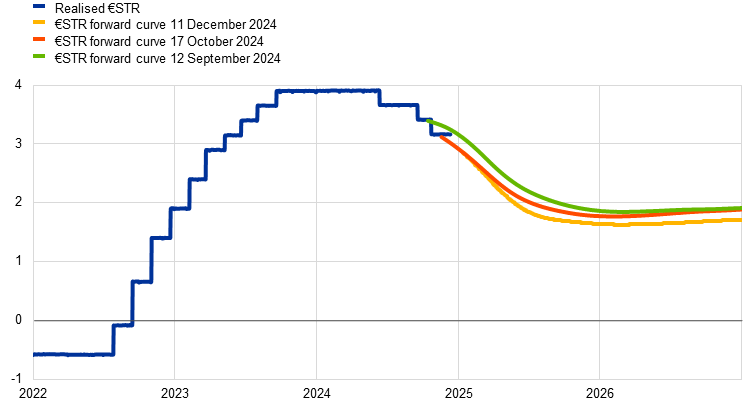
Following the September Governing Council meeting the overnight index swap (OIS) forward curve shifted downwards as market participants expected faster and deeper cumulative policy rate cuts (Chart 14). The benchmark euro short-term rate (€STR) averaged 3.3% over the review period, after the Governing Council lowered the deposit facility rate by 25 basis points at both its September and October meetings. Excess liquidity decreased by around €155 billion between 12 September and 11 December, to stand at €2,912 billion. This mainly reflected repayments in September of funds borrowed in the third series of targeted longer-term refinancing operations (TLTRO III) and the decline in the portfolios of securities held for monetary policy purposes, with the Eurosystem no longer reinvesting the principal payments from maturing securities in the asset purchase programme (APP) portfolio and only partially reinvesting principal payments in the pandemic emergency purchase programme (PEPP) portfolio. The €STR-based OIS forward curve shifted downwards compared with the time of the September Governing Council meeting, suggesting a lower path for policy rates amid weaker euro area macroeconomic data releases and the outcome of the US elections. On 11 December markets were fully pricing in a 25 basis point rate cut at the December Governing Council meeting. Looking further ahead, the forward curve moved downwards, from pricing in 123 basis points of cumulative interest rate cuts in the period up to June 2025 (on 12 September) to pricing in 133 basis points of cumulative cuts (on 11 December).
Chart 14
(percentages per annum)
Sources: Bloomberg and ECB calculations.
Note: The forward curve is estimated using spot OIS (€STR) rates.
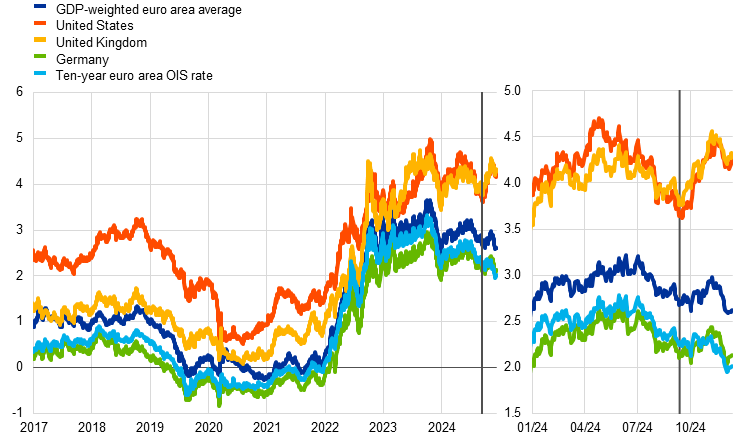
Euro area long-term risk-free rates have also declined since the September Governing Council meeting, in contrast to their US counterparts (Chart 15). The ten-year euro area OIS rate fell by 26 basis points in the review period, ending the period at around 2.0%. This decline in long-term risk-free rates mainly reflected the fall in the real rate component. Domestic monetary policy expectations and macroeconomic data releases weighed on euro area risk-free rates, while US and global spillovers counterbalanced the negative effects at longer maturities. By contrast, US long-term risk-free rates increased significantly over the review period, supported by both higher real rates and higher inflation compensation. In particular, the ten-year US Treasury yield increased by around 60 basis points to 4.3%. As a result, the differential between ten-year risk-free rates in the euro area and the United States widened by 85 basis points. The ten-year UK sovereign bond yield also increased by 54 basis points and stood at around 4.3% at the end of the review period.
Chart 15
Ten-year sovereign bond yields and the ten-year OIS rate based on the €STR
(percentages per annum)
Sources: LSEG and ECB calculations.
Notes: The vertical grey line denotes the start of the review period on 12 September 2024. The latest observations are for 11 December 2024.
Euro area sovereign bond yields declined by less than risk-free rates, resulting in somewhat wider spreads (Chart 16). At the end of the review period the ten-year GDP-weighted euro area sovereign bond yield stood about 10 basis points lower, at around 2.6%, leading to an increase of 15 basis points in its spread over the OIS rate. A large part of the spread widening took place before the US elections, continuing the trend since 2022. After the elections, the spread widened more quickly, as higher US treasury yields spilled over to euro area sovereign bond markets. The German ten-year sovereign spread also increased by 23 basis points over the review period, continuing a trend which, among other things, reflected lower Eurosystem bond holdings. During the review period the German spread turned positive for the first time since 2016, while the announcement of snap elections in Germany did not have a significant effect. More notable changes were observed for the French ten-year sovereign bond yield, which increased by around 5 basis points on the back of uncertainty regarding the French fiscal outlook and widened the spread over the ten-year OIS rate by 30 basis points. However, spillovers to Greece, Spain, Italy and Portugal were limited, given the more positive sentiment surrounding the fiscal outlook for some of these countries. Overall, the sovereign bond yield to OIS spread declined by 9 basis points for Italy, while widening by 4 and 6 basis points for Portugal and Spain respectively.
Chart 16
Ten-year euro area sovereign bond spreads vis-à-vis the ten-year OIS rate based on the €STR
(percentage points)

Sources: LSEG and ECB calculations.
Notes: The vertical grey line denotes the start of the review period on 12 September 2024. The latest observations are for 11 December 2024.
Corporate bond spreads tightened at the beginning of the review period and then edged up, in part following movements in stock markets. Spreads of investment-grade corporate bonds tightened by about 10 basis points until mid-October but subsequently widened somewhat. The tightening was more pronounced for financial than for non-financial corporate bonds, with the spreads of the latter widening slightly overall. In the high-yield segment, spreads fluctuated more significantly, especially from mid-October, but decreased moderately overall.
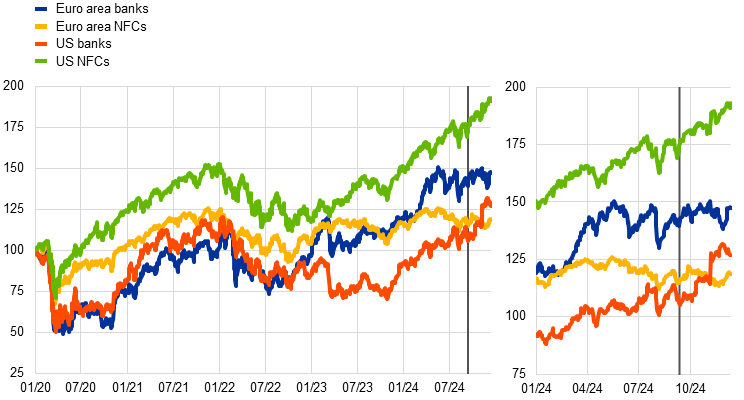
Euro area equity prices fluctuated over the review period and ended the period somewhat higher than at the time of the September Governing Council meeting (Chart 17). Euro area equity prices were supported by a marked increase in risk appetite at the beginning of the review period that more than offset downward revisions in expected earnings. From mid-October, the deterioration in the outlook for the euro area economy, as reflected for example in Purchasing Managers’ Index readings for November, led to a further decline in expected earnings. Broad stock market indices in the euro area retreated towards levels observed at the start of the review period before accelerating again at the end of November, also supported by an improvement in risk appetite. Overall, equity prices for non-financial corporations (NFCs) and banks increased by 2.5% and 3.7% respectively. In the United States, NFC and bank equity prices strengthened by 9.8% and 20.6% respectively.
Chart 17
Euro area and US equity price indices
(index: 1 January 2020 = 100)
Sources: LSEG and ECB calculations.
Notes: The vertical grey line denotes the start of the review period on 12 September 2024. The latest observations are for 11 December 2024.
In foreign exchange markets, the euro depreciated by 4.6% against the US dollar and by 2.0% in trade-weighted terms (Chart 18). During the review period, the nominal effective exchange rate of the euro – as measured against the currencies of 41 of the euro area’s most important trading partners – weakened by 2.0%. The euro also depreciated against the US dollar (by 4.6%), which was largely driven by an upward shift, in early November, in market participants’ expectations for the path of the Federal Reserve System’s policy rate following the US presidential elections, as well as expectations of potential changes in US trade, regulatory and fiscal policies. The euro depreciated by 2.4% against the pound sterling and by 1.4% against the Swiss franc, as well as against some emerging market currencies, reflecting changes in market participants’ views on the relative outlooks for the respective economies. The euro appreciated against the Japanese yen (by 2.1%), as the latter resumed its broad-based depreciation amid persistently lower policy rates in Japan than in other advanced economies.
Chart 18
Changes in the exchange rate of the euro vis-à-vis selected currencies
(percentage changes)

Source: ECB calculations.
Notes: EER-41 is the nominal effective exchange rate of the euro against the currencies of 41 of the euro area’s most important trading partners. A positive (negative) change corresponds to an appreciation (depreciation) of the euro. All changes have been calculated using the foreign exchange rates prevailing on 11 December 2024.
5 Financing conditions and credit developments
Recent and anticipated ECB policy rate cuts are gradually making it less expensive for firms and households to borrow. In October 2024 bank funding costs and bank lending rates continued to decline from their peak levels, although financing conditions still remained tight. The average interest rates on new loans to firms and on new mortgages fell in October to 4.7% and 3.6% respectively. Growth in loans to firms and households remained subdued, reflecting weak economic growth and still tight credit standards. Over the period from 12 September to 11 December 2024, the cost to firms of both market-based debt and equity financing fell, coinciding with an easing of the long-term risk-free interest rate and a lowering of the equity risk premium. In the latest Survey on Access to Finance of Enterprises (SAFE), firms reported that the availability of bank loans remained on balance broadly unchanged in the third quarter of 2024, with few expecting improved availability in the fourth quarter. The annual growth rate of broad money (M3) continued to recover from low levels, with net foreign inflows still the primary contributor to growth.
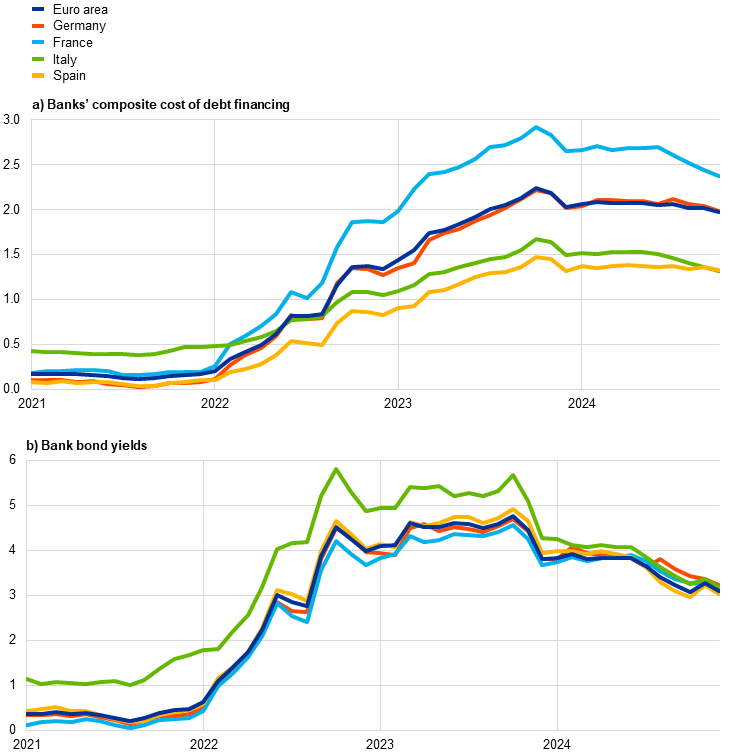
Euro area bank funding costs have declined from their peak levels, reflecting the ECB’s recent policy rate cuts and the expected interest rate path. The composite cost of debt financing for euro area banks declined slightly in October 2024, standing at 2.0% (Chart 19, panel a). The decline in bank funding costs resulted primarily from a decrease in bank bond yields (Chart 19, panel b), against the backdrop of a fall in longer-term risk-free rates. High bank funding costs have persisted, however, amid the ongoing shift in the composition of funding towards more expensive sources. Average deposit rates diminished only slightly in the third quarter of 2024, with the composite deposit rate standing at 1.3% in October. Interest rates on time deposits fell more sharply than on overnight deposits and deposits redeemable at notice, which saw just a marginal decline over that period.
Chart 19
Composite bank funding costs in selected euro area countries
(annual percentages)
Sources: ECB, S&P Dow Jones Indices LLC and/or its affiliates, and ECB calculations.
Notes: Composite bank funding costs are a weighted average of the composite cost of deposits and unsecured market-based debt financing. The composite cost of deposits is calculated as an average of new business rates on overnight deposits, deposits with an agreed maturity and deposits redeemable at notice, weighted by their respective outstanding amounts. Bank bond yields are monthly averages for senior tranche bonds. The latest observations are for October 2024 for the composite cost of debt financing for banks (panel a) and for 11 December 2024 for bank bond yields (panel b).
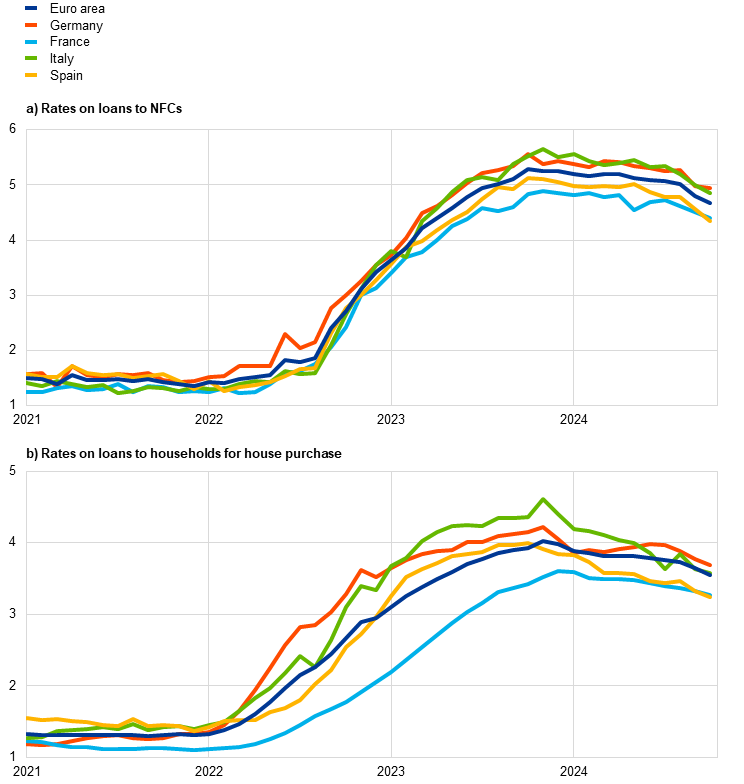
Bank lending rates for firms and for households declined further, but financing conditions remain restrictive. Lending rates for firms and for households have fallen over recent months, supporting a gradual recovery in lending (Chart 20). In October 2024 lending rates for new loans to non-financial corporations (NFCs) fell by 22 basis points to stand at 4.68%, some 60 basis points below their October 2023 peak (Chart 20, panel a), although with some variation across euro area countries and maturities. The spread between interest rates on small and large loans to firms narrowed again in October, falling to 0.34%, which is close to the low reached in summer 2024. Across maturities, the largest decline was seen for loans with intermediate fixation periods (of between 1 and 5 years). Lending rates on new loans to households for house purchase stood at 3.55% in October, down from 3.64% in September, and now stand around 50 basis points below their November 2023 peak (Chart 20, panel b), with variation across countries. The decline was broad-based across fixation periods and in line with markets rates, with variable rate mortgages remaining more expensive than those granted at fixed rates.
Chart 20
Composite bank lending rates for firms and households in selected euro area countries
(annual percentages)
Sources: ECB and ECB calculations.
Notes: NFCs stands for non-financial corporations. Composite bank lending rates are calculated by aggregating short and long-term rates using a 24-month moving average of new business volumes. The latest observations are for October 2024.
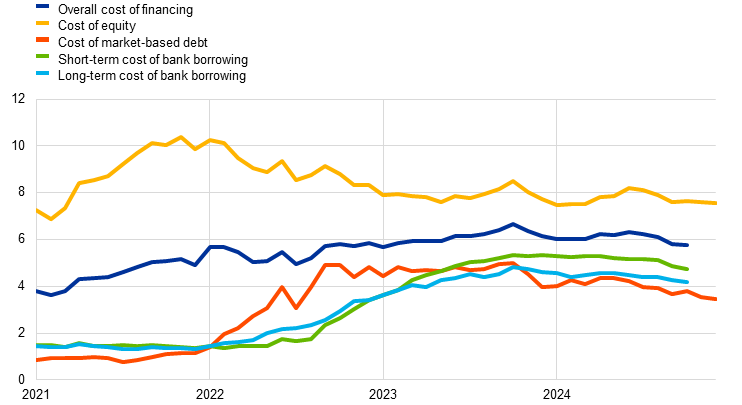
Over the period from 12 September to 11 December 2024, the cost to firms of both market-based debt and equity financing fell. Based on the monthly data, available until October, the overall cost of financing for NFCs – i.e. the composite cost of bank borrowing, market-based debt and equity – was unchanged in October compared with the previous month and stood at 5.8%, still below the multi-year high reached in October 2023 (Chart 21).[11] While the cost of equity financing remained virtually unchanged in that month, the slight rise in the cost of market-based debt was fully offset by the fall in the cost of bank borrowing. Daily data covering the period from 12 September to 11 December 2024 show that the cost of both market-based debt and equity financing declined. The easing of the cost of market-based debt was driven by the significant downward shift of the overnight index swap (OIS) curve at all maturities of up to fifteen years, notwithstanding a slight widening of the spreads on bonds issued by NFCs in the investment grade segment. The reduction in the cost of equity financing resulted from both a lower equity risk premium and a fall in the long-term risk-free rate – as approximated by the ten-year OIS rate.
Chart 21
Nominal cost of external financing for euro area firms, broken down by component
(annual percentages)
Sources: ECB, Eurostat, Dealogic, Merrill Lynch, Bloomberg, LSEG and ECB calculations.
Notes: The overall cost of financing for non-financial corporations (NFCs) is based on monthly data and is calculated as a weighted average of the long and short-term cost of bank borrowing (monthly average data), market-based debt and equity (end-of-month data), based on their respective outstanding amounts. The latest observations are for 11 December 2024 for the cost of market-based debt and the cost of equity (daily data), and for October 2024 for the overall cost of financing and the cost of borrowing from banks (monthly data).
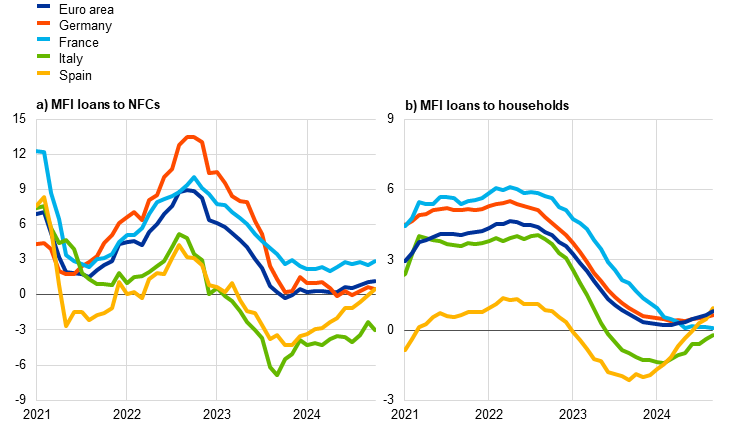
The growth rate for bank loans to firms and households remained subdued, reflecting weak economic growth and still tight credit standards. Bank lending to firms has gradually picked up from low levels and increased to 1.2% in October 2024, up from 1.1% in September (Chart 22, panel a). Corporate debt borrowing remained at 1.6% in October, the positive net issuance of debt securities by firms not fully counterbalancing weak bank lending. The annual growth rate of loans to households edged up to 0.8% in October, from 0.7% in September, amid improvements in the short-term dynamics (Chart 22, panel b). Mortgage lending has stabilised from its earlier declines and is showing initial signs of a recovery. Consumer credit growth also increased in October, while other lending is still contracting, albeit at a decelerating pace. The ECB’s Consumer Expectations Survey in October 2024 provides evidence of growth in consumer credit being concentrated among lower income households. Additionally, the percentage of households who perceived credit access to have been tighter still outweighs that perceiving credit access to have been easier (+14% in September).
Chart 22
MFI loans in selected euro area countries
(annual percentage changes)
Sources: ECB and ECB calculations.
Notes: Loans from monetary financial institutions (MFIs) are adjusted for loan sales and securitisation; in the case of non-financial corporations (NFCs), loans are also adjusted for notional cash pooling. The latest observations are for October 2024.
In the Survey on Access to Finance of Enterprises (SAFE), firms reported that the availability of bank loans in the third quarter of 2024 had, on balance, remained broadly unchanged, with few expecting a positive change in the fourth quarter (Chart 23). The net percentage of firms reporting improved availability of bank loans was 1% in the third quarter of 2024, down from 2% in the previous quarter. This slight decline in the net percentage as compared with the previous quarter was attributable to large firms, while small and medium-sized enterprises (SMEs), on average, reported no change. A net 2% of firms expected access to bank loans to improve over the fourth quarter of 2024. While, on net, SMEs do not anticipate any change in the availability of loans, large firms expected to see an improvement in external/loan financing.
Firms also signalled a small reduction in the need for bank loans. In the third quarter of 2024 a net 2% of firms, primarily SMEs, reported lower bank loan needs, while a small net share of large firms indicated an increased need. As a result, the financing gap for bank loans – the estimated difference between the change in needs and availability – was negative for a net 2% of firms, this gap being similar for SMEs and large firms alike. While large firms had signalled a very modest negative financing gap already in the second quarter of 2024, this was not the case for SMEs until the third quarter.
Chart 23
Changes in euro area firms’ bank loan needs, current and expected availability and financing gap
(net percentages of respondents)
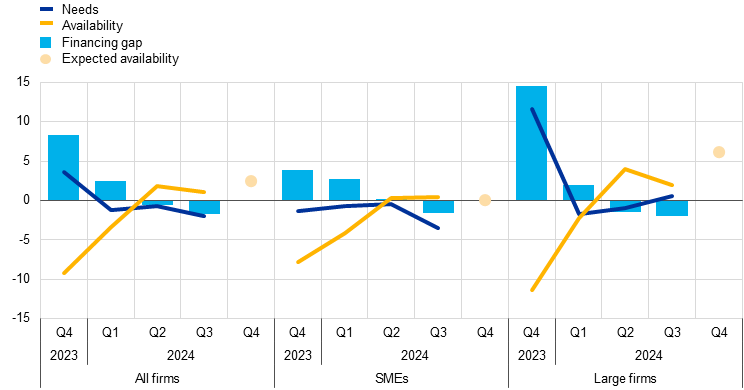
Sources: Survey on Access to Finance of Enterprises (SAFE) and ECB calculations.
Notes: SMEs stands for small and medium-sized enterprises. Net percentages are the difference between the percentage of firms reporting an increase in availability of bank loans (needs and expected availability respectively) and the percentage reporting a decrease in availability in the past three months. The financing gap indicator combines both financing needs and the availability of bank loans at firm level. The indicator of the perceived change in the financing gap takes a value of 1 (-1) if the need increases (decreases) and availability decreases (increases). If firms perceive only a one-sided increase (decrease) in the financing gap, the variable is assigned a value of 0.5 (-0.5). A positive value for the indicator points to a widening of the financing gap. Values are multiplied by 100 to obtain weighted net balances in percentages. The figures refer to rounds 29 (pilot round from October to December 2023) to 32 of the SAFE (June-September 2024).
The annual growth rate of broad money (M3) in the euro area continued to recover, with net foreign inflows still the main contributor to money creation. Annual M3 growth increased to 3.4% in October 2024, up from 3.2% in September (Chart 24). Annual growth of narrow money (M1) – which comprises the most liquid assets of M3 – turned positive for the first time since December 2022, rising to 0.2% in October compared with ‑1.3% in September. The annual growth rate of overnight deposits – a component of M1 – rose to 0.1% in October, up from ‑1.6% in September. Foreign inflows continued to be the primary source of money creation, mainly driven by a large euro area current account surplus. While the contribution to money growth made by net bank purchases of government debt was also significant, that of lending to households and to firms remained small. The ongoing contraction of the Eurosystem balance sheet and the issuance of long-term bank bonds (which are not included in M3), amid the phasing out of targeted longer-term refinancing operation (TLTRO) funding by the end of 2024, contributed negatively, however, to money creation.
Chart 24
M3, M1 and overnight deposits
(annual percentage changes, adjusted for seasonal and calendar effects)
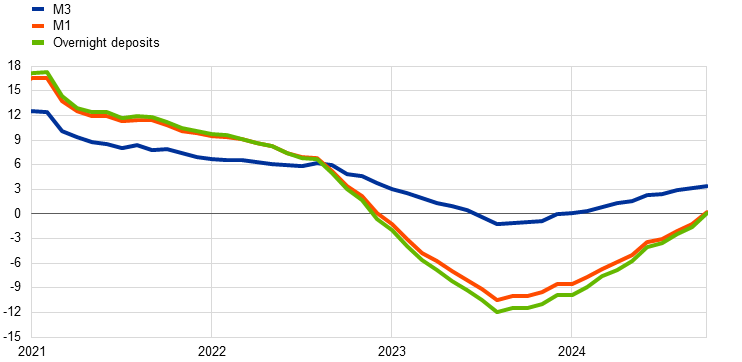
Source: ECB.
Note: The latest observations are for October 2024.
6 Fiscal developments
According to the December 2024 Eurosystem staff macroeconomic projections, the euro area general government budget deficit is expected to decline from 3.6% of GDP in 2023 to 3.2% of GDP in 2024 and then very gradually to 2.9% in 2027. Broadly reflecting this path, the euro area fiscal stance is projected to tighten significantly in 2024, very marginally further in both 2025 and 2026, and then more strongly in 2027. However, the fiscal policy assumptions and projections are surrounded by an unusual level of uncertainty.[12] The tightening of the fiscal stance in 2024 mostly reflects the phasing-out of a large part of energy and inflation-related support measures as well as sizeable non-discretionary factors, in particular strong revenue developments. The relatively large tightening of the fiscal stance in 2027 primarily reflects lower assumed public spending related to the expiry of Next Generation EU (NGEU) grant financing. The euro area debt-to-GDP ratio is projected to increase slowly from an already elevated level and to stabilise only at the end of the projection horizon at close to 89%. On the fiscal policy side, the European Commission launched the first cycle of policy coordination under the new economic governance framework with the release of its Autumn Package on 26 November. Governments should now focus on implementing their commitments under this framework fully and without delay. This would help bring down budget deficits and debt ratios on a sustained basis, while prioritising growth-enhancing reforms and investment.
According to the December 2024 Eurosystem staff macroeconomic projections, the euro area general government budget balance is set to improve gradually over the projection horizon (Chart 25).[13] While the euro area budget deficit was stable at 3.6% of GDP in 2022 and 2023, it is expected to decline to 3.2% of GDP in 2024 and then by 0.1 percentage points per annum until 2027, when it is projected to stand at 2.9%. The projected path reflects mainly a gradually improving but still negative cyclically adjusted primary balance over the projection horizon. This will, however, be partly offset by gradually rising interest expenditure over the whole period, reflecting a slow pass-through of past interest rate increases given the long residual maturities of outstanding sovereign debt. The cyclical component remains very small and negative until 2027, when it turns slightly positive. Compared with the September 2024 ECB staff macroeconomic projections, the budget balance is revised marginally up in 2024 and 2025 but is unrevised in 2026.
Chart 25
Budget balance and its components
(percentages of GDP)

Sources: ECB calculations and Eurosystem staff macroeconomic projections for the euro area, December 2024.
Note: The data refer to the aggregate general government sector of all 20 euro area countries.
The euro area fiscal stance is projected to tighten significantly in 2024 and, with the expiry of the NGEU programme, also in 2027.[14] The annual change in the cyclically adjusted primary balance, adjusted for grants extended to countries under the NGEU programme, points to a significant tightening (0.9 percentage points of GDP) of fiscal policies in the euro area in 2024. This mostly reflects the phasing-out of a large part of government energy and inflation-related support measures, as well as sizeable non-discretionary factors reflecting strong revenue developments in some countries. The fiscal stance is projected to continue tightening over the coming years, albeit only marginally in 2025 and 2026. In 2025 the tightening impact of discretionary measures is expected to be compensated by dynamic public investment and fiscal transfers, while a reduction in discretionary measures is expected to underpin the tightening in 2026. When the NGEU programme expires in 2027, the fiscal stance is expected to tighten much more significantly, by 0.6 percentage points of GDP, primarily reflecting lower assumed public investment and fiscal transfers, previously financed from NGEU grants. As a result, the cumulated tightening of the fiscal stance over the 2024-27 projection horizon amounts to 1.7 percentage points of GDP. Overall, however, taking into account the large amount of fiscal support provided since the pandemic, the cumulative fiscal stance over the period 2020-27 remains very accommodative.
The euro area debt-to-GDP ratio is projected to increase slowly from an already elevated level and to stabilise at the end of the projection horizon (Chart 26). The debt ratio increased significantly during the pandemic, to around 97% in 2020, before falling gradually. According to the December 2024 Eurosystem staff macroeconomic projections, this improvement is coming to a halt. Instead, the debt ratio is now expected to increase slowly from 87.4% of GDP in 2023 to close to 88.7% of GDP in 2027. The increase over the projection horizon is driven by continued primary deficits and expected positive deficit-debt adjustments that are only partly compensated by favourable (negative) interest rate-growth differentials.
Chart 26
Drivers of change in euro area government debt
(percentages of GDP, unless otherwise indicated)
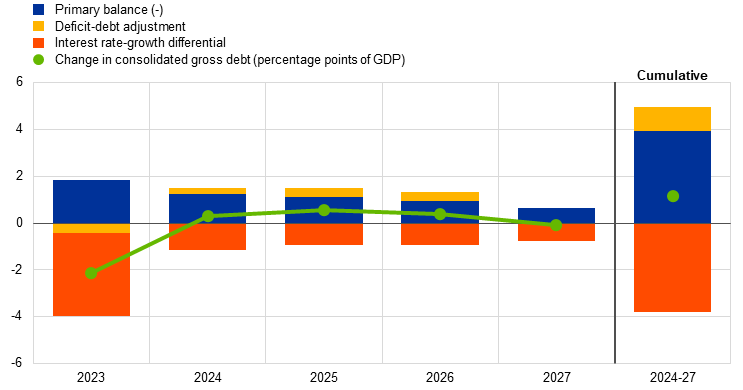
Sources: ECB calculations and Eurosystem staff macroeconomic projections for the euro area, December 2024.
Note: The data refer to the aggregate general government sector of all 20 euro area countries.
On 26 November the European Commission launched the first cycle of policy coordination under the new economic governance framework with the release of its Autumn Package. This package contains the Commission’s assessment of the first medium-term fiscal structural plans (MTFSPs) submitted by EU Member States under the new governance framework that took effect on 30 April. It also includes the Commission’s assessment of euro area countries’ draft budgetary plans (DBPs) for 2025. However, not all euro area countries had submitted their budgetary plans to the Commission, mainly owing to their electoral cycles.[15] Moreover, in view of political developments in some countries, several DBPs may already be out of date. Nevertheless, governments should now focus on implementing their commitments under this framework fully and without delay. This would help bring down budget deficits and debt ratios on a sustained basis, while prioritising growth-enhancing reforms and investment. To make the economy more productive, competitive and resilient, it is also crucial to swiftly follow up, with concrete and ambitious structural policies, on Mario Draghi’s proposals for enhancing European competitiveness and Enrico Letta’s proposals for empowering the Single Market.[16]
Boxes
1 What’s behind the resilience of US equity prices – market structure, earnings expectations or equity risk premia?
Increases in US equity prices since early 2023 have led to elevated valuations, particularly for the so-called Magnificent Seven firms. US equity prices have risen by almost 60%, despite the Federal Reserve System’s monetary tightening and numerous geopolitical shocks. Year-on-year returns of over 20% have been observed in each quarter of 2024 (Chart A, panel a). The equity returns of the best-performing stocks – those of the large tech companies Alphabet, Amazon, Apple, Meta, Microsoft, Nvidia and Tesla, frequently referred to as the “Magnificent Seven” – have significantly outpaced the rest, increasing by around 75% in 2023 and 45% in 2024. This has driven their valuations, in price-to-earnings (P/E) ratio terms, up to around 30 – well above the median level for S&P 500 companies, which is 20, and above the long-term median level of 17 (Chart A, panel b).[17] While the recent returns of most S&P 500 companies have not been as high as the returns of the technology firm-dominated Nasdaq index 25 years ago, these developments are worth assessing in the light of the experience of the dot-com period. As in that period, which was fuelled by widespread enthusiasm for the internet, tech firms’ current market performance has been buoyed by strong optimism surrounding new technology such as artificial intelligence (AI). Analysts and media commentators have therefore been exploring the similarities and differences between the two episodes.[18] Against this background, this box sheds light on the factors behind the US equity market resilience by discussing the role of market structure, earnings expectations and equity risk premia.
More2 The effects of the Emissions Trading System on European investment in the short run
This box takes stock of the impact of the EU Emissions Trading System (EU ETS) on European investment, while testing empirically the effect of carbon pricing on international and domestic investment flows. The EU ETS has reduced greenhouse gas emissions, bringing long-term benefits for the environment, the European economy and Europe’s energy independence. Empirical evidence on the long-term benefits indicates that the ETS also triggers green investment to reduce the carbon intensity of firms’ production processes.[19] When compared with alternative policy instruments, carbon pricing is shown to be an efficient mechanism for providing incentives for the adoption of low-carbon technologies.[20] As a result, the ETS is instrumental in enhancing European energy independence from fossil fuels.
More3 What are the economic signals from uncertainty measures?
While uncertainty plays a prominent role in many economic decisions, it is not directly measurable, making its precise impact difficult to gauge. In times of high uncertainty, households and firms may delay or cancel spending and investment plans, which in turn dampens economic activity.[21] Given that uncertainty is not directly observable, this box assesses recent signals from different proxies, categorising them as those that are directly associated with the short-term economic situation and those that reflect longer-term policy issues. We also examine the implications of these measures for key macroeconomic variables.
More4 What explains the high household saving rate in the euro area?
Following a pandemic-related surge in 2020, the household saving rate in the euro area fell back to its pre-pandemic average by mid-2022 but has since risen again noticeably. The seasonally adjusted euro area household saving rate, as reported by Eurostat in the quarterly sector accounts, rose sharply after the outbreak of the COVID-19 pandemic.[22] This was mainly due to the lockdowns imposed to contain the spread of the virus, which dampened consumption, while government measures helped to support disposable incomes.[23] With the restrictions largely lifted by 2022, the saving rate returned to its pre-pandemic average (Chart A). It has, however, increased again over the last two years, while consumer spending has remained sluggish. This box analyses the main economic factors behind this recent rise in the saving rate and explores the near-term implications for private consumption.
More5 Monetary policy pass-through to goods and services inflation: a granular perspective
Monetary policy affects consumer prices through a number of channels, while its impact, in terms of both speed and magnitude, varies across consumption categories. The post-pandemic inflation surge was a result of an unprecedented combination of shocks, including supply chain disruptions, energy shocks and the pent-up demand from the re-opening of the economy. The ECB responded forcefully by unwinding the accommodative monetary policy stance that had supported the economy through the pandemic and moving it into restrictive territory. The overall disinflation process that followed reflected the fading of supply shocks and the effectiveness of the steep and decisive interest rate hiking policy. At the same time, the disinflation process was accompanied by persistent dynamics in core inflation – defined as the Harmonised Index of Consumer Prices excluding energy and food (HICPX). This box analyses the heterogeneous pass-through of monetary policy shocks to euro area inflation, with a focus on the distinct behaviour of the individual prices of the goods and services included in the HICPX. Focusing on this index provides considerable insight into developments in an inflation component that is considered to typically capture more persistent dynamics.
More6 Liquidity conditions and monetary policy operations from 24 July to 22 October 2024
This box describes Eurosystem liquidity conditions and monetary policy operations during the fifth and sixth reserve maintenance periods of 2024. Together, these two maintenance periods ran from 24 July to 22 October 2024 (the “review period”).
More7 TLTRO III phase-out and bank lending conditions
From late 2022 to the end of 2024, euro area banks repaid more than €2 trillion in funding from the third series of targeted longer-term refinancing operations (TLTRO III) in a context of rising interest rates, reducing borrowing from the Eurosystem to an all-time low. With the finalisation of TLTRO III repayments and in the context of the higher interest rate environment that emerged from the recent hiking cycle, the liability structure of banks has changed. As banks increased their reliance on securities issuance and deposit funding in relative terms, the liability composition moved closer to that prevailing before the introduction of TLTROs in 2014 (Chart A). At the same time, Eurosystem refinancing operations now represent a smaller share of bank funding than ever before owing to the limited recourse to shorter-term standard refinancing operations, the costs of which are currently well above those of alternative funding sources, and still ample central bank reserves, which are supporting bank liquidity.[24]
MoreArticles
1 Energy shocks, corporate investment and potential implications for future EU competitiveness
The surge in energy prices following the unjustified Russian invasion of Ukraine exposed the EU to the largest energy shock since the 1970s. As a key input in virtually any production process, the sharp rise in energy prices not only contributed to a surge in inflation and a loss of purchasing power for households but also to a significant increase in input costs, with ripple effects across all economic sectors.
More2 Explaining the resilience of the euro area labour market between 2022 and 2024
In the aftermath of the pandemic, the euro area labour market has shown remarkable resilience. The unemployment rate has remained at record lows and employment has grown steadily despite weak economic growth and various challenges to the economy, such as the energy crisis triggered by Russia’s invasion of Ukraine, geopolitical tensions and the subsequent monetary policy tightening. From the fourth quarter of 2021 to the second quarter of 2024, cumulative employment growth (3.3%) outpaced cumulative real GDP growth (2.4%) by 0.9 percentage points. This is remarkable given that both employment and output had fully recovered to their respective pre-pandemic levels by the end of 2021. The resilience of employment has, however, led to a decline in labour productivity growth, measured in terms of average output per employee, which has dipped below its already weak historical trend.
More3 Four years into the Next Generation EU programme: an updated preliminary evaluation of its economic impact
Four years into the implementation of the Next Generation EU programme (NGEU), this article provides an updated assessment of its economic effects. To support Europe’s economic recovery from the pandemic and to make its economies more competitive and resilient, with a focus on digital and green transformation, in July 2020 European Union Member States agreed to launch the EU’s largest ever funding programme, NGEU. To achieve these objectives, the programme offers financial support to EU Member States on the condition that they implement specified investment and reform projects over the period 2021-2026. Earlier ECB staff analysis concluded that NGEU had the potential to deliver these objectives, provided that the planned investments and reforms were implemented in good time and effectively.[25] Now, more than halfway into the implementation period of NGEU, this article provides a description of the situation to date, as well as an updated assessment of the economic impact of the programme. It focuses on the impact of the Recovery and Resilience Facility (RRF) – the centrepiece of NGEU – on the euro area economy. Among euro area countries, particular attention is paid to Italy and Spain as the main recipients of RRF funds in absolute terms.
MoreStatistics
https://www.ecb.europa.eu/pub/pdf/ecbu/ecb.eb_annex202408~f8dbb2a5a3.en.pdf© European Central Bank, 2025
Postal address 60640 Frankfurt am Main, Germany
Telephone +49 69 1344 0
Website www.ecb.europa.eu
All rights reserved. Reproduction for educational and non-commercial purposes is permitted provided that the source is acknowledged.
For specific terminology please refer to the ECB glossary (available in English only).
The cut-off date for the statistics included in this issue was 11 December 2024.
PDF ISSN 2363-3417, QB-BP-24-008-EN-N
HTML ISSN 2363-3417, QB-BP-24-008-EN-Q
The cut-off date for data included in this issue of the Economic Bulletin was 11 December 2024.
At its meeting on 18 December – which took place after the review period from 17 October to 11 December – the FOMC lowered the federal funds rate target by another 25 basis points.
At its meeting on 18 December – which took place after the review period from 17 October to 11 December – the Bank of England decided to keep the Bank Rate unchanged.
See “Eurosystem staff macroeconomic projections for the euro area, December 2024”, published on the ECB’s website on 12 December 2024.
For an overview of the euro area labour market over the past two years, see the article entitled “Explaining the resilience of the euro area labour market between 2022 and 2024” in this issue of the Economic Bulletin.
See “Eurosystem staff macroeconomic projections for the euro area, December 2024”, published on the ECB’s website on 12 December 2024.
The cut-off date for data included in this issue of the Economic Bulletin was 11 December 2024. This flash estimate from Eurostat was revised down by 0.1 percentage points, to 2.2%, in the release of HICP inflation data for November on 18 December 2024.
See “Eurosystem staff macroeconomic projections for the euro area, December 2024”, published on the ECB’s website on 12 December 2024.
For more information, see Lane, P.R., “Underlying inflation: an update”, speech at the Inflation: Drivers and Dynamics Conference 2024 organised by the Federal Reserve Bank of Cleveland and the ECB, Cleveland, 24 October 2024.
See Górnicka, L. and Koester, G. (eds.), “A forward-looking tracker of negotiated wages in the euro area”, Occasional Paper Series, No 338, ECB, Frankfurt am Main, February 2024.
Owing to lags in data availability for the cost of borrowing from banks, data on the overall cost of financing for NFCs are only available up to October 2024.
The fiscal plans of some large euro area countries are either not yet finalised or already outdated given the prevailing political situation. In France, for instance, the baseline fiscal policy assumptions and projections rest on an assessment of the 2025 budget and medium-term fiscal plans of the Government of former Prime Minister Michel Barnier. On 4 December, the French Parliament passed a motion of no-confidence in the Government and its fiscal plans, with unclear consequences for the 2025 budget. In many countries there are also risks to the baseline stemming from possible, but as yet unspecified, additional measures needed to comply with the requirements of the revised EU fiscal framework.
See “Eurosystem staff macroeconomic projections for the euro area, December 2024”, published on the ECB’s website on 12 December 2024.
The fiscal stance reflects the direction and size of the stimulus from fiscal policies to the economy beyond the automatic reaction of public finances to the business cycle. It is measured here as the change in the cyclically adjusted primary balance ratio net of government support to the financial sector. Given that the higher budget revenues related to NGEU grants from the EU budget do not have a contractionary impact on demand, the cyclically adjusted primary balance is adjusted to exclude those revenues. For more details on the euro area fiscal stance, see the article entitled “The euro area fiscal stance”, Economic Bulletin, Issue 4, ECB, 2016.
Belgium, Germany, Lithuania and Austria had not submitted an MTFSP to the Commission, while Belgium, Spain and Austria had not presented a DBP.
See Draghi, M., “The future of European competitiveness”, September 2024; and Letta, E., “Much more than a market – Speed, Security, Solidarity. Empowering the Single Market to deliver a sustainable future and prosperity for all EU Citizens”, April 2024.
The P/E ratio is a popular equity valuation metric, calculated as the share price divided by the earnings per share of the respective company. It can be interpreted as the price an investor pays per unit of earnings.
As an example of recent publications by some international institutions, see Lombardi, M.J. and Pinter, G., “The valuations of tech stocks: dotcom redux?”, BIS Quarterly Review, 16 September 2024.
See Colmer, J., Martin, R., Muuls, M. and Wagner, U.J., “Does Pricing Carbon Mitigate Climate Change? Firm-Level Evidence from the European Union Emissions Trading System”, The Review of Economic Studies, May 2024
See Anderson et al., “Policies for a climate-neutral industry: Lessons from the Netherlands”, OECD Science, Technology and Industry Policy Papers, No 108, April 2021.
Certain types of uncertainty, such as that related to the recent surge in Artificial Intelligence investment, can also increase investment and economic activity (see Ludvigson, S.C., Ma, S. and Ng, S., “Uncertainty and Business Cycles: Exogenous Impulse or Endogenous Response?”, American Economic Journal: Macroeconomics, Vol. 13, No 4, 2021, pp. 369-410.
The quarterly sectors accounts (QSA) for the euro area are jointly compiled by the ECB and Eurostat.
See the box entitled “COVID-19 and the increase in household savings: precautionary or forced?”, Economic Bulletin, Issue 6, ECB, 2020.
Standard refinancing operations include main refinancing operations (MROs) and three-month longer-term refinancing operations (three-month LTROs), both of which are conducted at the MRO rate.
See the article entitled “Next Generation EU: a euro area perspective”, Economic Bulletin, Issue 1, ECB, 2022. For more details, see Bańkowski, K. et al., “The economic impact of Next Generation EU: a euro area perspective”, Occasional Paper Series, No. 291, ECB, 2022.


