Update on economic and monetary developments
Summary
The resurgence in coronavirus (COVID-19) infections presents renewed challenges to public health and the growth prospects of the euro area and global economies. Incoming information signals that the euro area economic recovery is losing momentum more rapidly than expected, after a strong, yet partial and uneven, rebound in economic activity over the summer months. The rise in COVID-19 cases and the associated intensification of containment measures is weighing on activity, constituting a clear deterioration in the near-term outlook.
Incoming data for the global economy point to a fast rebound of global activity in the third quarter, but also to slowing momentum. After a sharp contraction in the first half of 2020, the global composite output Purchasing Managers’ Index (excluding the euro area) and high-frequency indicators rebounded considerably in the third quarter, albeit stabilising in September. In addition to weak labour market prospects, uncertainty is weighing on consumer behaviour. Global trade also recovered sharply in the third quarter, following the sharp and deep contraction in the second quarter. Global inflation remained low.
Over the review period, the forward curve of the euro overnight index average (EONIA) shifted slightly downwards and remained mildly inverted. Despite the inversion, the curve does not suggest firm market expectations of an imminent rate cut. Long-term sovereign bond spreads declined steadily across euro area countries, amid expectations of further monetary policy and fiscal support. Equity price indices significantly declined, amid sizeable intra-period movement. In foreign exchange markets, the euro remained broadly stable in trade-weighted terms.
The latest data point to a strong rebound in output in the euro area in the third quarter of 2020, following the sharp contraction of 11.8%, quarter on quarter, in the second quarter. However, the ongoing increases in coronavirus infection rates constitute a headwind to the short-term outlook and will, in all likelihood, lead to a significant softening in output growth in the final quarter of the year, as already indicated by recent surveys. At the same time, the recovery continues to be uneven across sectors, with the services sector being the hardest hit by the pandemic, in part as a result of its sensitivity to social distancing measures. Looking further ahead, a sustained recovery remains highly dependent on the course the pandemic takes and the success of the containment policies. While the uncertainty related to the evolution of the pandemic will likely dampen the strength of the recovery in the labour market and in consumption and investment, the euro area economy should continue to be supported by favourable financing conditions, an expansionary fiscal stance and a gradual strengthening of global activity and demand.
Euro area annual HICP inflation decreased to -0.3% in September, from -0.2% in August, reflecting developments in the prices of energy, non-energy industrial goods and services. On the basis of current and futures prices for oil and taking into account the temporary reduction in German VAT, headline inflation is likely to remain negative until early 2021. Moreover, near-term price pressures will remain subdued owing to weak demand, notably in the tourism and travel-related sectors, as well as to lower wage pressures and the appreciation of the euro exchange rate. Over the medium term, a recovery in demand supported by accommodative monetary and fiscal policies will put upward pressure on inflation. Market-based indicators and survey-based measures of longer-term inflation expectations remain broadly unchanged at low levels.
The coronavirus pandemic has continued to influence significantly money and credit dynamics in the euro area. Money growth increased further in September 2020 and domestic credit, which continued to be the main source of money creation, was increasingly supported by the Eurosystem’s net purchases of government bonds. The timely and sizeable measures taken by monetary, fiscal and supervisory authorities since the outbreak of the pandemic have continued to underpin the extension of bank credit on favourable terms to the euro area economy. However, as evidenced by the October 2020 euro area bank lending survey, banks tightened their credit standards on loans to firms and households in the third quarter of 2020 on account of heightened risk perceptions.
The monetary policy measures that the Governing Council has taken since early March are helping to preserve favourable financing conditions for all sectors and jurisdictions across the euro area, thereby providing crucial support to underpin economic activity and to safeguard medium-term price stability. At the same time, in the current environment of risks clearly tilted to the downside, the Governing Council will carefully assess the incoming information, including the dynamics of the pandemic, prospects for a rollout of vaccines and developments in the exchange rate. The new round of Eurosystem staff macroeconomic projections in December will allow a thorough reassessment of the economic outlook and the balance of risks. On the basis of this updated assessment, the Governing Council will recalibrate its instruments, as appropriate, to respond to the unfolding situation and to ensure that financing conditions remain favourable to support the economic recovery and counteract the negative impact of the pandemic on the projected inflation path. This will foster the convergence of inflation towards its aim in a sustained manner, in line with its commitment to symmetry.
In the meantime, the Governing Council decided to reconfirm its accommodative monetary policy stance.
The Governing Council will keep the key ECB interest rates unchanged. They are expected to remain at their present or lower levels until the inflation outlook robustly converges to a level sufficiently close to, but below, 2% within the projection horizon, and such convergence has been consistently reflected in underlying inflation dynamics.
The Governing Council will continue its purchases under the pandemic emergency purchase programme (PEPP) with a total envelope of €1,350 billion. These purchases contribute to easing the overall monetary policy stance, thereby helping to offset the downward impact of the pandemic on the projected path of inflation. The purchases will continue to be conducted in a flexible manner over time, across asset classes and among jurisdictions. This allows the Governing Council to effectively stave off risks to the smooth transmission of monetary policy. The Governing Council will conduct net asset purchases under the PEPP until at least the end of June 2021 and, in any case, until it judges that the coronavirus crisis phase is over. The Governing Council will reinvest the principal payments from maturing securities purchased under the PEPP until at least the end of 2022. In any case, the future roll-off of the PEPP portfolio will be managed to avoid interference with the appropriate monetary policy stance.
Net purchases under the asset purchase programme (APP) will continue at a monthly pace of €20 billion, together with the purchases under the additional €120 billion temporary envelope until the end of the year. The Governing Council continues to expect monthly net asset purchases under the APP to run for as long as necessary to reinforce the accommodative impact of policy rates, and to end shortly before the Governing Council starts raising the key ECB interest rates. The Governing Council intends to continue reinvesting, in full, the principal payments from maturing securities purchased under the APP for an extended period of time past the date when it starts raising the key ECB interest rates, and in any case for as long as necessary to maintain favourable liquidity conditions and an ample degree of monetary accommodation.
The Governing Council will also continue to provide ample liquidity through its refinancing operations. In particular, the third series of targeted longer-term refinancing operations (TLTRO III) remains an attractive source of funding for banks, supporting bank lending to firms and households.
1 External environment
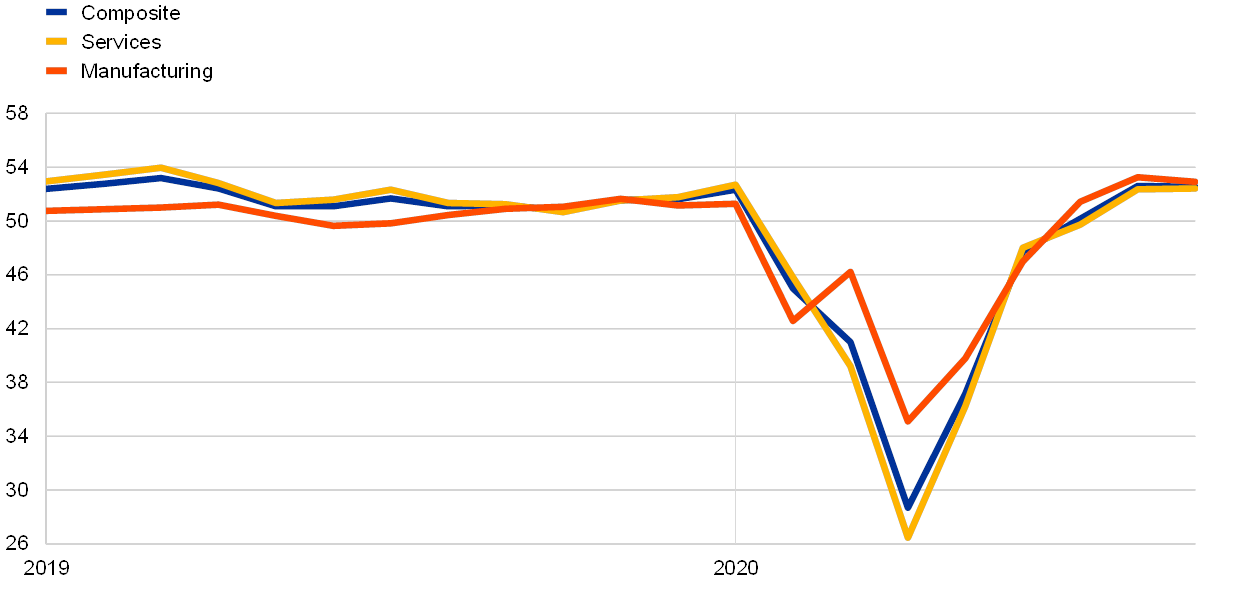
Incoming data point to a fast rebound of global activity in the third quarter, but also to momentum slowing down afterwards. After a sharp contraction in the first half of 2020, the global composite output PMI (excluding the euro area) rebounded considerably during the third quarter, to 51.8 compared to 37.9 in the previous quarter. However, it remained unchanged in September, as the marginal improvement in services was offset by a slight drop in the manufacturing output PMI (Chart 1). Overall, services which are characterised by high physical proximity, such as tourism and recreation, transportation and consumer services, remained weak in the third quarter. Certain non-standard high-frequency indicators, such as mobility trends and consumer sentiment, also point to a softening of momentum at the end of the third quarter, in particular in advanced economies. This could be a sign that firms and households are continuing to exercise caution in their spending decisions amid concerns surrounding resurging infections, social distancing requirements and fears of the re-introduction of containment measures in the context of the ongoing coronavirus (COVID-19) pandemic.
Chart 1
Global composite output PMI and sub-indices (excluding the euro area)
(diffusion index)
Sources: Haver Analytics, Markit and ECB calculations.
Notes: The latest observations are for September 2020.
In addition to weak labour market prospects, uncertainty is weighing on consumer behaviour. The recovery of output and, to a lesser extent, of employment remains incomplete, particularly as regards those activities most affected by the pandemic. Overall retail sales have been rising sharply – supported by pent-up demand following lockdowns – buffered by disposable income, which has been supported by government measures. However, partly due to precautionary motive, due to the heightened economic uncertainty, savings rates also remain significantly higher than before the pandemic. Consumer confidence is still very low globally, with little improvement seen since the trough in April.
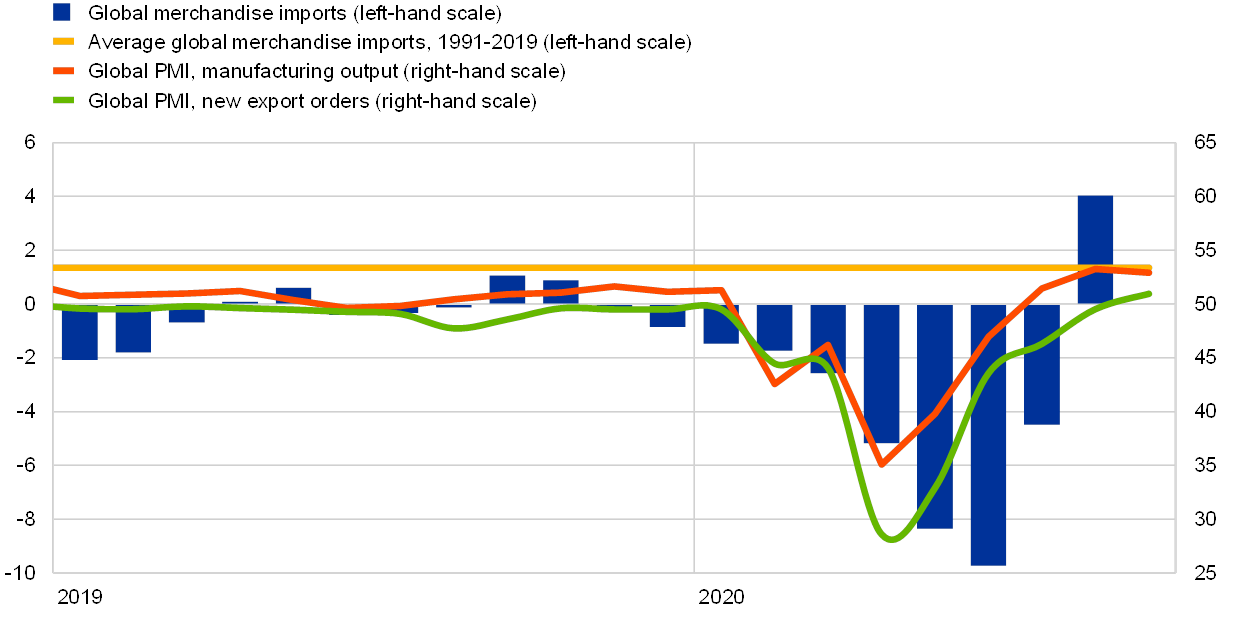
Global trade has also seen a sharp recovery in the third quarter. Following a double-digit fall in world trade during the second quarter, incoming data point to a sharp recovery during the third quarter (Chart 2). World merchandise imports (excluding the euro area) increased by 2.4% in August on a month-on-month basis, according to CPB data. Despite being lower than in June and July, this increase provides confirmation of a strong recovery of world trade into the third quarter. The rebound is also confirmed by a tracker based on weekly indicators of trade. Compared to previous downturns, world trade has been relatively resilient considering the sharp and deep economic contraction in the second quarter. This partly reflects the fact that the less trade-intense services sector has borne the brunt of the collapse in activity.
Chart 2
Surveys and global trade in goods (excluding the euro area)
(left-hand scale: three-month-on-three-month percentage changes; right-hand scale: diffusion index)
Sources: Markit, CPB Netherlands Bureau for Economic Policy Analysis and ECB calculations.
Note: The latest observations are for August 2020 for global merchandise imports and September 2020 for the PMIs. The indices and data refer to the global aggregate excluding the euro area.
Global inflation remained stable in August. Annual consumer price inflation in Member countries of the Organisation for Economic Co-operation and Development (OECD) remained unchanged at 1.2% in August. The downward pressure from annual energy price inflation continued in August, albeit at a decelerating pace, while food price inflation increased marginally. Annual OECD CPI inflation excluding food and energy decreased slightly to 1.6%. Inflationary pressures remain muted across major advanced and emerging market economies and are expected to remain subdued in the short and medium term as a result of low demand.
Oil prices have increased slightly since the last Governing Council meeting, but remained range bound due to counteracting demand and supply dynamics. Since June, Brent oil prices have fluctuated between USD 35 and 45 per barrel and are currently around 7% higher than the values reported in the September Governing Council meeting. After the increase in global oil demand in July as coronavirus (COVID-19) restrictions eased, the International Energy Agency expects oil demand to decelerate amid an increase of COVID-19 cases worldwide. Lower oil supply continues to counteract downward pressures from demand, with oil supply falling in September as OPEC+ countries improved the compliance rate with their production agreement. This adds to the substantial oil supply cuts following the OPEC+ agreement in response to the pandemic and the significant shut-ins of oil production in the United States. Compared to pre-coronavirus levels, oil prices are still down by approximately a third. At the same time, metal prices have remained broadly stable since the last Governing Council meeting whereas food prices have increased somewhat.
In the United States, the recovery is set to lose momentum slightly following strong growth in the third quarter. According to the first estimate, US real GDP expanded by 33.1% on a quarter-on-quarter annualised basis, supported by a sharp rebound in domestic demand, but the recovery is losing momentum. Industrial production declined in September, following a marked slowdown in August, while retail sales recovered somewhat in September (in real terms) after two sets of weak results in previous months. This was in line with developments in terms of personal income, which recovered somewhat in September, while the rate of households’ savings remained at historically high levels. However, the outlook for spending is weak in the absence of further support measures. At the same time, the recovery in the US labour market is slowing. The marginal drop in unemployment to 7.9% seen in September was mainly due to a fall in the labour force participation, while the number of job postings stays low.
Japan is seeing a gradual economic recovery as the resurgence in COVID-19 infections seen over the summer appears contained. Economic activity bottomed out and started to gradually resume since the end of the partial lockdown in May. Industrial production and real exports of goods have trended upwards since then, whilst imports have fallen for a fourth consecutive month in August. Although resurging domestic COVID-19 cases and poor weather conditions temporarily eased the recovery pace early in the summer, since late July the containment of the pandemic has been associated with increased consumer sentiment supporting the recovery.
In the United Kingdom, the rebound in activity shows signs of slowing by the end of the third quarter. Real UK GDP shrank in the first half of 2020 by around 22% compared to the level seen at the end of 2019. Monthly GDP data available until August showed that economic activity has been on a consistent recovery path since its trough in April, despite recent signs of a loss in momentum. PMIs also suggest a loss of momentum since August, even before the re-introduction of additional containment measures, which have been increasing considerably since the second half of September. In addition to the resurgence in the rate of COVID-19 infections and hospitalisations, the large rises in unemployment and heightened uncertainty related to the outcome of ongoing Brexit negotiations are weighing on the recovery.
In China, real GDP growth during the third quarter confirmed the continuation and broadening of the recovery. Although GDP growth was slightly below consensus forecasts, China’s economic recovery has continued consistently during the third quarter (4.9% year-on-year). The recovery has also been broadening. Capital formation and net trade continued to support growth, while final consumption contributed positively to growth for the first time this year. Moreover, September data point towards accelerating momentum towards the end of the quarter. Industrial production increased by 6.9% and retail sales by 3.3% year-on-year, both providing a positive surprise. All in all, recent data point to the continued normalisation of activity and expansion towards sectors which have been most affected by the COVID-19 pandemic. However, the outlook is still mixed, due to an unfavourable global environment affected by the global resurgence of the pandemic and by the possibility of a second wave of infections in mainland China, although authorities have so far managed to contain this risk to a minimum.
2 Financial developments
The euro overnight index average (EONIA) and the new benchmark euro short‑term rate (€STR) averaged -46 and -55 basis points respectively[1] over the review period (10 September 2020 to 28 October 2020). In the same period, excess liquidity increased by approximately €225 billion to around €3,205 billion, mainly reflecting take-up of targeted longer-term refinancing operations (TLTRO III) together with asset purchases under the pandemic emergency purchase programme (PEPP) and the asset purchase programme (APP).
The EONIA forward curve shifted slightly downwards over the review period and remained mildly inverted. Despite the inversion, the curve does not suggest firm market expectations of an imminent rate cut.[2] Overall, EONIA forward rates remain below zero for horizons up to 2028, reflecting continued market expectations of a prolonged period of negative interest rates.
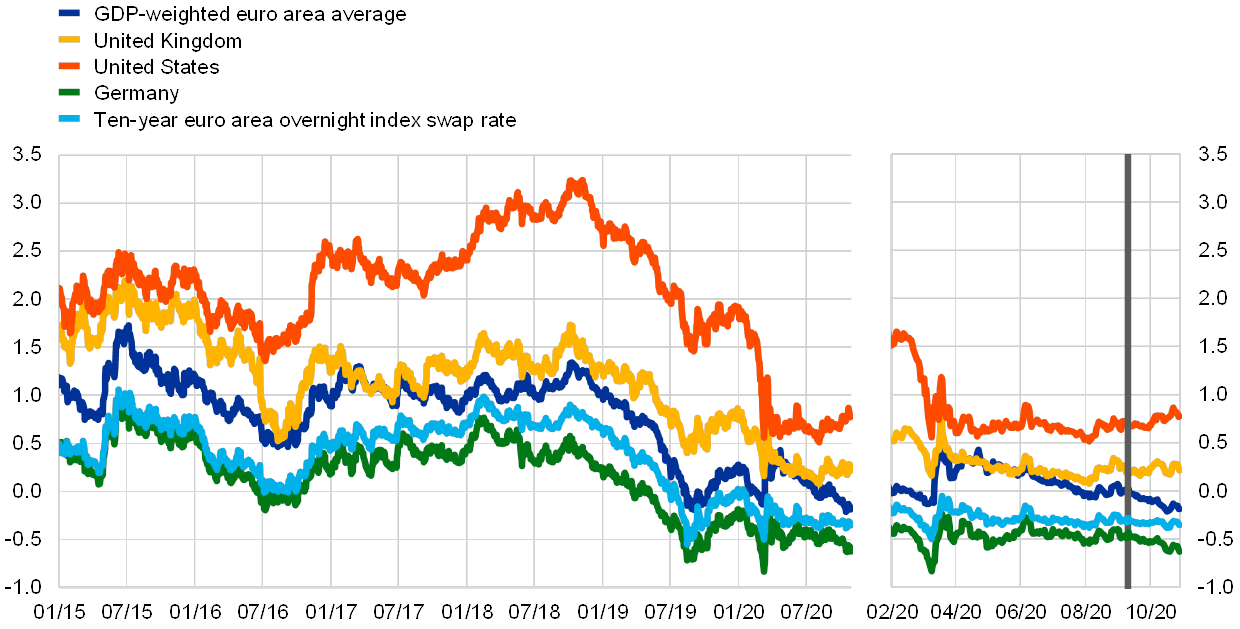
Long-term sovereign bond yields decreased across major jurisdictions in the period under review. The GDP-weighted euro area ten-year sovereign bond yield declined by 20 basis points to -0.19% (see Chart 3), owing to a combination of slightly lower risk-free rates and a more pronounced tightening of sovereign spreads. Ten-year sovereign bond yields in the United Kingdom also decreased by 3 basis points, while they increased by 8 basis points in the United States.
Chart 3
Ten-year sovereign bond yields
(percentages per annum)
Sources: Refinitiv and ECB calculations.
Notes: Daily data. The vertical grey line denotes the start of the review period on 10 September 2020. The zoom window shows developments in sovereign yields since 1 February 2020. The latest observations are for 28 October 2020.
Euro area sovereign bond spreads relative to risk-free rates have continued to decline across jurisdictions amid expectations of further monetary and fiscal support. The resurgence of the coronavirus (COVID-19) and the reintroduction of local lockdown measures across Europe have so far had only a limited impact on sovereign bond markets. Ten-year sovereign bond spreads (relative to the corresponding risk-free rate) currently stand close to their pre-pandemic levels in all euro area countries. Declines in spreads were most pronounced in those countries which had been most severely affected by the pandemic during the spring of 2020 and which had recorded larger increases in spreads. The ten-year German, French, Italian, Spanish and Portuguese sovereign spreads decreased by 10, 9, 25, 9 and 14 basis points to reach -0.28, 0.03, 1.12, 0.53 and 0.52 percentage points respectively. Consequently, the GDP-weighted euro area ten-year sovereign spread decreased by 11 basis points to 0.18 percentage points, amid expectations of further monetary and fiscal support.
Equity price indices significantly declined, following sizeable intra‑period movements. Towards the end of September equity prices of euro area non-financial corporations (NFCs) fell by 3.1%. After recovering fully, they declined again and currently stand 6% below the levels observed at the beginning of the review period. Bank equity prices in the euro area decreased in a more pronounced manner, falling by 15.8% over the review period. A similar dynamic could be seen in the United States, where NFC and bank equity prices stand 0.5% and 4.2% respectively below the levels observed at the beginning of the review period. Equity prices of euro area NFCs benefited from an improvement in short-term earnings expectations from the very low levels seen earlier this year, while the equity risk premium increased. The more recent sell-off has taken place amid a reintroduction in some European countries of containment measures to limit the spread of COVID‑19. The decline in euro area bank equity prices is likely related to the perceived build-up of balance sheet risk resulting from the renewed lockdowns.
Euro area corporate bond spreads declined slightly over the review period. The spreads on both investment-grade NFC bonds and financial sector bonds relative to the risk-free rate declined slightly over the review period to stand at 93 and 76 basis points respectively as of 28 October. Overall, the slight decrease reflects a decline in the excess bond premium. Credit fundamentals (as measured by ratings and expected default frequencies) remained largely unchanged.
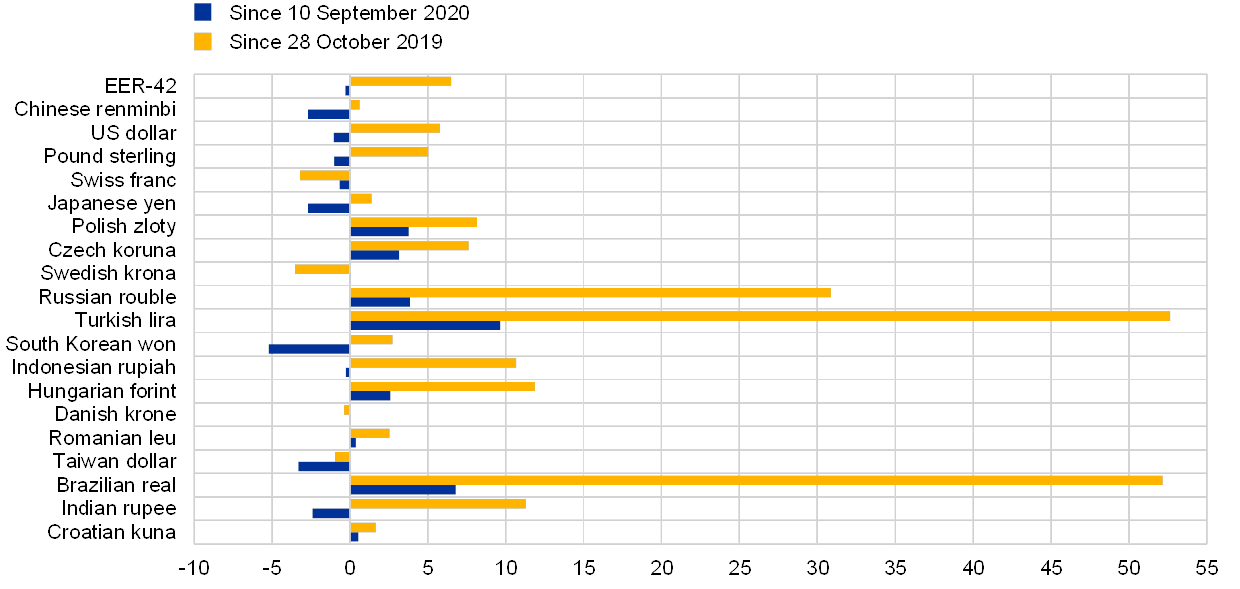
In foreign exchange markets, the euro remained broadly stable in trade‑weighted terms (see Chart 4), with some bilateral exchange rates moving in opposite directions, reflecting differences in the outlook for the recovery from the COVID-19 crisis. Over the review period, the nominal effective exchange rate of the euro, as measured against the currencies of 42 of the euro area’s most important trading partners, depreciated by 0.3%. Regarding bilateral exchange rate developments, the euro depreciated against the Chinese renminbi (by 2.7%) and the currencies of other major emerging economies in Asia, reflecting the strong rebound in activity and economic sentiment in the Asian manufacturing hubs. The euro also depreciated against the Japanese yen (by 2.7%), the US dollar (by 1%) and the pound sterling (by 1%). By contrast, the euro appreciated vis-à-vis the currencies of most non-euro area EU Member States, most notably the Polish zloty (by 3.8%) and the Czech koruna (by 3.1%). It also continued to strengthen against the Turkish lira, the Brazilian real and the Russian rouble.
Chart 4
Changes in the exchange rate of the euro vis-à-vis selected currencies
(percentage changes)
Source: ECB.
Notes: EER-42 is the nominal effective exchange rate of the euro against the currencies of 42 of the euro area’s most important trading partners. A positive (negative) change corresponds to an appreciation (depreciation) of the euro. All changes have been calculated using the foreign exchange rates prevailing on 28 October 2020.
3 Economic activity
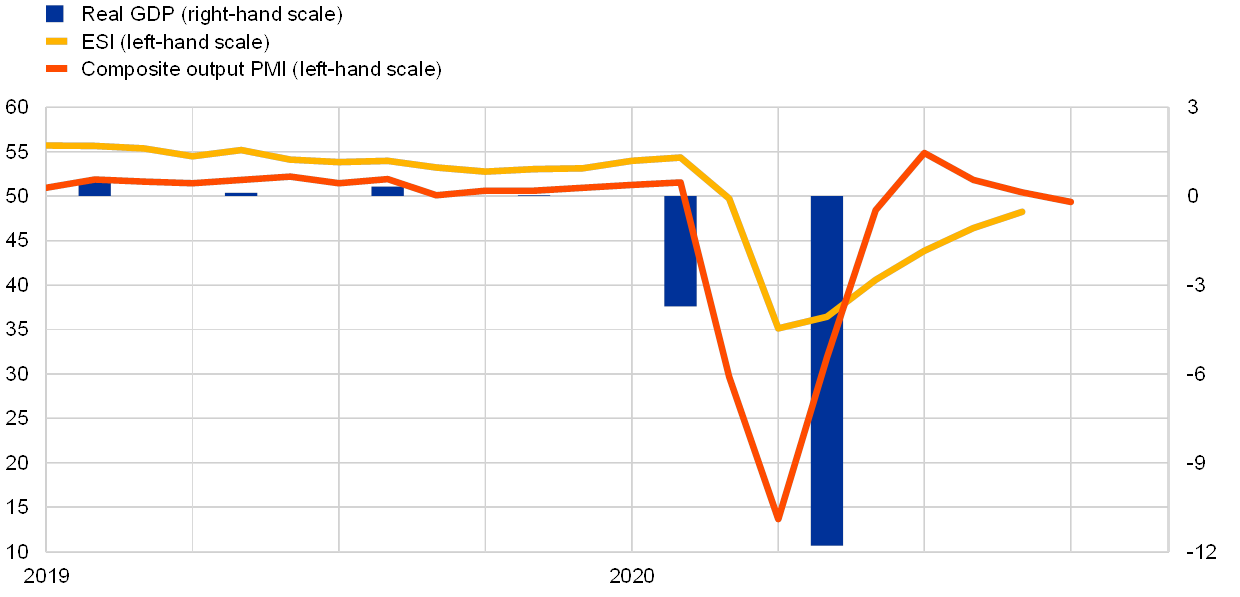
Following the unprecedented fall in euro area output in the second quarter of 2020, economic growth is set to rebound in the third quarter, before falling again in the fourth quarter. Total economic activity contracted by 11.8%, quarter on quarter, in the second quarter of 2020 – following a decline of 3.7% in the first quarter – resulting in an accumulated decline of 15.1% in the first half of the year (see Chart 5). The second quarter breakdown shows that the fall in GDP was broad based, with declines in domestic demand (which made a -10.9 percentage point contribution to growth) and net trade (-0.8 percentage points), as well as in changes in inventories (-0.1 percentage points). Economic indicators suggest that the decline in economic activity owing to the coronavirus (COVID-19) pandemic reached a trough in April 2020. Hard data, survey results and high-frequency indicators point to a vigorous bounceback in output in the third quarter, while growth is expected to soften again in the final quarter of the year. At the same time, the recovery in the euro area is expected to be uneven across sectors, with the services sector being hardest hit by the pandemic, in part as a result of its sensitivity to the social distancing measures. The same holds true across countries, with the recovery being dependent on the infection rates and efforts to contain the pandemic. The COVID-19 pandemic and the related containment measures have affected, and will continue to affect potential output. This is further explored in the article entitled “The impact of COVID-19 on potential output in the euro area” in this issue of the Economic Bulletin.
Chart 5
Euro area real GDP, the Economic Sentiment Indicator and the composite output Purchasing Managers’ Index
(left-hand scale: diffusion index; right-hand scale: quarter-on-quarter percentage changes)
Sources: Eurostat, European Commission, Markit and ECB calculations.
Notes: The Economic Sentiment Indicator (ESI) is standardised and rescaled to have the same mean and standard deviation as the Purchasing Managers’ Index (PMI). The latest observations are for the second quarter of 2020 for real GDP, September 2020 for the ESI and October 2020 for the PMI.
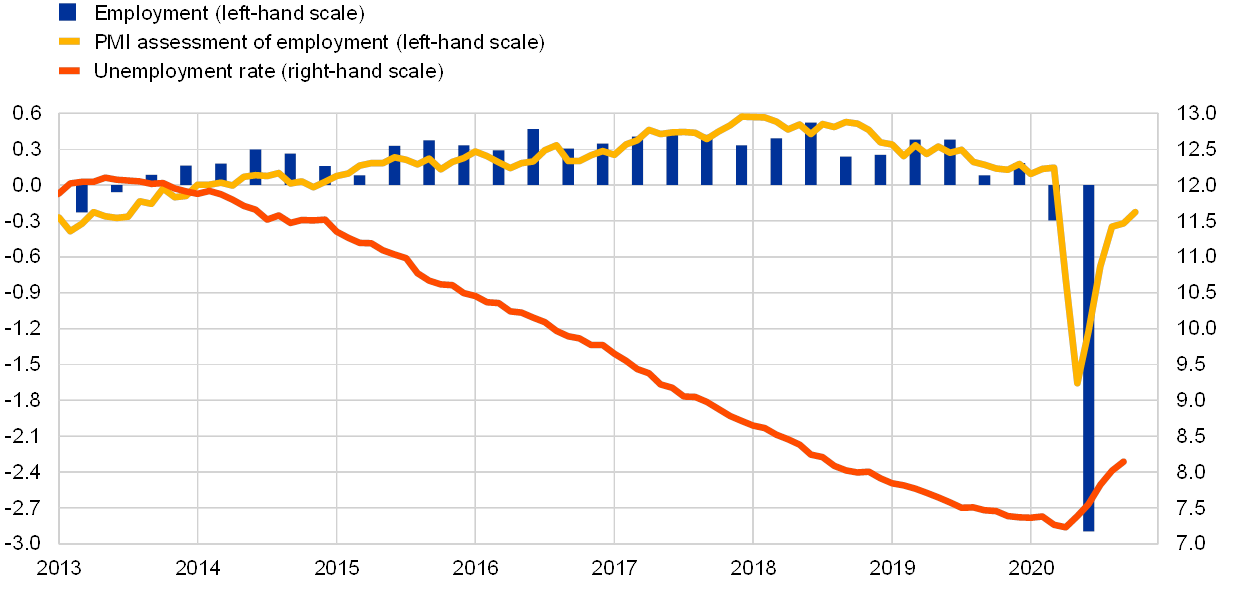
The COVID-19 pandemic led to the sharpest contraction on record in employment and total hours worked in the first half of 2020, while the impact on the unemployment rate was more limited as a result of to job support schemes. Compared with the contraction in real GDP during the first half of 2020, the increase in the official unemployment rate was relatively limited, rising to 8.1% in August from the historical low of 7.2% reached in March 2020, but still far from the peak of 12.7% recorded in February 2013. Employment support measures, such as short-time work schemes and temporary layoffs, as well as a reduction in the participation rate, help to explain the limited impact on the unemployment rate. Employment support measures also contained the fall in employment, which declined by 2.9% in the second quarter of 2020 relative to the first quarter (see Chart 6). Total hours worked declined substantially more, decreasing by 13.4% in the second quarter and leading to a fall of 10.8% in average hours worked per person employed. No information on employment and hours worked is yet available for the third quarter of 2020.
Short-term labour market indicators have partially recovered but continue to signal contractionary developments. The Purchasing Managers’ Index (PMI) for employment increased to 48.1 in October according to its flash release, compared with 47.7 in September and 46.8 in August, following a stronger rebound in July of 3.3 points (see Chart 6). However, the current level of the PMI continues to suggest a contraction in employment and could be read as an early indication of subdued employment prospects in the period ahead.
Chart 6
Euro area employment, the PMI assessment of employment and the unemployment rate
(left-hand scale: quarter-on-quarter percentage changes, diffusion index; right-hand scale: percentages of the labour force)
Sources: Eurostat, Markit and ECB calculations.
Notes: The PMI is expressed as a deviation from 50 divided by 10. The latest observations are for the second quarter of 2020 for employment, October 2020 for the PMI and August 2020 for the unemployment rate.
The rebound in consumer spending stalled over the summer. The volume of retail trade increased by 4.4% in August compared with July. However, this increase seems to have been largely driven by the postponement of the sales period from July to August in some countries. Taking the July and August data together, retail trade stood 0.4% higher than in June. New passenger car registrations in the euro area have returned to their pre-COVID-19 level, standing in September only 1.0% below their level one year ago. Consumer confidence declined in October after increasing for two consecutive months. Households are increasingly reporting that their financial situation is deteriorating. As a result, their intentions to make major purchases remain at their lowest level since the sovereign debt crisis.
The recovery in demand for goods remains uneven. Total retail trade has fully recovered from its earlier collapse following the outbreak of the pandemic in Europe, but this conceals a highly heterogeneous recovery across sub-categories. The retail sale of automotive fuel remained below its pre-COVID-19 level in July and August, as people continue to travel less. Likewise, households are purchasing less clothing and footwear owing to social distancing measures. In contrast, purchases of audio and video equipment are higher than before the pandemic. As infection rates have started to rise again recently, precautionary saving is expected to remain high. Consequently, the saving rate is expected to have declined in the third quarter, but to remain well above pre-COVID-19 levels.
Following the 20.8% drop in the second quarter, euro area business investment is likely to have rebounded in the third quarter in terms of growth rates, but the level of investment remains far below the pre-COVID-19 level. Industrial production of capital goods stood, on average in July and August, some 23% above its level in the second quarter. Given the typically close relationship with investment in machinery and equipment, a sharp rise in business investment is also expected in the third quarter. However, in the coming quarters, in addition to the uncertainty associated with the development of the pandemic, there is a risk that the recovery in investment will slow significantly. First, firms’ balance sheets have deteriorated. In crisis periods, many companies with low revenues and profits traditionally postpone or cancel all non-essential business spending, which includes capital investment. Second, firms’ capacity utilisation recovered in the third quarter of 2020 to stand at 72%, but remains 11% below the level recorded in the period prior to the COVID-19 outbreak. Third, firms’ order books remain at very low levels.
After the 12.4% contraction in the second quarter, the strong rebound in housing investment expected for the third quarter should give way to a moderation in the pace of the recovery. In the first half of 2020 euro area housing investment dropped by 14.4% relative to the end of 2019, albeit with markedly different developments across the largest euro area countries – ranging from a rise of 0.8% in Germany to a decline of 31.5% in Spain. In fact, the outbreak of the COVID-19 pandemic induced a widespread shutdown of construction sites and limited the issuance of building permits. Nevertheless, this was partly alleviated by the large backlog of construction plans (especially in Germany and the Netherlands) and was accompanied by a reduction in transaction volumes with no visible effects on house prices up to the second quarter. As several countries started loosening containment measures from May to September, construction activity resumed in the third quarter, benefiting also from a broad-based decline in limits to production for companies, signalling similar dynamics in housing investment. Nevertheless, the euro area PMIs for construction output and business expectations were below the expansionary threshold in September, signalling subdued activity over the short term. This moderation in the construction sector may also be related to the recent increase in restrictions across jurisdictions aimed at containing a new rise in infections. Further downside risks to the medium-term outlook for housing investment may stem from the increased risk on real estate firms’ balance sheets, on the supply side, and the persistent uncertainty inducing households and investors to postpone transactions, on the demand side.
After collapsing in the second quarter, euro area trade rebounded strongly in the third quarter of 2020. Data on nominal trade in goods for July and August display a continuation of the recovery that started in May alongside the easing of COVID-19-related restrictions. In August euro area nominal exports and imports of goods rose by 4.0% and 2.7%, month on month, respectively. However, these figures still reflect a slowdown compared with July. The fourth consecutive month of expansion brought extra-euro area trade to 11.0% below its February level in August. Since July extra-euro area exports have risen across all destinations except Asia. Export volumes in some categories (namely chemicals and animal and vegetable oil), which had increased strongly during the onset of the pandemic in March and April, faltered from May to July. At the same time, exports of cars and fuel improved most strongly among the consumption sub-categories. The first two months of the third quarter of 2020 point to a marked rebound of manufacturing trade in quarterly terms. Leading indicators signal further improvement in the months ahead. The flash PMI for euro area manufacturing new export orders increased to 56.0 in October, after a strong performance in September. Firms’ assessments of their export order book levels, according to the European Commission’s business surveys, confirm improving conditions for manufacturing trade. This view is also supported by shipping indicators. However, euro area exports of services are undergoing a contraction that is not foreseen to end in the coming months. After a recovery following the easing of mobility restrictions, the PMI for euro area services new export orders worsened in August and was, in October, still in clear contractionary territory, at 39.6.
While economic indicators, particularly survey results, clearly point to a strong rebound in growth in the third quarter, they have recently lost some momentum, pointing to a significant slowdown in the final quarter of the year. Both the European Commission’s Economic Sentiment Indicator and the composite output PMI rose between the second and third quarters of 2020, in line with a strong rebound in growth. This pick-up in economic activity is also confirmed by high-frequency indicators such as electricity consumption. However, the PMI decreased in September and October (falling to 49.4 compared with its recent peak of 54.9 in July), indicating a slowdown in growth in the fourth quarter of this year. It is clear that services have been more adversely affected by the pandemic than industry. This largely reflects the higher sensitivity of services to social distancing measures and the relatively sharper fall in growth in the services sector following the onset of the pandemic and the associated containment measures.
Looking further ahead, a sustained recovery remains highly dependent on the course the pandemic takes and the success of the containment policies. While the uncertainty surrounding COVID-19 is likely to dampen the strength of the recovery in the labour market and in consumption and investment, the euro area economy should continue to be supported by favourable financing conditions and an expansionary fiscal stance. The results of the latest round of the ECB Survey of Professional Forecasters, conducted in early October, show that private sector GDP growth forecasts have been revised upwards for 2020 and downwards for 2021 compared with the previous round conducted in early July.
4 Prices and costs
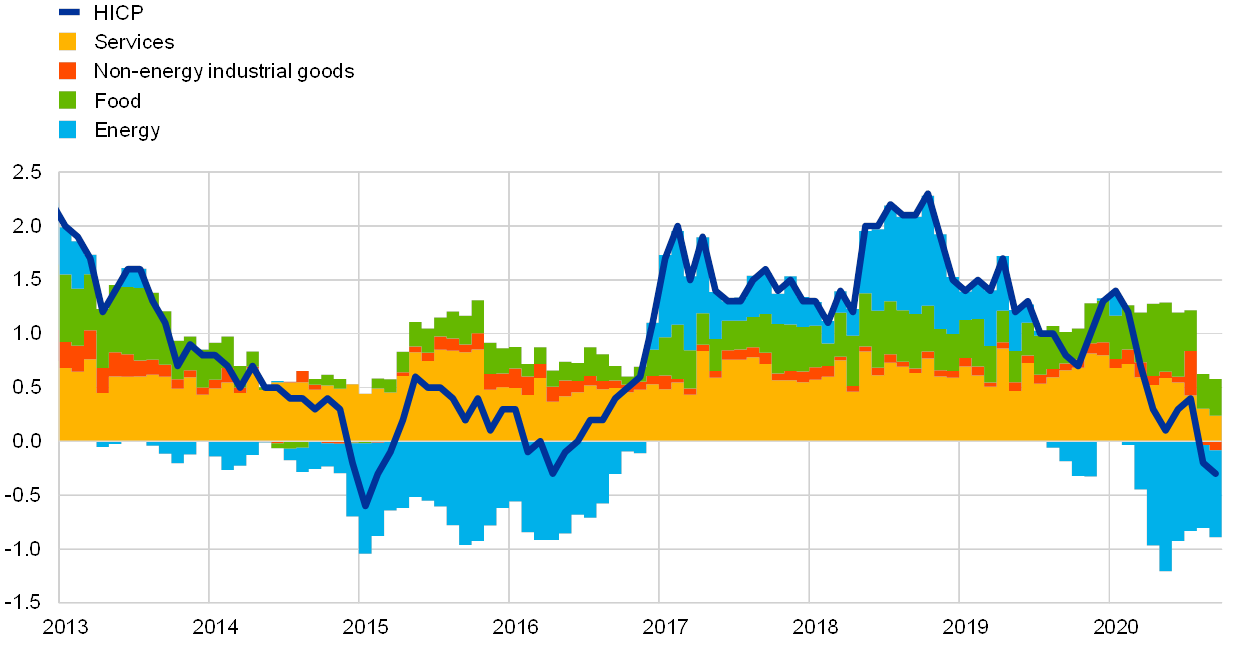
Headline inflation became slightly more negative in September 2020. The decrease to -0.3% from -0.2% in August reflects lower inflation for energy, non-energy industrial goods and services, while food inflation increased marginally (see Chart 7).
Chart 7
Contributions of components of euro area headline HICP inflation
(annual percentage changes; percentage point contributions)
Sources: Eurostat and ECB calculations.
Notes: The latest observations are for September 2020. Growth rates for 2015 are distorted upwards owing to a methodological change (see the box entitled “A new method for the package holiday price index in Germany and its impact on HICP inflation rates”, Economic Bulletin, Issue 2, ECB, 2019).
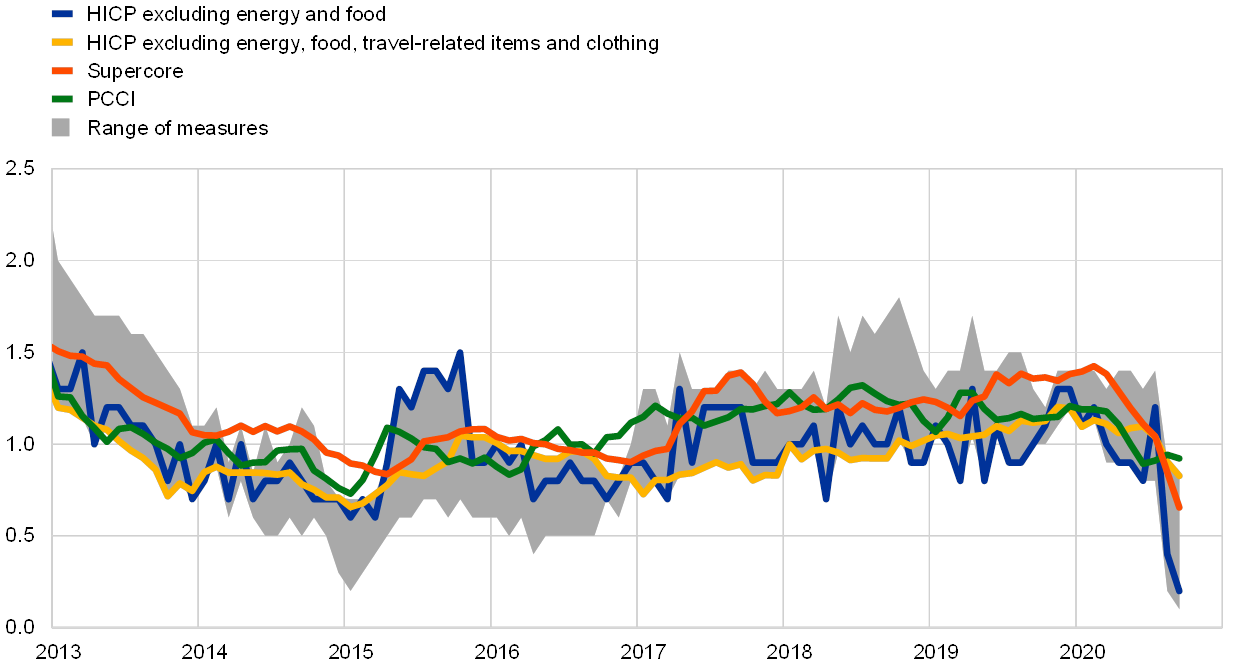
Measures of underlying inflation declined. HICP inflation excluding energy and food (HICPX) dropped from 0.4% in August to 0.2% in September, a new historical low. This reflects a decline in services inflation from 0.7% in August to 0.5% in September, with subdued services inflation in recent months mainly attributable to falling prices related to tourism and travel. It also reflects a decline in inflation for non-energy industrial goods from -0.1% in August to -0.3% in September, with part of this weakness probably reflecting the fact that in some euro area countries the seasonal sales of clothing and footwear were extended to non-summer items. Recent low readings in HICPX inflation also reflect the temporary reduction in German VAT rates since July 2020. Stripping out travel-related items and clothing from HICPX gives an inflation rate of 0.8% in September, compared with 0.9% in August and 1.0% in July, which suggests that there could be a more broad-based weakness in underlying inflation owing to subdued demand. This is also signalled by the Supercore indicator, which is made up of cyclically sensitive HICP items and declined to 0.7% in September from 0.8% in August, also marking a historical low.[3]
Chart 8
Measures of underlying inflation
(annual percentage changes)
Sources: Eurostat and ECB calculations.
Notes: The latest observations are for September 2020. The range of measures of underlying inflation consists of the following: HICP excluding energy; HICP excluding energy and unprocessed food; HICP excluding energy and food; HICP excluding energy, food, travel-related items and clothing; the 10% trimmed mean of the HICP; the 30% trimmed mean of the HICP; and the weighted median of the HICP. PCCI stands for the Persistent and Common Component of Inflation indicator. Growth rates for the HICP excluding energy and food for 2015 are distorted upwards owing to a methodological change (see the box entitled “A new method for the package holiday price index in Germany and its impact on HICP inflation rates”, Economic Bulletin, Issue 2, ECB, 2019).
Pipeline price pressures for HICP non-energy industrial goods provide mixed signals. Inflation for imported non-food consumer goods fell to -1.3% in August, down by 0.5 percentage points from July. This probably reflects – at least in part – the appreciation of the exchange rate of the euro from July to August. Domestic producer price inflation for non-food consumer goods weakened only slightly to 0.6% in August from 0.7% in July, remaining in the vicinity of its longer-term average. At the earlier input stages, the annual rate of change in producer prices for intermediate goods rose slightly from -2.0% in July to -1.9% in August, while the annual rate of change in import prices for intermediate goods fell from -2.4% in July to -2.6% in August. Global non-energy producer price inflation[4] increased in July and August, albeit from low levels, and year-on-year rates of change in non-oil commodity prices have also been rising strongly, suggesting no further weakening of price pressures from the external side and at the early stages of the supply chain. However, lower oil prices and a stronger nominal effective exchange rate in September may imply continuing weakness in domestic intermediate goods prices and import prices beyond August.
Wage pressures are blurred by the impact of government support measures on compensation. Growth in compensation per employee and compensation per hour diverged strongly in the first half of 2020. Annual growth in compensation per employee fell to -4.7% in the second quarter, from 0.6% in the first quarter and 1.6% in the fourth quarter of 2019, while annual growth in compensation per hour increased from 2.0% in the fourth quarter of 2019 to 4.6% in the first quarter of 2020, and further to 9.4% in the second quarter. These contrasting developments reflect the impact of short-time work and temporary lay-off schemes, under which workers maintained their employment status but only received part of their usual compensation, while actual hours worked per person declined sharply. At the same time, the decrease in compensation per employee overstates the actual loss in labour income, as a number of countries record government support, for statistical purposes, under transfers rather than compensation.[5] Negotiated wages, which are not directly affected by developments in hours worked and the recording of benefits from job retention schemes, grew by 1.7% in the second quarter of 2020, after 1.9% in the first quarter. While this implies only a slow weakening, the data still include agreements that were concluded before the onset of the pandemic.
The rise in market-based indicators of longer-term inflation expectations came to a halt at pre-pandemic levels in the period under review (10 September to 28 October), while survey-based indicators of longer-term inflation expectations were broadly unchanged. Market-based indicators of longer-term inflation expectations reached historical lows in mid-March but then steadily increased, reflecting improvements in the global macroeconomic outlook and risk sentiment, as well as sizeable monetary and fiscal support. In the review period, however, the five-year forward inflation-linked swap rate five years ahead did not rise further, standing at 1.13% on 28 October. This level is still 41 basis points above its historical (mid-March) low of 0.72%. At the same time, the forward profile of market-based indicators of inflation expectations continues to indicate a prolonged period of low inflation. Inflation options markets also still signal considerable downside risks in the near term, as underlying deflation probabilities remain at historically elevated levels. The ECB Survey of Professional Forecasters (SPF) for the fourth quarter of 2020 showed shorter-term HICP inflation expectations edging down slightly further, while longer-term inflation expectations remained broadly unchanged (see Chart 9). Average point forecasts for annual HICP inflation stood at 0.3% for 2020, 0.9% for 2021 and 1.3% for 2022, representing a downward revision of 0.1 percentage points for 2020 and 2021, which appears to reflect the impact of the latest data outcomes. Longer-term inflation expectations (for 2025) averaged 1.7%, compared with 1.6% in the previous round of the survey. The upward revision was beyond the first decimal and very marginal.
Chart 9
Market and survey-based indicators of inflation expectations
(annual percentage changes)
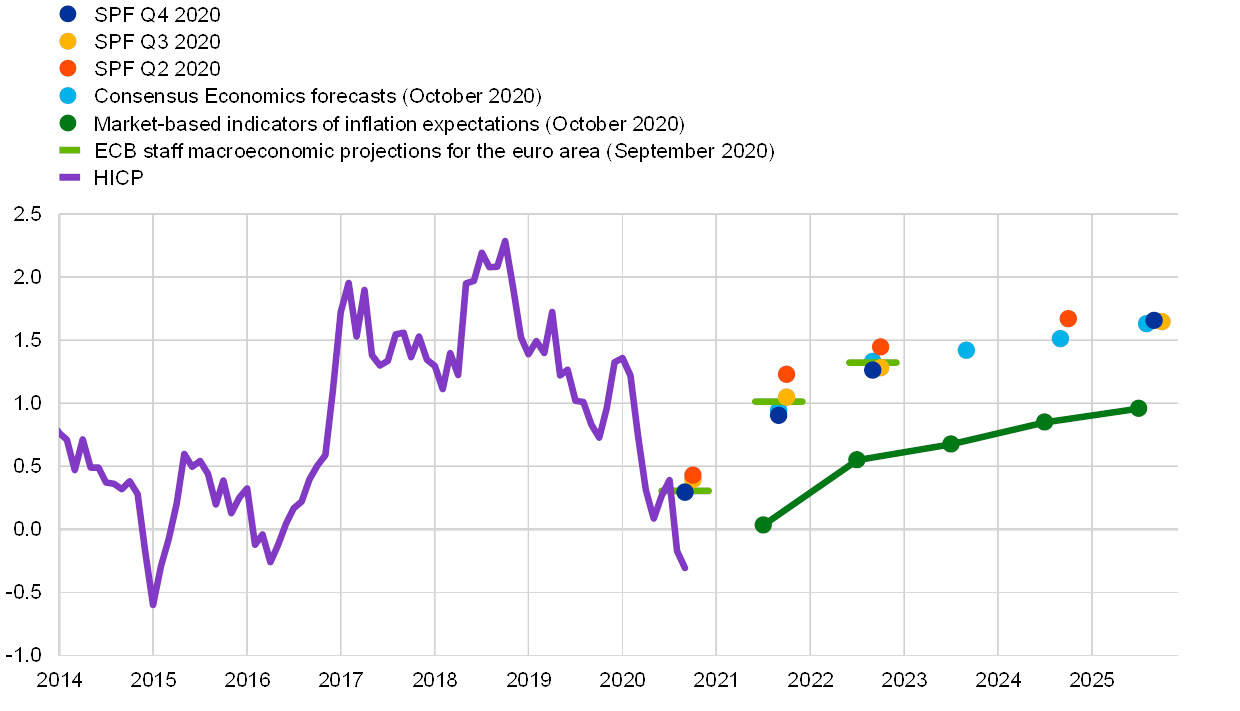
Sources: ECB Survey of Professional Forecasters (SPF), ECB staff macroeconomic projections for the euro area (September 2020) and Consensus Economics (15 October 2020).
Notes: The SPF for the fourth quarter of 2020 was conducted between 2 and 9 October 2020. The market-implied curve is based on the one-year spot inflation rate and the one-year forward rate one year ahead, the one-year forward rate two years ahead, the one-year forward rate three years ahead and the one-year forward rate four years ahead. The latest observations for market-based indicators of inflation expectations are for 28 October 2020.
5 Money and credit
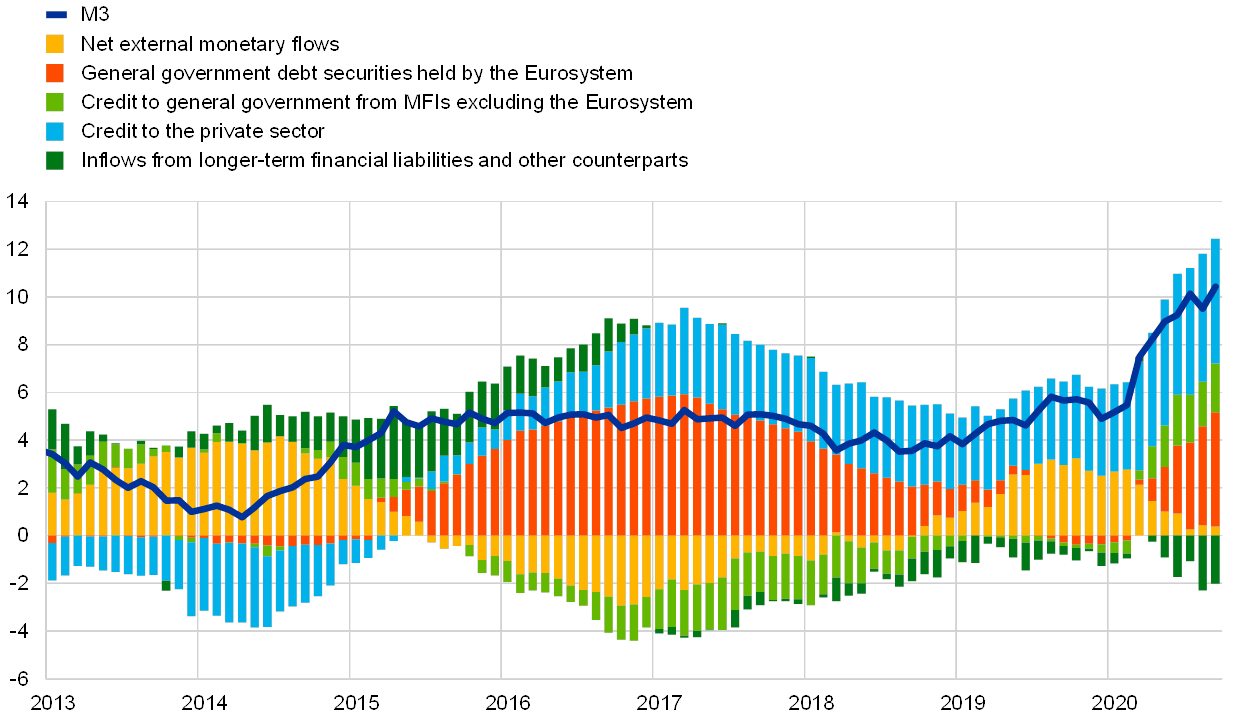
Broad money growth increased further in September. The broad monetary aggregate (M3) recorded another large inflow, pointing to an ongoing build-up of liquidity amid uncertainty related to the coronavirus (COVID-19) crisis. The annual growth rate of M3 increased to 10.4% in September 2020, after 9.5% in August (see Chart 10). While the overall decline in economic activity in 2020 dampened annual M3 growth, substantial support came from the extraordinary liquidity demand of firms and households in the context of the ample supply of liquidity provided by the Eurosystem. The increase in M3 was mainly driven by the narrow aggregate M1, which includes the most liquid components of M3. The annual growth rate of M1 increased from 13.2% in August to 13.8% in September. This development was mainly attributable to a further increase in the annual growth rates of overnight deposits held by firms and households, for which an important driver was a strong preference for liquidity. Other short-term deposits and marketable instruments made a small, positive contribution to annual M3 growth in September.
Domestic credit has continued to be the main source of money creation. The Eurosystem’s net purchases of government securities under the ECB’s asset purchase programme (APP) and the pandemic emergency purchase programme (PEPP) made a larger contribution to M3 growth in September 2020 than in previous months (see the red portion of the bars in Chart 10). Credit to the private sector, which was mainly driven by higher loans to non-financial corporations, lost some of its momentum but still remained at elevated levels (see the blue portion of the bars in Chart 10). Further support to M3 growth came from a modest increase in the contribution from credit to general government from monetary financial institutions (MFIs) excluding the Eurosystem (see the light green portion of the bars in Chart 10), but the respective flows have been very limited in recent months. As in previous months, the contribution from annual net external monetary flows remained small in September (see the yellow portion of the bars in Chart 10), while longer-term financial liabilities and other counterparts had a dampening impact on broad money growth.
Chart 10
M3 and its counterparts
(annual percentage changes; contributions in percentage points; adjusted for seasonal and calendar effects)
Source: ECB.
Notes: Credit to the private sector includes monetary financial institution (MFI) loans to the private sector and MFI holdings of securities issued by the euro area private non-MFI sector. As such, it also covers the Eurosystem’s purchases of non-MFI debt securities under the corporate sector purchase programme. The latest observation is for September 2020.
Growth in loans to the private sector remained at elevated levels in September. The annual growth rate of bank loans to the private sector was unchanged at 4.6% in September 2020 (see Chart 11), as it was for loans to non-financial corporations (NFCs), at 7.1%, although monthly lending flows to NFCs continued to moderate. Annual growth of loans to households remained almost unchanged at 3.1% in September, from 3.0% in August. Banks responding to the euro area bank lending survey reported a moderate fall in firms’ net loan demand in the third quarter, reflecting a decline in emergency liquidity needs and weakening fixed investment. For the fourth quarter of 2020, surveyed banks reported the expectation of a renewed increase in demand for loans to firms and decreasing demand for loans to households, which may signal the re-emergence of liquidity needs of firms in the context of the intensification of the COVID-19 pandemic. The divergence in the dynamics of loans to firms and loans to households is driven by the specific nature of the COVID-19 crisis, which has led to a collapse in corporate cash flows and compelled firms to strongly step up their reliance on external financing.
Chart 11
Loans to the private sector
(annual growth rate)

Source: ECB.
Notes: Loans are adjusted for loan sales, securitisation and notional cash pooling. The latest observation is for September 2020.
The October 2020 euro area bank lending survey shows a significant tightening of credit standards for loans to firms and to households in the third quarter of 2020, mainly on account of higher risk perceptions. While credit standards were supported by government loan guarantees and monetary policy measures, banks continued to indicate risk perceptions (related to the deterioration in the general economic outlook and the firm-specific situation) as the main factor contributing to their tightening. For the fourth quarter of 2020, banks expect a further net tightening of credit standards for firms. Credit standards for housing loans and for consumer credit continued to tighten significantly in the third quarter of 2020, against a background of deteriorating income and employment prospects. Net demand for housing loans and for consumer credit increased in the third quarter, after a considerable decline in the previous quarter, also benefiting from the temporary abatement of the pandemic and the concomitant easing of restrictions. Banks expect a further net tightening of credit standards for households and a fall in housing loan demand in the fourth quarter of 2020. Banks also indicated that the ECB’s asset purchase programmes (APP and PEPP) and the third series of targeted longer-term refinancing operations (TLTRO III) had a positive impact on their liquidity position and market financing conditions. Furthermore, together with the negative deposit facility rate, banks reported that these measures had an easing impact on bank lending conditions and a positive impact on lending volumes. At the same time, banks suggested that the ECB’s asset purchases and the negative deposit facility rate had a negative impact on their net interest income, while a large percentage of banks reported that the ECB’s two-tier system supported bank profitability.
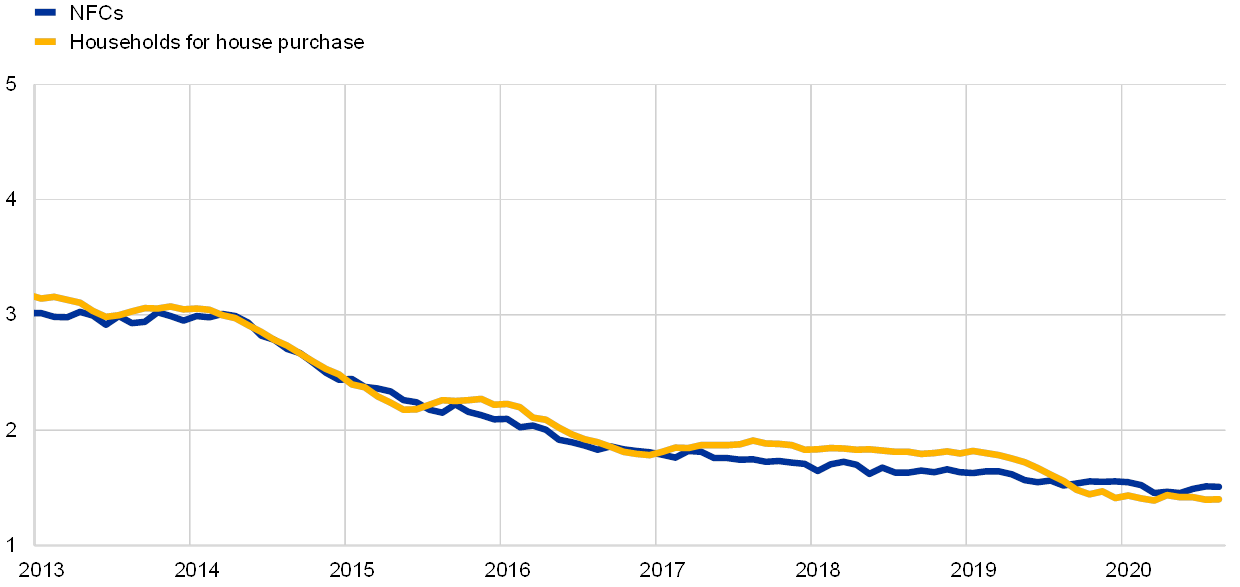
Favourable lending rates have continued to support euro area economic growth. Lending rates have stabilised around their historical lows, broadly in line with developments in market reference rates. In August 2020 the composite bank lending rates for loans to NFCs and households remained broadly unchanged at 1.51% and 1.40% respectively (see Chart 12). These favourable rates continued to reflect the beneficial impact on credit supply conditions originating from the ECB’s accommodative monetary policy and the crisis response by national authorities, including via loan guarantee schemes. Together, these measures remain essential to dampen upward pressures on bank lending rates in a difficult and uncertain economic environment.
Chart 12
Composite bank lending rates for NFCs and households
(percentages per annum)
Source: ECB.
Notes: Composite bank lending rates are calculated by aggregating short and long-term rates using a 24-month moving average of new business volumes. The latest observation is for August 2020.
Boxes
1 A revised weighting scheme for the international environment projections
The September 2020 ECB staff macroeconomic projections used a revised weighting scheme for the euro area’s trading partners.[6] The country weights are important for calculating foreign demand and the export prices of competitors. Both of these are used as conditioning assumptions in the macroeconomic projections for the euro area and for euro area countries.[7] This revision follows a recent enhancement of the method employed to calculate euro effective exchange rate indices. The latter was done to take account of the development of international trade linkages and, in particular, the growing importance of international trade in services.[8] This box discusses the impact of the revised weighting scheme on euro area foreign demand and export prices of competitors. It also touches upon updated weights used to calculate global aggregates for the purpose of the international environment projections prepared by ECB staff.
More2 New euro area statistics on insurance corporations’ premiums, claims and expenses
August 2020 marked the ECB’s first release of statistics on insurance corporations’ written premiums, incurred claims and acquisition expenses.[9] The data are annual and are available from 2017. For the euro area aggregate data, a breakdown by type of insurer (reinsurance, life, non-life and composite) is available. In addition, a breakdown by country is also provided for the total insurance sector. These data complement the ECB’s quarterly statistics on the assets and liabilities of the insurance corporation sector.[10]
More3 Consumption patterns and inflation measurement issues during the COVID-19 pandemic
The coronavirus (COVID-19) pandemic has generated challenges in measuring consumer price inflation as a result of changes in consumption patterns and limitations in price collection. The pandemic has generated two main challenges when measuring consumer price inflation. First, the pandemic triggered unusually large changes in household spending patterns which are not reflected in aggregated consumer price indices.[11] Second, price collection was affected by the lockdown, and the missing observations therefore needed to be imputed.[12] This box discusses the gap between the Harmonised Index of Consumer Prices (HICP) and the development of prices for the goods and services actually purchased by final consumers. The box also discusses how imputation has affected published HICP statistics.[13]
MoreArticles
1 The impact of COVID-19 on potential output in the euro area
Potential output is typically defined as the highest level of economic activity that can be sustained by means of the available technology and factors of production without pushing inflation above its target. Attempts to exceed this level of production will lead to rising levels of factor utilisation (and a positive output gap, defined as the difference between actual and potential output), thereby putting upward pressure on factor costs and ultimately on consumer price inflation. In contrast, when actual output is lower than potential output, there is slack in the economy (the output gap turns negative), putting downward pressure on factor costs and consumer price inflation. Since potential output cannot be observed directly, it must be inferred from existing data using statistical and econometric methods. There are various methods for estimating and projecting potential output and they are all subject to considerable uncertainty.[14]
More2 European financial integration during the COVID-19 crisis
This article provides an overview of financial fragmentation during the coronavirus (COVID-19) crisis and the policies enacted to counter its effects. It does so through the lens of a set of high-frequency indicators for monitoring developments in financial integration. The readings from these indicators are then linked to unfolding economic and political events and to the main policy responses in monetary, fiscal and financial stability policy at the national and European levels. After initial sharp fragmentation, euro area financial integration broadly recovered to pre-crisis levels by mid-September, but not for all indicators. However, this recovery is still fragile and relies on an unprecedented amount of fiscal, monetary and prudential policy support.
More3 New pension fund statistics
Pension funds play an important role in the euro area economy. They provide an opportunity for households to save for retirement and, at the same time, help the efficient allocation of long-term capital. Pension-related assets are typically one of the main assets of households (representing around 20% of euro area households’ net financial wealth), particularly in countries where occupational pensions are prevalent.
MoreStatistics
Statistical annex© European Central Bank, 2020
Postal address 60640 Frankfurt am Main, Germany
Telephone +49 69 1344 0
Website www.ecb.europa.eu
All rights reserved. Reproduction for educational and non-commercial purposes is permitted provided that the source is acknowledged.
This Bulletin was produced under the responsibility of the Executive Board of the ECB. Translations are prepared and published by the national central banks.
The cut-off date for the statistics included in this issue was 28 October 2020.
For specific terminology please refer to the ECB glossary (available in English only).
ISSN 2363-3417 (html)
ISSN (pdf)
QB-BP-20-007-EN-Q (html)
QB-BP-20-007-EN-N (pdf)
- The methodology for computing the EONIA changed on 2 October 2019; it is now calculated as the €STR plus a fixed spread of 8.5 basis points. See the box entitled “Goodbye EONIA, welcome €STR!”, Economic Bulletin, Issue 7, ECB, 2019.
- This assessment reflects information from the latest survey results and empirical estimates of “genuine” rate expectations, i.e. forward rates net of term premia.
- For further information on this and other measures of underlying inflation, see Boxes 2 and 3 in the article entitled “Measures of underlying inflation for the euro area”, Economic Bulletin, Issue 4, ECB, 2018.
- The global Producer Price Index (PPI) excluding the energy sector is an ECB estimate.
- For more information, see the box entitled “Short-time work schemes and their effects on wages and disposable income”, Economic Bulletin, Issue 4, ECB, 2020.
- See Box 2, “The international environment”, ECB staff macroeconomic projections for the euro area, September 2020.
- For further details on the calculation of these assumptions and the methodology used to construct the weights, see Hubrich, K. and Karlsson, T., “Trade consistency in the context of the Eurosystem projection exercises an overview”, Occasional Paper Series, No 108, ECB, March 2010.
- For further details, see the box entitled “The ECB’s enhanced effective exchange rate measures”, Economic Bulletin, Issue 6, ECB, 2020.
- Premiums written are amounts due during the financial year in respect of insurance contracts, regardless of the fact that such amounts may relate in whole or in part to a later financial year. Claims incurred relate to insured claim events taking place during the financial year. Acquisition expenses comprise commission costs and the costs of selling, underwriting and initiating an insurance contract, including renewal expenses. The data are released on the ECB’s Statistical Data Warehouse (SDW) online platform.
- Data are available on the SDW.
- Consumer price indices (CPIs) use a fixed basket approach. This means that they keep expenditure weights constant between the base period and the reference period, assuming that relative consumption shares do not change. Therefore they do not capture changes in consumption patterns.
- For a detailed discussion on this point, see the box entitled “Inflation measurement in times of economic distress”, Economic Bulletin, Issue 3, ECB, 2020.
- Aspects related to social, health and environmental phenomena can have an impact on household utility related to consumption. Specific theoretical inflation measurement concepts try to account for some of these factors. However, there is no such quality adjustment in the HICP for a possible fall in the utility of certain services owing to infection risks and social distancing requirements such as those currently being experienced by consumers. An assessment of this issue is outside the scope of this box, which focuses on changing consumption patterns.
- See the article entitled “Potential output in the post-crisis period”, Economic Bulletin, Issue 7, ECB, 2018.


