What does the bank lending survey tell us about credit conditions for euro area firms?
Published as part of the ECB Economic Bulletin, Issue 8/2019.
This article examines bank lending conditions for euro area non-financial corporations (NFCs), making use of the wealth of soft information available in the euro area bank lending survey (BLS) since its inception in 2003. One relevant question in this context is whether the tightening of the bank loan supply during the financial and sovereign debt crises has been offset by the easing of bank lending conditions for loans to NFCs since 2014. The article illustrates that the easing over this period has come mainly through a substantial loosening of the actual terms and conditions applied by banks to new loans to firms of average credit quality, while the credit standards that banks have established for their loan approval decisions have eased by less. The article also draws on the responses of individual banks to examine the differences in bank lending conditions for NFC loans over time and across bank business models. This analysis reveals that the change in credit conditions of banks with business models more reliant on stable funding sources, such as deposits, is more muted. In short, it looks at additional aspects that enhance the regular assessment of bank lending conditions faced by firms based on the euro area BLS.
1 Introduction
The euro area bank lending survey (BLS) provides a rich set of soft information on changes to bank lending conditions, which complements and potentially enhances hard statistical data on loan growth. When combined with actual loan growth and lending rates, this unique set of information helps us to understand developments in loan supply and demand and the related driving factors. In addition, BLS data have been shown to have strong leading indicator properties vis-à-vis aggregate movements in loan volumes. Against this background, BLS survey information is regularly monitored and assessed to gain insights into bank lending conditions directly from reporting euro area banks.[2] This article focuses on bank lending conditions for euro area firms, drawing on the wealth of information available in the BLS, from both an aggregate and individual bank-level perspective.
What can the euro area BLS tell us about the credit conditions faced by euro area firms over the past 10-15 years? Following the severe tightening of banks’ approval criteria for loans to non-financial corporations (NFCs) during the financial and sovereign debt crises, an unprecedented extended easing period was observed from the beginning of 2014 up to early 2019. More recently, there has been some variation in the changes made by banks to their loan approval criteria amid concerns about the euro area economic outlook. Against this background, the article takes a longer-term perspective on the BLS evidence, covering the period since the onset of the global financial crisis, and focuses on three distinct aspects.
First, this article reviews the long-term developments in credit standards and the related contributing factors. Differences in the importance of these driving factors over time are analysed with a view to gaining a better understanding of changes in bank lending conditions. It turns out that the perception of risks in relation to the economic outlook is an important driving factor behind bank lending conditions, particularly during periods when credit standards are tightened.
Second, it examines whether the tightening of bank lending conditions during the financial and sovereign debt crises has been offset by the easing of bank lending conditions for NFC loans since 2014. The article analyses the information from changes in banks’ credit standards and terms and conditions, which cover complementary aspects, mainly relating to loan supply. While actual bank lending conditions for average NFC loans have loosened substantially since 2014 and appear to have returned to levels similar to those seen at the beginning of the financial crisis, banks’ credit standards have eased by less. In this context, banks’ supervisory requirements, the need to strengthen their balance sheets and the avoidance of heightened credit risk emerge as likely factors behind the moderate loosening of banks’ loan approval criteria.
Third, the article provides evidence on bank lending conditions across bank business models. Based on a new BLS dataset that makes it possible to group banks’ responses based on their business model, bank loan supply conditions are analysed over time, and similarities as well as differences across business models are highlighted. Importantly, business models with relatively stable funding sources show more moderate variations in credit conditions compared with other bank types. In short, this article looks at additional aspects that enhance the regular assessment of bank lending conditions based on the euro area BLS.
2 Bank loan supply conditions for euro area firms
2.1 Banks’ credit standards for loans to euro area firms
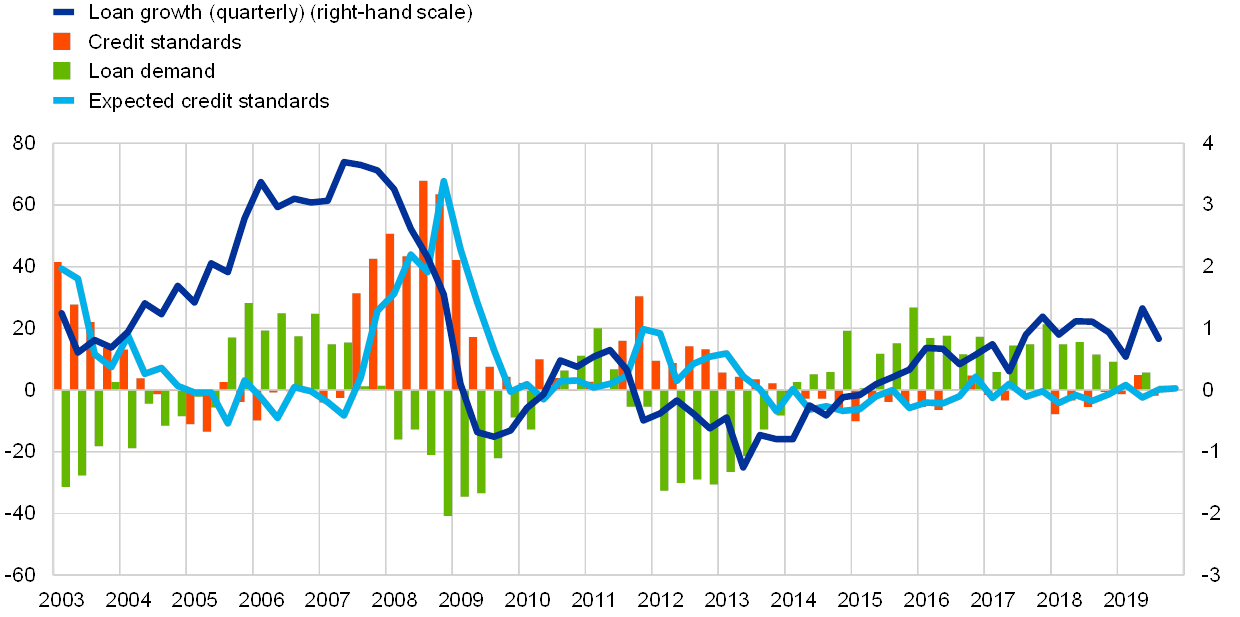
Credit standards, which reflect banks’ internal guidelines or loan approval criteria, are a key indicator of bank lending conditions.[3] They help to disentangle loan supply and demand in the analysis of loan growth developments (see Chart 1).[4] In addition, changes in credit standards for NFC loans lead actual NFC loan growth by around one year.[5] They are therefore helpful for assessing loan growth developments over the coming year. Moreover, banks’ expectations in relation to the development of their credit standards are generally an accurate reflection of their actual development, thereby providing further lead information on the development of bank lending conditions.
Chart 1
NFC loan supply, demand and NFC loan growth
(net percentages and quarterly growth rates)
Source: ECB.
Notes: For credit standards, net percentages are defined as the difference between the sum of the percentages of banks responding “tightened considerably” and “tightened somewhat” and the sum of the percentages of banks responding “eased somewhat” and “eased considerably”. For loan demand, net percentages are defined as the difference between the sum of the percentages of banks responding “increased considerably” and “increased somewhat” and the sum of the percentages of banks responding “decreased somewhat” and “decreased considerably”. While actual developments of credit standards and loan demand refer to the past three months, expected credit standards refer to banks’ expectations over the next three months and have therefore been shifted by one quarter.
The net easing of credit standards from 2014 up until early 2019 has been the longest net easing period since the inception of the BLS at the beginning of 2003. Following a drastic tightening of credit standards for euro area NFC loans between the third quarter of 2007 and the second half of 2011 during the euro area financial and sovereign debt crises (with a net peak of 68% at the time of the Lehman Brothers collapse in the third quarter of 2008), euro area banks started to ease credit standards in net terms in the first quarter of 2014. This net easing lasted for about 20 quarters (with an interruption in the second half of 2016) until the first quarter of 2019, equivalent to the longest net easing period since the BLS began. By comparison, the net easing period before the start of the financial crisis, from the third quarter of 2004 until the second quarter of 2007, lasted for 12 quarters. The net easing of banks’ approval criteria for corporate loans since 2014 supported the recovery in NFC bank loan growth and economic activity in the aftermath of the financial crisis. In the second and third quarters of 2019, there was some variation in the changes made by banks to their credit standards amid concerns about the euro area economic outlook, while actual lending rates remained at historically low levels.
2.2 Which factors have driven changes in credit standards for NFC loans?
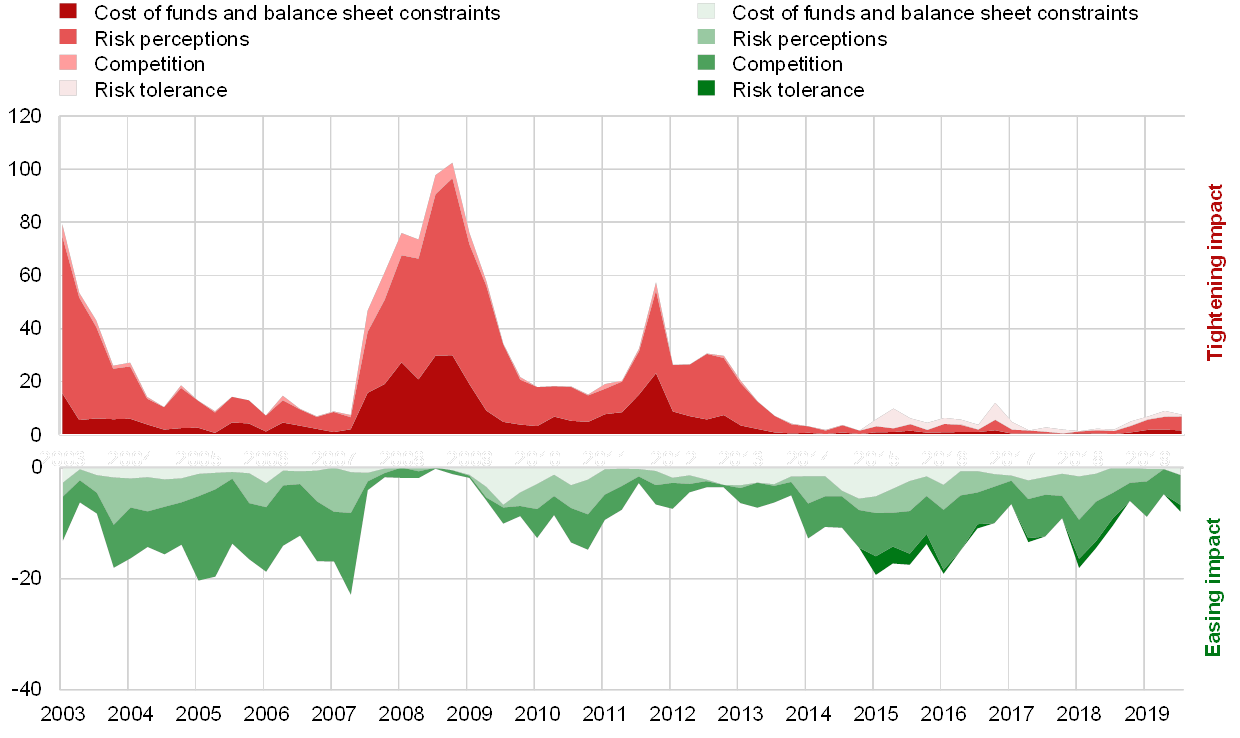
The factors driving changes in credit standards provide a better understanding of the reasons behind changes in banks’ loan approval criteria. Euro area banks also report the underlying factors which contribute to changes in credit standards. The importance of these factors evolves over time, depending on the state of the economy (see Chart 2). They help us gain additional insight into alterations in bank lending conditions and to differentiate between changes in bank loan growth that have been driven mainly by changes originating in the banking system, such as in banks’ funding cost or risk tolerance, and changes in the general economic environment that have an impact on bank loan supply owing to changes in borrowers’ credit risk or collateral, but which do not reflect pure loan supply effects.[6]
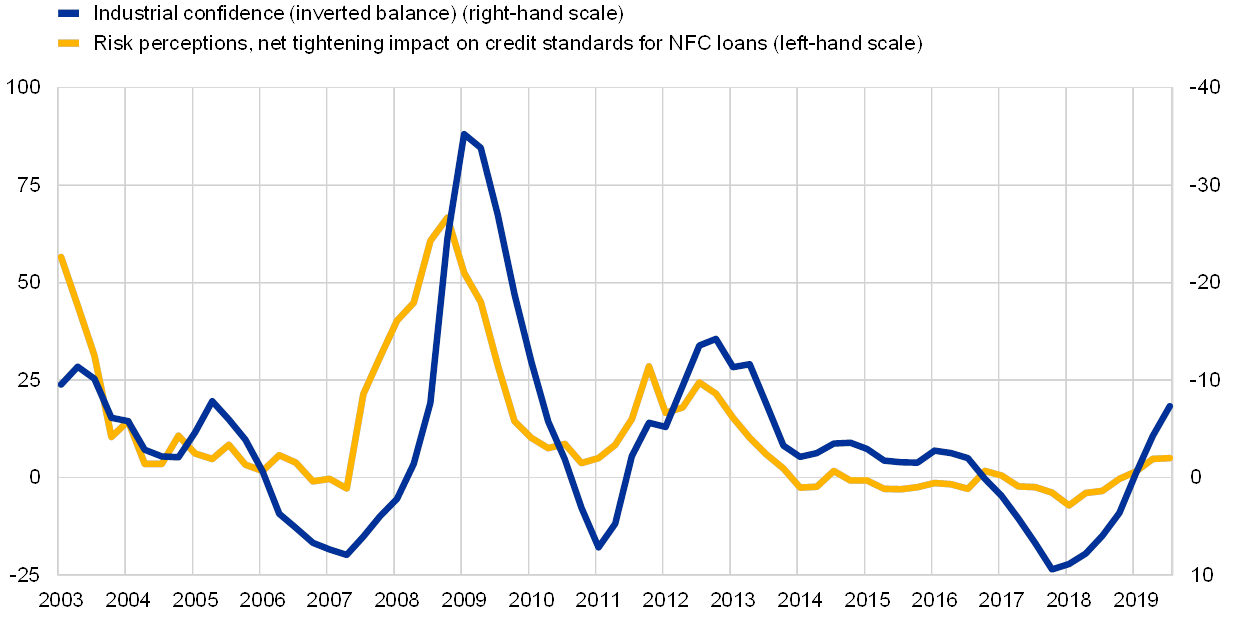
Risk perceptions regarding the economic outlook are the most important factor for explaining the changes in credit standards and are closely related to real economic developments. When looking at the factors that contribute to the changes in credit standards from the banks’ perspective, two main observations emerge (see Chart 2). First, and in keeping with the changes in credit standards for NFC loans, the tightening impact of these factors has been greater than the easing impact. Second, risk perceptions have been the most important factor for explaining the changes in credit standards over time (contributing an average net tightening of 13% since 2003). The high correlation with credit standards applies in particular to tightening periods, but risk perceptions also play an important role when banks ease their credit standards. They are closely related to the development of real economic and business sentiment indicators (see Chart 3). Therefore, risk perceptions signal the impact of changes in the economic outlook on credit standards, over and above the changes that originate in the banking system itself.[7]
Chart 2
Factors contributing to NFC credit standards
(percentages of banks)
Source: ECB (BLS).
Notes: “Cost of funds and balance sheet constraints” is the unweighted average of “costs related to capital position”, “access to market financing” and “liquidity position”; “risk perceptions” is the unweighted average of “general economic situation and outlook”, “industry or firm-specific situation and outlook/borrower’s creditworthiness” and “risk related to the collateral demanded”; “competition” is the unweighted average of “competition from other banks”, “competition from non-banks” and “competition from market financing”. “Banks’ risk tolerance” was introduced in the first quarter of 2015.
Chart 3
Banks’ risk perceptions and industrial confidence
(net percentages of banks and percentage balances)
Sources: ECB (BLS) and European Commission.
Notes: See Chart 2. The industrial confidence indicator refers to the European Commission DG-ECFIN opinion survey.
Banks’ cost of funds and balance sheet constraints play an important role, mainly in the tightening of credit standards, whereas the correlation between this factor and an easing of credit standards is rather small. In particular, banks’ capital position has had, on average, a tightening impact (with an average net percentage of 7% since 2003). In addition, banks’ cost of funds and balance sheet constraints contributed to a tightening of credit standards, particularly during the financial crisis, against the background of banks’ losses and associated deleveraging pressure as well as an increase in banks’ funding cost. As regards the relationship between the driving factors, a tightening contribution of risk perceptions has often been connected with a parallel tightening contribution of banks’ cost of funds and balance sheet situation. This is because a worsening of the economic outlook tends to lead to a deterioration in borrowers’ creditworthiness and increased credit risk, with negative implications for banks’ balance sheets.
By contrast, competitive pressure, mainly from other banks, is the most important factor for explaining an easing of credit standards. Specifically, the net easing of credit standards on NFC loans since 2014 has, to a large extent, been related to competitive pressures.
Lastly, banks’ risk tolerance has overall had a broadly neutral and, in some periods, small tightening impact on credit standards for NFC loans since 2015. This signals that, according to the banks, they have not reacted to low or negative interest rates by increasing their risk-taking.[8]
2.3 Why has the net easing of credit standards since 2014 been rather moderate?
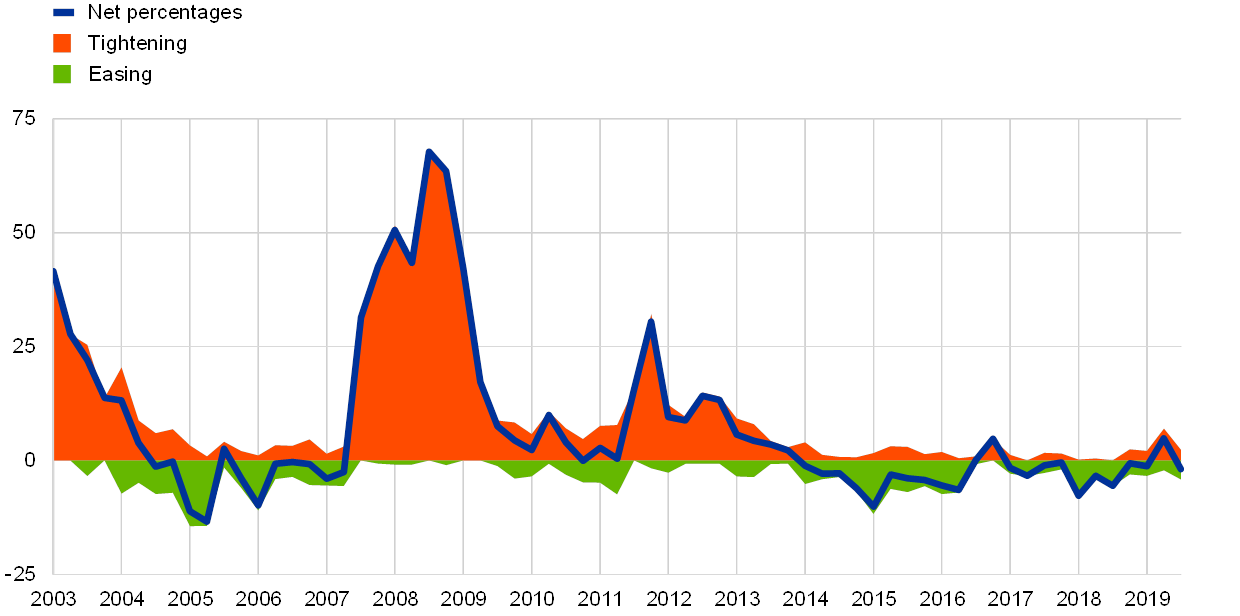
Banks’ overall easing of credit standards on corporate loans since 2014 appears moderate compared with the previous tightening (see Chart 4). When summing up the net percentage changes, the cumulated net easing of credit standards over the past five years, compared with the cumulated net tightening of credit standards for loans to euro area NFCs during the financial crisis, appears moderate despite the extended net easing period. Banks indicated the strongest net easing of their credit standards in the first quarter of 2015 (-10%), when the ECB introduced its asset purchase programme, close to the values reached before the onset of the financial crisis (with a negative peak of -13% in the second quarter of 2005).
Chart 4
Credit standards on NFC loans
(net percentages and percentages of banks)
Source: ECB (BLS).
Note: See Chart 1.
The overall moderate net easing suggests that credit standards are currently tighter than they were before the crisis. Corroborating evidence is also provided by the BLS ad hoc question on the level of credit standards, which complements the quarterly question on changes in credit standards on an annual basis. According to the banks’ responses, the level of banks’ credit standards for euro area NFC loans in the first quarter of 2019 was still tighter than the historical range of credit standards since 2003.[9] Several reasons may be behind the limited net easing of banks’ loan approval criteria.
First, generous lending conditions before the financial crisis have probably contributed to higher risk awareness of banks in their lending decisions since the crisis. Among the driving factors behind credit standards mentioned above, banks’ risk perceptions and willingness to take on credit risk matter considerably. They may contribute to explaining why banks have eased their credit standards only moderately since the financial crisis. In fact, while lax credit standards may have contributed to fuelling high NFC loan growth before the onset of the financial crisis, there are currently no indications of a heightened risk tolerance of euro area banks (see Section 2.2 above).
Chart 5
NFC credit standards and impact of supervisory and regulatory requirements on credit standards
(net percentages of banks)

Source: ECB (BLS).
Notes: See Chart 1. The question refers to regulatory or supervisory actions relating to capital, leverage, liquidity or provisioning that have recently been approved/implemented or that are expected to be approved/implemented in the near future. “SMEs” denote small and medium-sized enterprises.
Second, banks’ need to fulfil additional supervisory and regulatory requirements in the wake of the financial crisis has had a tightening impact on their credit standards. Euro area banks have stated that new regulatory and supervisory requirements have had, on average since 2011 (when the question was introduced), a tightening impact on their credit standards (see Chart 5). During the net easing period of NFC credit standards since 2014, the regulatory and supervisory impact on credit standards was neutral on average, suggesting that the previous tightening impact was not reversed. This is consistent with the broadly neutral impact of banks’ capital positions on banks’ credit standards for NFC loans during the net easing of credit standards since 2014.
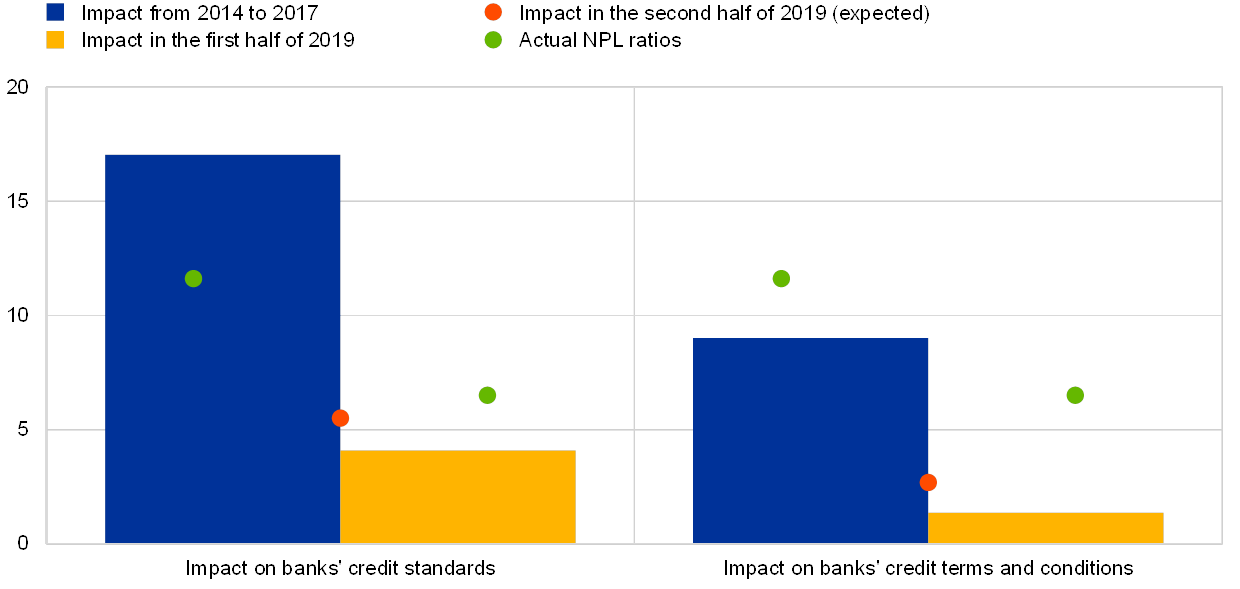
Third, in relation to banks’ need to clean up their balance sheets, non-performing loan (NPL) ratios have also had a tightening impact on banks’ credit standards. The tightening impact was particularly relevant in the period from 2014 to 2017 according to euro area banks,[10] in line with the level of actual NPL ratios of banks, but NPLs have also more recently continued to exert a tightening impact on banks’ credit standards (see Chart 6). Overall, banks have strengthened their balance sheets and, specifically, reduced their NPL ratios since 2014, supported by the ECB’s unconventional monetary policy measures. This has improved banks’ resilience. While this should contribute to favourable lending conditions in the medium term,[11] banks’ efforts to increase their resilience help to explain why the net easing of banks’ credit standards was not greater.
Chart 6
Impact of banks’ non-performing loan (NPL) ratios on bank lending conditions and actual NPL ratios for NFC loans
(net percentages of banks and percentages)
Source: ECB (BLS and Supervisory banking statistics).
Notes: In the BLS, the NPL ratio is defined as the stock of gross non-performing loans on banks’ balance sheets as a percentage of the gross carrying amount of loans. The actual NPL ratios refer to euro area significant institutions and are defined as the gross carrying amount of non-performing loans (and advances), as a percentage of total loans (and advances). They are calculated as an average over the respective periods (Q2 2015-Q4 2017 and the second half of 2019 respectively).
2.4 Credit terms and conditions for loans to euro area firms
Banks’ credit terms and conditions for new loans point to a considerable easing of the actual agreed lending conditions for NFC loans, which is more marked than for credit standards. While credit standards are defined as banks’ internal guidelines or loan approval criteria, banks’ terms and conditions are defined as the actual terms and conditions applied to a new loan, as agreed in the loan contract. The analysis of banks’ terms and conditions therefore complements the analysis of credit standards to provide an overall view on bank lending conditions.[12] Following a strong net widening of banks’ margins on loans of average credit risk (defined as the spread of bank lending rates over a relevant market reference rate) during the financial and sovereign debt crises, margins have narrowed since the second quarter of 2013 (see Chart 7). This trend has become more acute since the second quarter of 2014 in light of the new wave of ECB unconventional measures (see Chart 8 below), signalling an improved pass-through of monetary policy measures to bank lending rates. According to reporting banks, margins on average NFC loans narrowed continuously from 2014 until the first quarter of 2019. In the second and third quarters of 2019, banks’ overall terms and conditions tightened somewhat. Specifically, their margins on riskier NFC loans widened, while margins on average NFC loans in total broadly stabilised.
Chart 7
Margins on NFC loans
(net percentages and percentages of banks)

Source: ECB (BLS).
Notes: “Margins” are defined as the spread over a relevant market reference rate. Net percentages are defined as the difference between the sum of the percentages of banks responding “tightened/widened considerably” and “tightened/widened somewhat” and the sum of the percentages of banks responding “eased/narrowed somewhat” and “eased/narrowed considerably”.
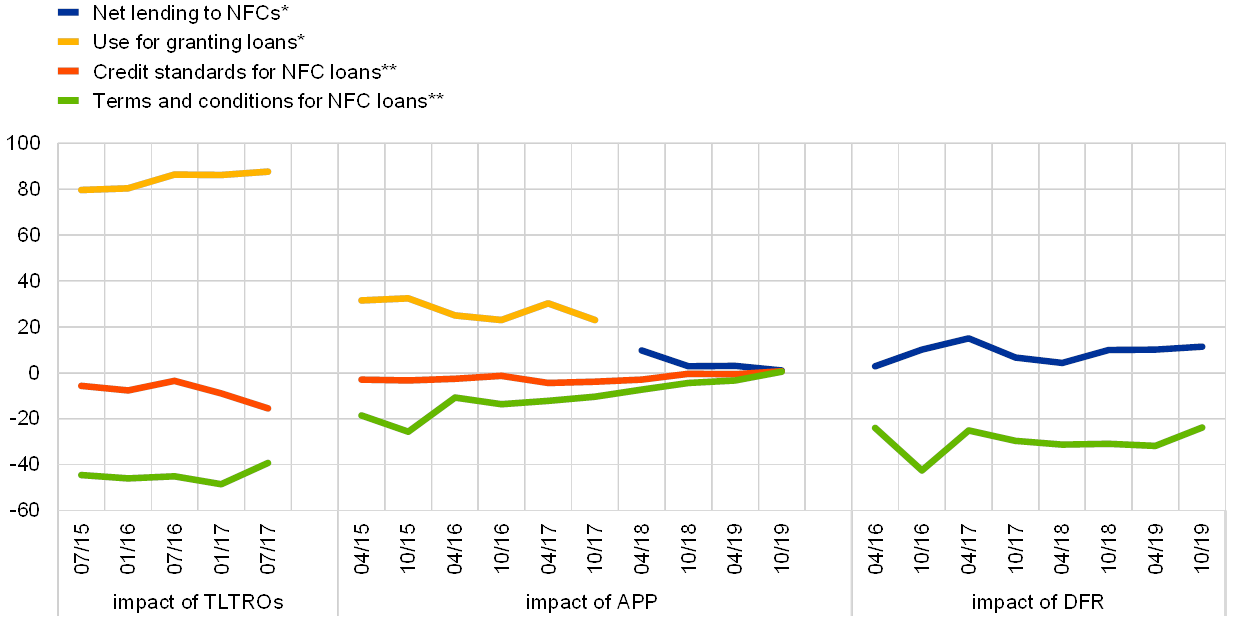
Hence, while euro area banks have eased their credit standards for NFC loans only moderately since 2014, they have eased their actual terms and conditions for new NFC loans of average riskiness substantially. Borrowers who have met the bank’s loan approval criteria have benefited from considerably more favourable actual lending conditions for average NFC loans. The evidence is in line with banks’ responses that the ECB’s monetary policy measures have had a substantial net easing impact on banks’ actual terms and conditions, while such measures had a more limited impact on their credit standards (see Chart 8).[13]
Chart 8
Impact of the ECB’s non-standard measures on bank lending conditions
(net percentages and percentages of banks; impact over the previous six months)
Source: ECB (BLS).
Notes: The horizontal axis refers to the BLS rounds in which the respective questions were included. The ad hoc question on the TLTRO-II was included until July 2017.
*Use of TLTRO liquidity for granting loans. Use of increased liquidity arising from the ECB’s asset purchase programme (APP) for granting loans out of sales of marketable assets and increased customer deposits until October 2017. Net impact of APP on lending volumes from April 2018. Net impact of the ECB’s negative deposit facility rate (DFR) on lending volumes.
**The TLTRO question asks for the easing impact only. Net easing impact for APP and DFR. Net easing is defined as easing minus tightening impact. Loan margins instead of overall terms and conditions for DFR.
In contrast to margins on average NFC loans, margins on riskier loans have narrowed only a little in net terms since 2014 (see Chart 7). The more cautious attitude towards riskier loans may indicate that banks have not been willing to take on major risks when lending to firms in order to boost returns in a low interest rate environment. This is also consistent with banks’ limited net easing of credit standards against a background of heightened regulatory requirements and, in some jurisdictions, still considerable levels of NPLs, as well as with the more modest risk tolerance of banks following the financial crisis.
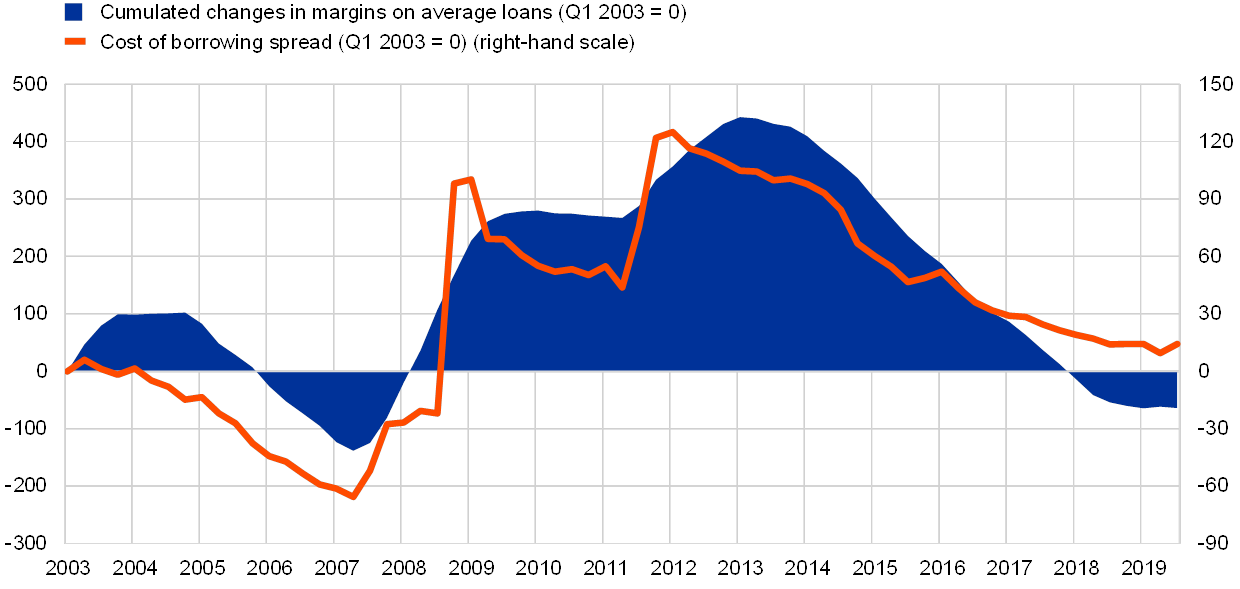
Taking a longer-term perspective, banks’ margins on new loans to firms with an average risk profile have returned to levels not far off those prevailing around the beginning of the financial crisis, whereas previously they were lower. The cumulation of the changes in loan margins (i.e. the spread of bank lending rates over a relevant market reference rate), as reported by BLS banks, can help when assessing the current state of bank lending conditions for firms. As shown in Chart 9, the widening of margins on average NFC loans during the financial and sovereign debt crises has been broadly offset by the narrowing of loan margins since the second quarter of 2013. When computed on the basis of actual lending rates for NFC loans and money market interest rates, loan margins did not return to the very low levels that prevailed before the onset of the financial crisis, which possibly represented an underpricing of borrowers’ credit risk at that time. Interestingly, cumulated changes in NFC loan margins have moved broadly in line with actual bank lending rate spreads, in keeping with the definition of loan margins (see Chart 9). This evidence suggests that banks’ margins on new loans have returned to levels around those seen at the beginning of the financial crisis, whereas previously they were lower.
Chart 9
Cumulated changes in margins on average NFC loans and cost of borrowing spread for NFC loans
(cumulated net percentages and spread in basis points)
Source: ECB.
Notes: Margins are defined as the spread of bank lending rates over a relevant market reference rate. Net percentages for the margins on average loans have been cumulated from the first quarter of 2003 onwards. The spread is calculated as the difference between the cost of borrowing indicator for NFC loans and the three-month overnight interest swap rate. It has been indexed at Q1 2003 = 0, corresponding to the cumulated change in the spread since Q1 2003. The cost of borrowing indicator for NFC loans is calculated by aggregating short- and long-term rates using a 24-month moving average of new business volumes.
3 Bank lending conditions across bank business models
A new dataset on bank business models makes it possible to detect differences in bank loan supply conditions across different types of bank business models for the BLS banks.[14] The analysis in this section is based on a confidential individual bank-level dataset covering 13 euro area countries. Individual bank data have been aggregated following the BLS methodology to report aggregate changes in bank lending conditions at the euro area level across bank business models.[15] Universal banks are the dominant business model in this dataset both in terms of number of banks and main assets. In addition, global systemically important banks (G-SIBs) are important in terms of their assets, while retail lenders play an important role in terms of their number, albeit less in terms of assets. By contrast, corporate wholesale banks and specialised lenders in particular play a limited role in this dataset.
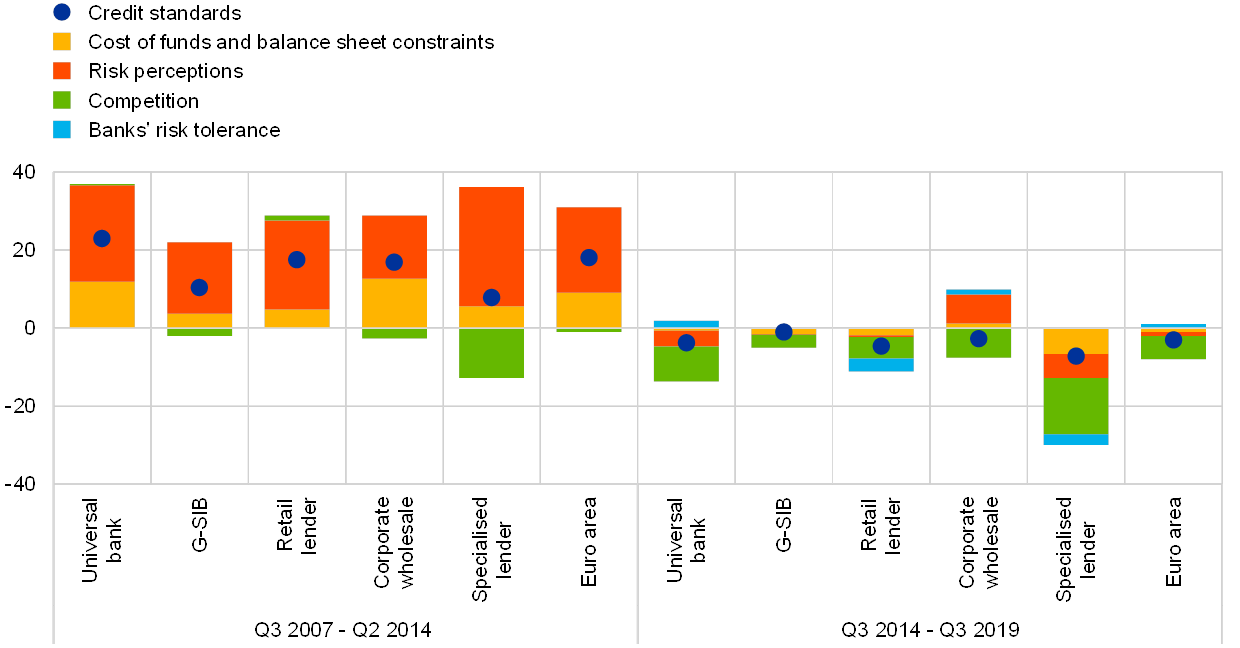
Overall, while the direction of the movements in credit standards over time has been consistent across bank business models, there have been notable variations (see Chart 10). Across all bank business models, a pronounced tightening of credit standards for NFC loans during the period from 2007 to 2014 preceded a more recent period of moderate easing, reflecting changes at the euro area level (see Section 2.1). Universal banks and retail lenders on average tightened their bank lending conditions by more than other lenders during the crisis period. Both business models also widened their margins for NFC loans (see Chart 11 below) considerably, reflecting the increased credit risk faced by borrowers during the crisis. By contrast, from 2007 to 2014, the net tightening of credit standards on average was contained for specialised lenders owing to intense competitive pressures.
Across all bank types, risk perceptions were the most important factor for changes in credit standards for NFC loans during the period from 2007 to 2014, reflecting borrowers’ heightened credit risk. While this factor has tended to contribute to an easing of credit standards since 2014 across most business models, it continued to contribute to a net tightening of credit standards for corporate wholesale lenders. This may be linked to the specific business model of this bank type specialised in financing large investment projects which tend to have a higher risk profile.
For some bank types, especially universal banks and corporate wholesale banks, funding costs and balance sheet constraints were an important factor for the tightening of their credit standards. The co-movement of this factor with risk perceptions signals the interlinking between borrowers’ heightened credit risk and banks’ balance sheet constraints, as weaker borrower quality translated into banks’ balance sheet fragility. While risk perceptions have played a leading role in the tightening of credit standards for loans to firms across bank business models, competition has been the biggest contributing factor over the net easing period since 2014. Finally, banks’ risk tolerance had a rather small impact on changes in credit standards across bank business models.
Chart 10
Credit standards on NFC loans across bank business models
(average net percentages of banks)
Source: ECB (BLS).
Notes: See Charts 1 and 2. The figures for the bank business models are based on a confidential dataset comprising data from 13 euro area countries. The euro area figures refer to all euro area countries.
Mimicking the net easing of bank lending conditions in the overall sample, margins on average loans have narrowed across all business models since 2014, along with a parallel decrease in bank funding costs, following the ECB’s credit easing package (see Chart 11). Following the widening of margins on NFC loans during the financial crisis, the largest net percentage of banks indicating a narrowing of their loan margins can be observed for universal banks and specialised lenders, passing on to their customers the significant decrease in their funding costs. Specialised lenders seem to have benefited particularly from squeezed bond yields, given their stronger dependence on funding through the issuance of debt securities. Importantly, ECB borrowing under attractive terms within the ECB’s TLTRO-II operations has additionally benefited all bank types. In the second and third quarters of 2019, G-SIBs tightened their credit standards on NFC loans and reported an increase in margins on average NFC loans, while developments were more mixed for other bank types.
Differences in business models’ reliance on specific customer and market segments can be linked to the heterogeneity in the developments of loan supply as well as in funding conditions and overall profitability. G-SIBs and retail lenders have shown the least variation in credit standards and average loan margins for NFC loans over time (measured based on the standard deviation, see Chart 11). This is most probably due to the fact that banks following the former business model are in general more diversified and less prone to cyclical variations of macroeconomic variables (also implied by their asset- and liability-structure), and to the fact that lenders belonging to the latter bank group tend to maintain relatively long-lasting relationships with their customers. Retail lenders have also experienced the least variation with respect to their funding costs, resulting from their larger dependence on retail funding and, therefore, their smaller exposure to prevailing market-based financing conditions. In line with this rather stable funding structure, retail lenders tightened their credit standards for loans to firms more moderately than more market-dependent bank types as an immediate reaction to the Lehman Brothers collapse in the third quarter of 2008. The considerable tightening of credit standards by retail lenders on average from 2007 to 2014, mentioned above, may instead be explained by a continuous, but limited tightening of credit standards during the crisis period. By contrast, corporate wholesale and specialised lenders have exhibited significant variability in terms of not only credit standards and average loan margins, but also funding costs across the timespan of the sample, owing to their considerable dependence on the issuance of debt securities and, as a result, on the movement of bond yields. The opposite is true when taking a closer look at the developments in return on equity, with the retail lenders’ business model recording the strongest decline and widest variability during the crisis, largely reflecting their lower diversification and related considerable dependence on net interest income.
Chart 11
NFC loan supply, bank funding cost and bank profitability across bank business models
(averages of net percentages of banks, percentages and percentages p.a.)
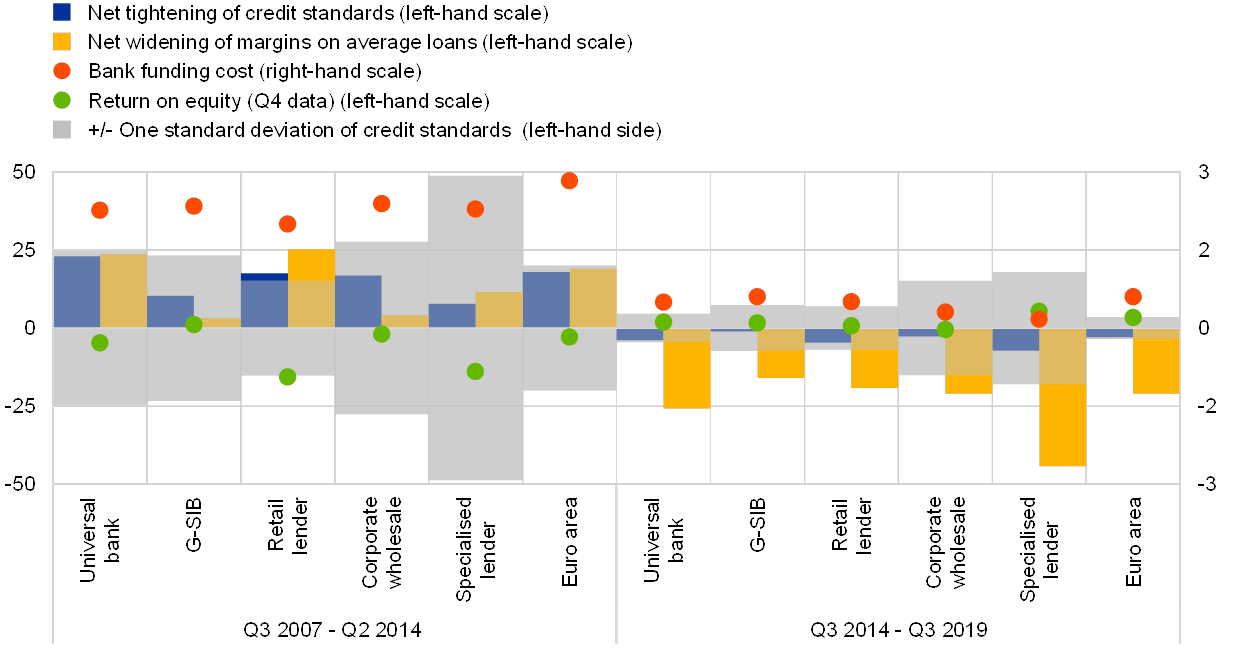
Sources: ECB, Markit iBoxx, S&P Market Intelligence (SNL Financial) and ECB calculations.
Notes: See Charts 1 and 7. Return on equity refers to figures in the fourth quarter of the respective year and has been aggregated based on individual bank data, weighted by banks’ total assets. Bank funding cost is a weighted average of banks’ cost of deposits and bank bond yields. It has been aggregated based on individual bank data, weighted by banks’ total assets. The figures for the bank business models are based on a confidential dataset including 13 euro area countries. The euro area figures refer to all euro area countries. The standard deviation refers to the standard deviation of the net percentages indicator of credit standards for each category.
4 Conclusions
This article assesses bank loan supply conditions for euro area firms based on BLS indicators for credit standards and terms and conditions for new loans. While average margins for new loans to NFCs seem to have returned to conditions prevailing around the beginning of the financial crisis, banks’ loan approval criteria and margins on riskier loans have remained tighter overall, due to banks’ balance sheet cleaning, stricter regulatory and supervisory requirements and a cautious attitude towards risk. Since 2014, bank lending conditions for firms in the euro area have eased considerably, supported by favourable financing conditions to which the ECB’s non-standard monetary policy measures have contributed positively.
In addition, the BLS provides information about the driving factors of bank loan supply developments, which allows a deeper understanding of changes in bank lending conditions. The importance of these driving factors varies over time. While risk perceptions have played a dominant role, mainly during tightening periods, competitive pressures have been predominant during easing periods.
Finally, this article gives new insights into the changes in bank lending conditions and the contributing factors across bank business models. While the broad developments are in line with overall euro area developments across business models, the intensity of changes in credit standards and the relative importance of the driving factors vary across bank types. Interestingly, while the variation of bank lending conditions for NFC loans has been generally more moderate for retail lenders and G-SIBs, it has been more pronounced for other bank types which are more dependent on financial market funding and less diversified.
- Bettina Farkas provided data support.
- See the ECB’s website for the euro area bank lending survey. The quarterly BLS report focuses on aggregate developments in net terms. With respect to credit standards, the net percentage is the difference between the sum of the percentages of banks responding “tightened considerably” and “tightened somewhat” and the sum of the percentages of banks responding “eased somewhat” and “eased considerably”.
- See Köhler-Ulbrich, P., Hempell, H.S. and Scopel, S., “The euro area bank lending survey”, Occasional Paper Series, No 179, European Central Bank, 2016.
- See Altavilla, C., Darracq Paries, M., Nicoletti, G., “Loan supply, credit markets and the euro area financial crisis”, Journal of Banking and Finance, forthcoming.
- See De Bondt, G., Maddaloni, A., Peydro, J.-L. and Scopel, S., “The euro area bank lending survey matters: empirical evidence for credit and output growth”, Working Paper Series, No 1160, European Central Bank, 2010.
- See Hempell, H. S., Kok Sorensen, C., “The impact of supply constraints on bank lending in the euro area. Crisis induced crunching?”, Working Paper Series, No 1262, European Central Bank, 2010.
- With regard to the relationship of the BLS factors with other macroeconomic indicators, see the analysis in Chapter 3 of Köhler-Ulbrich, P., Hempell, H.S. and Scopel, S., “The euro area bank lending survey”, Occasional Paper Series, No 179, European Central Bank, 2016.
- The factor “banks’ risk tolerance” was introduced in the first quarter of 2015.
- See the ECB’s website on the euro area bank lending survey. At the same time, it should be acknowledged that an assessment of the current level of credit standards compared with the long-term range since 2003 may be difficult for the banks and therefore needs to be viewed with some caution.
- See also the July 2018 BLS report on the euro area bank lending survey website for the impact of NPLs on banks’ lending policy from 2014-17 and the July 2019 BLS report for more recent evidence.
- See Altavilla, C., Boucinha, M., Holton, S., Ongena, S., “Credit supply and demand in unconventional times”, Working Paper Series, No 2202, European Central Bank, 2018.
- Given that data on banks’ overall terms and conditions have only been available since the first quarter of 2015, the focus here is on banks’ loan margins, which are an important component of banks’ overall terms and conditions.
- For the impact of the ECB’s monetary policy measures, see, for example, Demiralp, S., Eisenschmidt, J., Vlassopoulos, T., “Negative interest rates, excess liquidity and retail deposits: banks’ reaction to unconventional monetary policy in the euro area”, Working Paper Series, No 2283, European Central Bank, 2019; Altavilla, C., Burlon, L., Giannetti, M., Holton, S., “Is there a zero lower bound? The effects of negative policy rates on banks and firms”, Working Paper Series, No 2289, European Central Bank, 2019.
- For a methodological explanation of the bank business model classification and an overview of asset- and liability- structures by business model, see Altavilla, C., Andreeva, D.C., Boucinha, M. and Holton, S., “Monetary policy, credit institutions and the bank lending channel in the euro area”, Occasional Paper Series, No. 222, European Central Bank, 2019.
- An explanation of the BLS aggregation methodology can be found in the BLS user guide on the euro area bank lending survey website. In addition, for some parts of the analysis, individual bank BLS data were merged with bank balance sheet and interest rate data.


