
Published as part of the ECB Economic Bulletin, Issue 4/2022.
1 Introduction
The debt financing structure of euro area firms has broadened since the introduction of the euro as the common currency. While bank loans still account for a major share of corporate debt, euro area firms have increasingly resorted to bond financing, especially following the global financial crisis (GFC) of 2008-09.[1] As a result, the outstanding volume of bonds relative to bank borrowing by euro area firms has risen to around 30%, up from roughly 15% in mid-2008.[2] Corporate bond markets have therefore emerged as an increasingly significant determinant of euro area credit conditions over the past decade and a half.
The rise in bond financing has continued during the coronavirus (COVID-19) pandemic, albeit reflecting different drivers than during the GFC and its aftermath. Amid acute vulnerabilities across the banking sector, loan supply contracted in the wake of the GFC (Section 2). This forced firms to turn to bond markets as a substitute source of credit, despite the higher relative cost at that time.[3] During the pandemic, firms instead benefited from more favourable loan supply conditions than during the GFC. This was because (1) banks entered the pandemic with significantly stronger balance sheets, in part owing to the regulatory overhaul of the preceding decade, and (2) bank intermediation capacity was underpinned by a swift and extensive fiscal, supervisory and monetary policy response.[4] As these factors supported large loan flows at favourable conditions throughout the pandemic, the concurrent expansion of bond finance has complemented, rather than replaced, bank lending. In this regard, bond finance has also benefited from both the monetary policy support directed at bond markets over recent years (Section 3) and the supply of credit from non-bank financial intermediaries (Boxes 1 and 2).
The evidence presented in this article indicates that firms’ debt financing structures also matter for the transmission of shocks to the economy. Patterns derived from an econometric model suggest that loans and bonds in the euro area both expand in response to an exogenous increase in business investment, which may materialise, for instance, if the recovery were to unexpectedly speed up (Section 4). On the other hand, when the euro area economy experiences adverse aggregate supply shocks, historical regularities indicate that corporate bond issuance tends to cushion the resulting credit contraction, in turn supporting economic resilience.
Moreover, the increased role of bond financing also shapes the transmission of monetary policy. The aforementioned econometric model suggests that bond finance in the euro area partly counteracts the bank lending channel while reinforcing other channels that operate via broader financial market conditions (Section 4). The transmission of monetary policy measures primarily affecting short-term interest rates is therefore stronger in euro area countries with a lower share of bond finance. By contrast, measures that chiefly affect long-term interest rates, and are thus concentrated in maturity segments that carry the bulk of corporate bond issuance, are subject to stronger transmission in countries with a higher share of bond finance. A given set of policy measures may therefore have diverse economic effects in different parts of the euro area.
In addition to the shift in aggregate debt structures, the changing composition of corporate bond markets may affect transmission and firms’ resilience to shocks. The increased dependence of euro area firms on bond markets has not been limited to the historically largest issuers; it has also been driven by firms that have recently entered the bond market for the first time. This has led to a shift in the composition of bond issuers towards smaller and riskier firms (Box 1). The resulting diversification away from a predominantly bank-based debt structure may strengthen firms’ resilience to crises that chiefly affect this part of the financial sector. Moreover, access to bond markets does not seem to systematically induce firms to increase their leverage (Box 2). This is reassuring in terms of firms’ financial resilience, as debt overhang problems in the corporate sector may depress investment, employment and GDP. At the same time, the increased presence of more vulnerable firms in bond markets may expose the corporate sector to broader financial market turmoil, thus posing potential challenges for monetary policy transmission.
2 A tale of two crises
Since the onset of the pandemic, corporate bond markets have acted as a major complement to bank-based borrowing by euro area firms. Corporate bond market conditions deteriorated sharply during the financial turmoil in late February and early March 2020, triggered by the rapid increase in COVID-19 cases in Europe. After the adoption of the ECB’s pandemic emergency purchase programme (PEPP) on 18 March 2020, euro area corporate bond prices and issuance recovered (see below). By the end of 2021 the outstanding amount of euro area corporate bonds stood more than €200 billion above its pre-pandemic level (Chart 1, panel a). This expansion has been broad-based across the larger euro area countries. While France, with its historically high share of bond finance, accounted for the bulk of the increased issuance, Spain, Germany and Italy also recorded strong positive flows. In the latter three countries, the proportion of bond finance in the additional debt taken up by firms during the pandemic actually exceeded by a considerable margin the amount needed to stabilise the bond share in the stock of debt at pre-crisis levels (Chart 1, panel b). As such, the secular rise in bond finance as a share of corporate debt has persisted during the pandemic crisis and added to its relevance for overall credit conditions in the euro area.[5]
The complementary role of market and bank-based debt during the pandemic stands in contrast to the patterns observed during the GFC, when bond finance acted as a substitute for bank loans. While both crises were followed by similar upward trends in bond financing volumes, the bank lending dynamics pointed in opposite directions. In contrast to their record expansion during the pandemic crisis, corporate loans overall contracted in the one-and-a-half years following the collapse of Lehman Brothers (Chart 1, panel a). This contrasting picture is consistent with the different loan supply conditions that prevailed in the respective crises. Amidst an urgent need for bank balance sheet repair and subsequent regulatory tightening, loan supply contracted sharply during the GFC (Chart 2).[6] This in turn forced firms with access to bond markets to resort to this alternative source of debt finance, notwithstanding its high relative cost at the time (Chart 3, panel a). Moreover, the reduction in loan supply led many of the entirely bank-dependent firms to be shut off from external financing, which reinforced the contractionary impact of the GFC on their business activity. However, during the pandemic crisis banks benefited from their previous efforts to repair their balance sheets, accompanied by a strengthening of the euro area regulatory and supervisory framework, and from the broad-based policy response to protect credit supply. This enabled them to deploy their lending capacity as a backstop to the corporate sector, resulting in much more benign loan supply conditions (Chart 3, panel b). Therefore, the expansion of corporate bond finance during the pandemic crisis has not resulted from necessity, but from firms choosing to capitalise on the favourable cost of corporate bond finance over that period (Chart 3, panel b).[7]
Chart 1
Euro area loans to non-financial corporations (NFCs) and corporate debt securities issuance during the GFC and the pandemic crisis
a) Euro area flows during the GFC (left panel) and pandemic crisis (right panel)
(cumulative monthly flows, EUR billions)
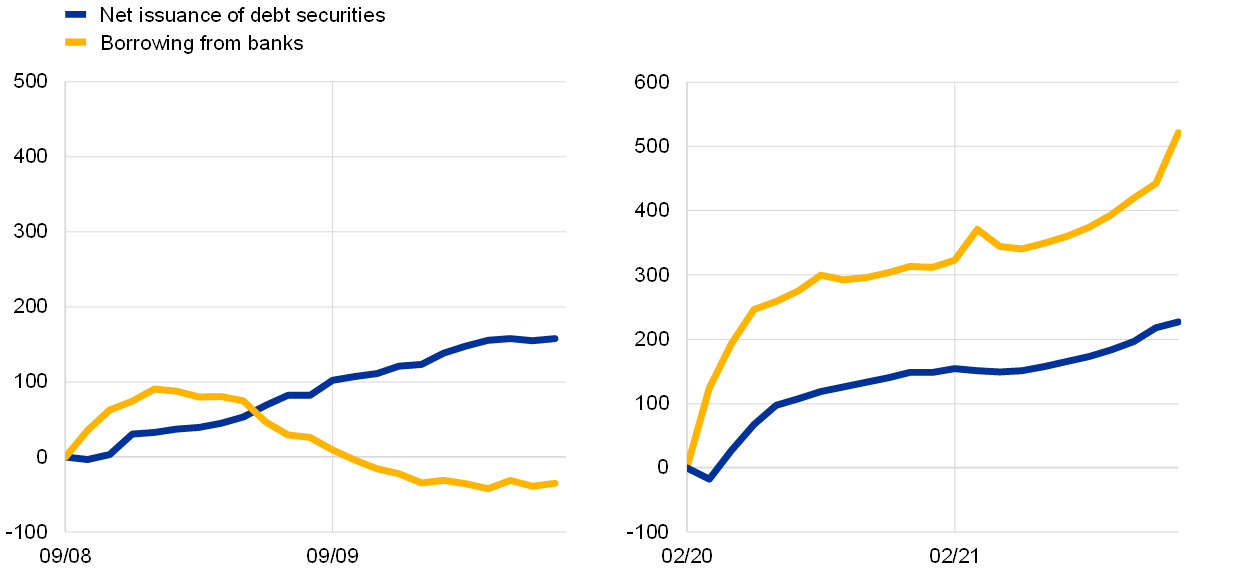
b) Share of corporate debt securities and loans across euro area countries during the pandemic crisis
(percentages)

Source: ECB (BSI, SEC).
Notes: Panel b: Bars report shares of NFC bank lending and NFC bond issuance of the sum of these two sources of external finance based on cumulated monthly flows from February 2020 to December 2021. Circles refer to shares of outstanding amounts in December 2019. The latest observations are for December 2021.
Chart 2
Loan supply and the relative role of market-based debt financing
(left-hand scale: bond share percentage changes, right-hand scale: lagged loan supply indicator changes; an increase in the loan supply indicator (LSI) represents a tightening of loan supply)
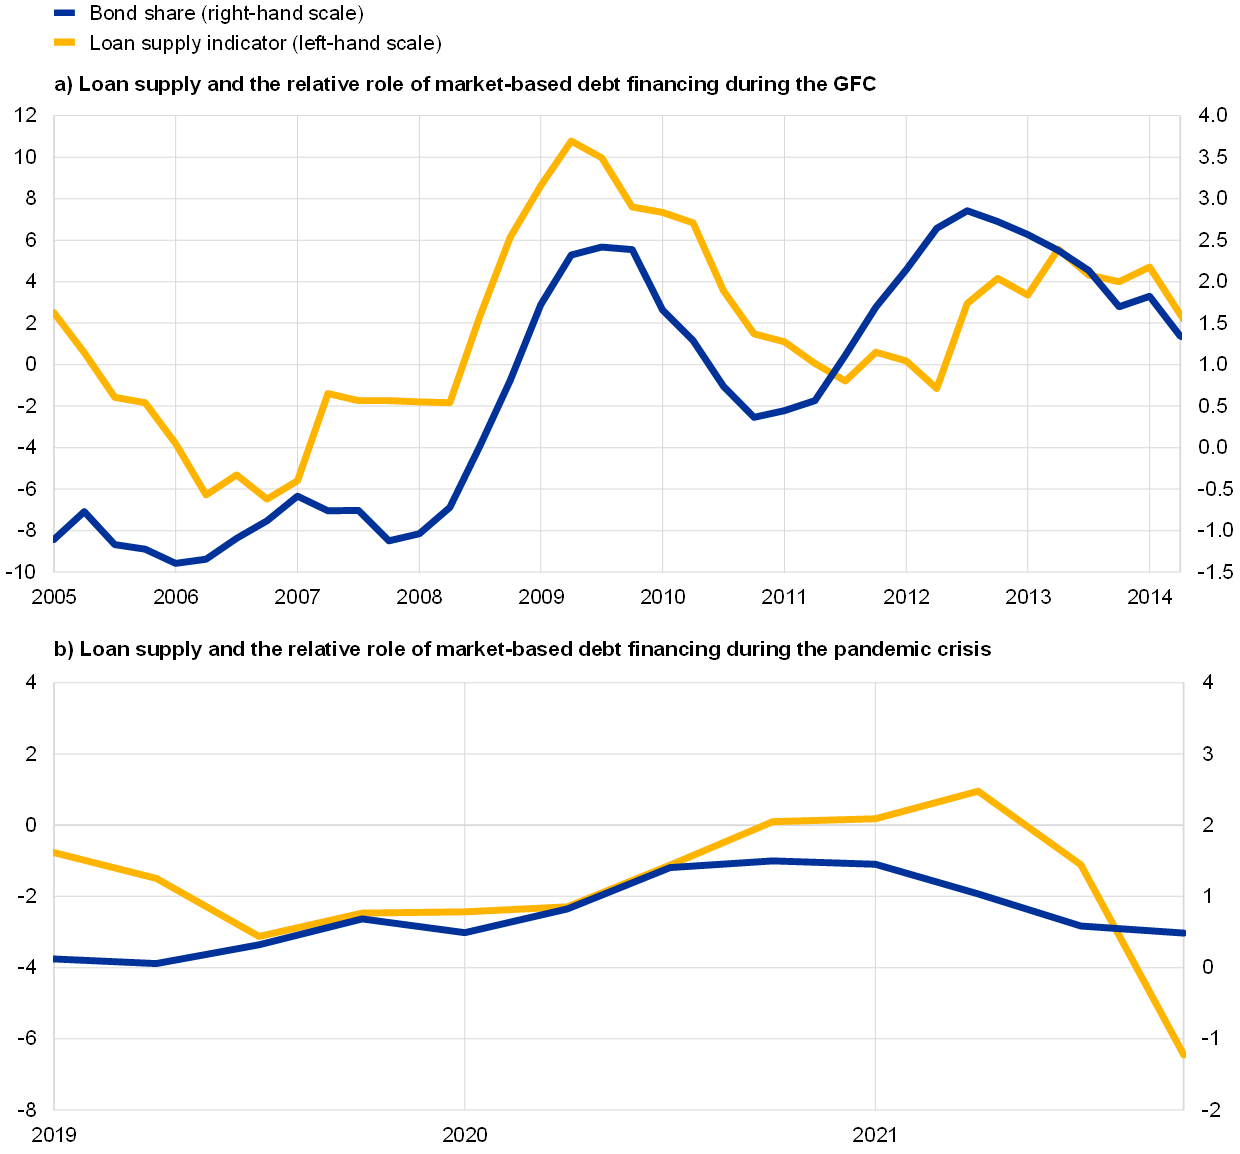
Sources: ECB (BSI, SEC), Bank Lending Survey (BLS) and ECB calculations.
Notes: Bond share is the yearly change in the ratio of bonds to loans. The LSI reflects changes in supply conditions from one quarter to the next. It is cumulated to levels and displayed as yearly changes. Its construction follows the methodology used in Altavilla, Darracq Pariès and Nicoletti (2019) to remove the effects of demand factors from BLS-based indicators on loan supply. The LSI is shifted backwards by six quarters since changes in loan supply are found to affect bond share dynamics with a six-quarter lag. The latest observations are for December 2021 for bond share and June 2020 for the LSI.
Chart 3
The ratio of debt securities to loans and the relative cost of market and bank-based debt
(left-hand scale: cumulative changes; right-hand scale: ratio based on notional stocks; percentage points)
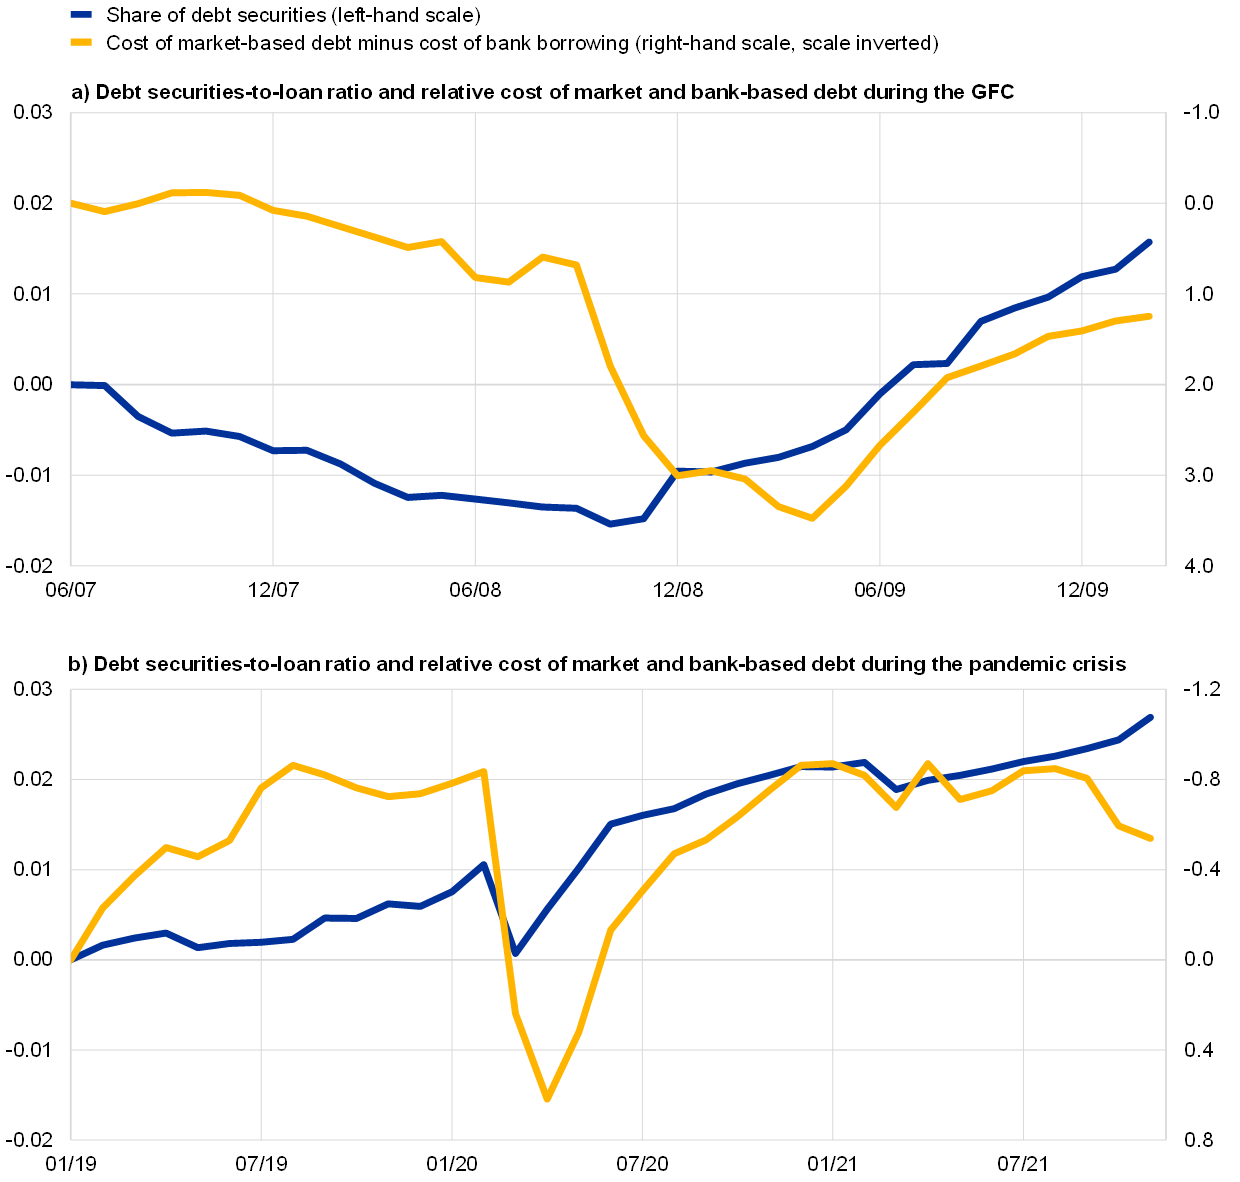
Sources: ECB (SEC, BSI, MIR), Merrill Lynch and ECB calculations.
Notes: Cumulative change in outstanding stock of debt securities as a share of debt (measured as the sum of debt securities and bank loans), based on notional stocks since June 2007 (panel a) and January 2019 (panel b); cumulative changes in the relative cost of market-based debt (cost of market-based debt minus cost of bank borrowing) in percentage points since June 2007 and January 2019. The latest observations are for February 2010 and December 2021.
The different motives driving the financing decisions of firms during the two crises are also reflected in firm-level data. Both crises exerted heterogeneous effects on the performance of individual firms, as measured, for instance, by sales growth (Chart 4). While the bulk of firms suffered a contraction, some weathered the crises better or even improved their performance.[8] As a result, a distinction can be made between hard-hit firms whose borrowing decisions were dictated by the need to satisfy emergency liquidity needs, and less-affected firms whose borrowing decisions remained predicated on the relative attractiveness of different debt instruments. This distinction subsequently manifested itself in opposing relationships between firm performance and debt financing structures during the two crises (Chart 4). During the GFC, even hard-hit firms increased their relative reliance on bond finance to sustain their emergency needs for credit against the backdrop of tight loan supply constraints (orange line in Chart 4). During the pandemic, however, hard-hit firms were able to rely on bank lending as a safety net, whereas less-affected firms could draw on bond finance to benefit from its favourable relative cost (blue line in Chart 4).
Chart 4
Firm performance and financing structure during the GFC and pandemic crises
(x-axis: sales growth, percentage points; y-axis: bond share yearly changes, percentage points)

Sources: S&P Capital IQ, Refinitiv and ECB calculations.
Notes: Binned scatter plot using a sample of roughly 2,000 firms; each point is the mid-point of a bin where each bin represents a percentile of the distribution. The blue line excludes the two points at the extreme percentiles where the bond share was not reactive to crises-related developments. The latest observations are for the second quarter of 2021.
Box 1
Examining the rise of bond financing in the euro area
This box examines the growth of bond financing in the euro area through the lens of a cross-section of corporate issuers. Over the past two decades several macroeconomic trends have driven the rise of bond financing in Europe. These include the fall in bank loan supply, the implementation of tighter regulation, accommodative monetary policy that compresses bond yields (including via the ECB’s corporate sector purchase programme), legislation supporting the issuance of corporate bonds by medium-sized firms in some euro area countries and bankruptcy reforms.[10] While the aggregate growth in bond financing is well known, the same cannot be said about its cross-sectional implications. In the past, the European bond market included only the largest firms. This box highlights new microdata that are used to examine the growth of the bond market over the past two decades and answers three questions. First, is the increase in bond financing concentrated in historical issuers or are new firms entering the market? Second, what types of issuer are driving the extensive growth margin? Third, which investors are supplying the additional credit provided via corporate bond markets?
The increase in firms’ dependence on the bond market is not restricted to the largest historical issuers; it is also driven by firms that have entered the bond market for the first time in the last 15 years. Their entry has led to a shift in the composition of bond issuers towards smaller and riskier firms. Trends in credit ratings show that the volume of BBB securities has been rising fast and has outgrown the rest of the investment grade category. However, looking solely at credit ratings underestimates the underlying shift in risk for two reasons. First, coverage by rating agencies in the euro area is low, with less than 15% of new bond issuers being assigned a rating. Second, new issuers with a rating are significantly larger and more profitable than new issuers without one. Thus, it is necessary to link bond issuance with firms’ characteristics to achieve a more comprehensive analysis of issuer risk in the euro area.
Compared with historical issuers that already had outstanding bonds in 2003, new issuers are significantly smaller, less profitable and have higher levels of leverage.[11] This is particularly pronounced for listed issuers, which have multiplied in recent years. Chart A compares the characteristics of new issuers with those of historical issuers and non-issuers over our sample period, including non-listed firms. Data on three characteristics – size, leverage and profitability – can be computed even for unrated firms. Panel a) illustrates how new issuers are noticeably smaller than historical issuers. The left-hand chart in panel b) highlights that new issuers had substantial amounts of debt throughout the sample period. According to the right-hand chart in panel b), new issuers are less profitable than historical issuers. These patterns are particularly striking for non-listed issuers, which tend to be much smaller, less profitable and have higher leverage than listed issuers.
Chart A
Size, leverage and profitability of different types of firm
a) Total assets

b) Leverage and EBITDA over assets

Sources: S&P Capital IQ, Compustat Global and Orbis.
Notes: The plot represents the median of (a) logarithm of lagged assets, (b) lagged percentage of debt over assets, and (c) lagged percentage of EBITDA over assets for listed historical, new and non-issuers from 2004 to 2018, as well as for non-listed issuers and non-issuers from 2011 to 2018. Lagged assets are used as an indicator of the size of a firm, while the ratio of debt to assets is used as a measure of leverage and EBITDA over assets measures profitability. Listed historical issuers consist of firms with positive outstanding bonds either in 2002 or 2003. Listed new issuers are listed firms that issued bonds for the first time between 2004 and 2018. The group of listed non-issuers is made up of listed firms that never issued bonds between 2002 and 2018, as well as of listed new issuers before their first issuance. Non-listed issuers are firms with positive outstanding bonds between 2010 and 2018.
In order to determine the economic implications for bond market growth, it is necessary to ask how investor composition varies across different types of issuer. The risk of a sudden deterioration in lenders’ supply of funds in times of financial hardship is of significant concern to credit markets. While traditional “buy-and-hold” bond investors (such as pension funds and insurance corporations) look to the long term, bond funds have been growing extensively in recent decades. In times of hardship, the latter can become a source of fire sales and price dislocations.[12]
Chart B
Investor composition – non-financial issuers in 2019
(percentages)
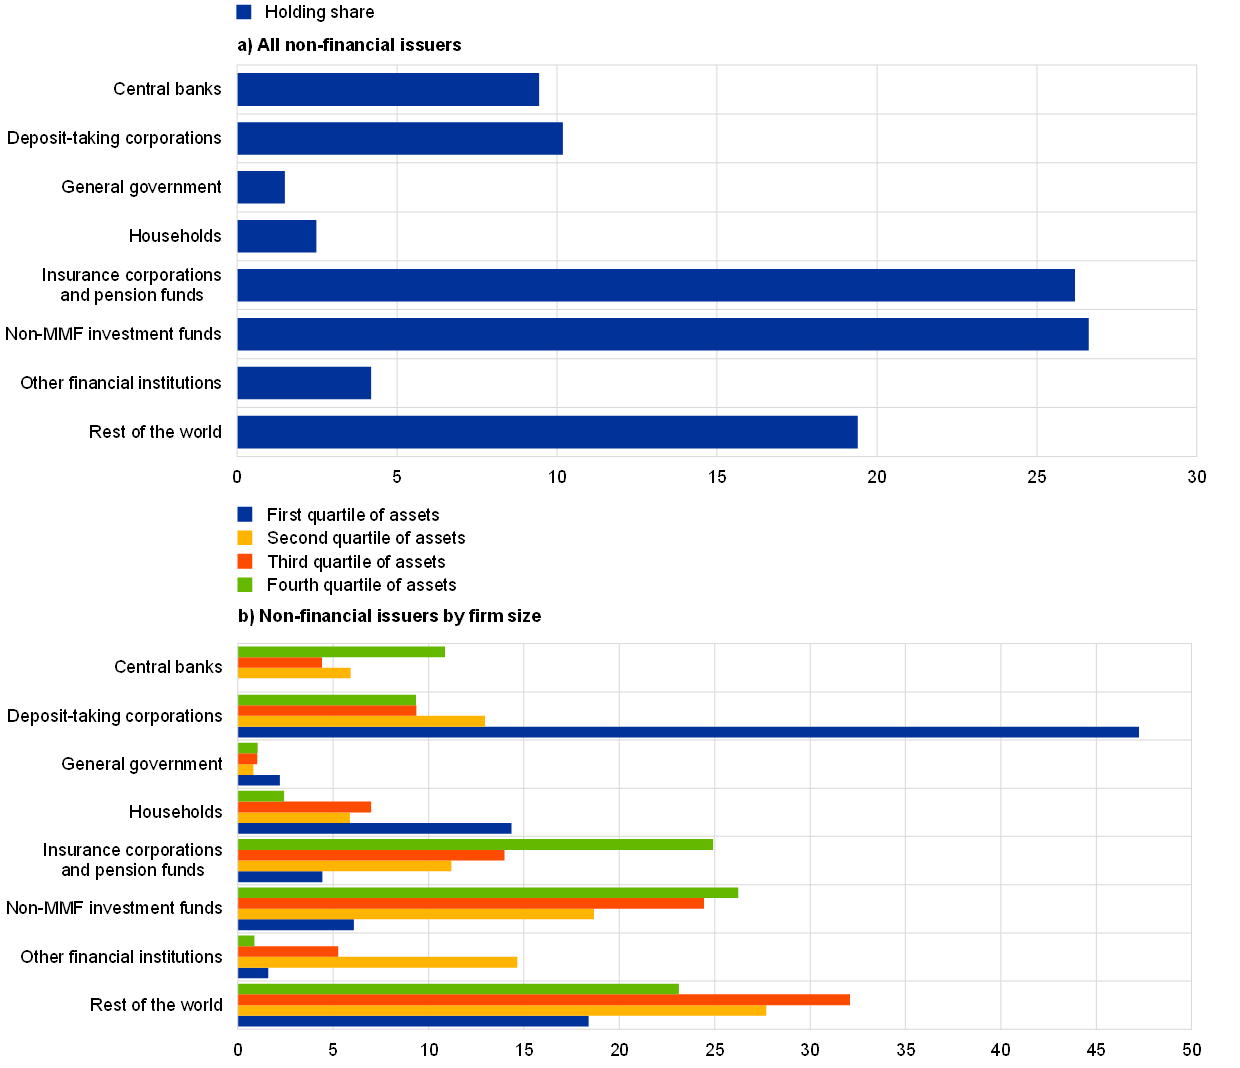
Sources: SDW macroeconomic and sectoral statistics, CSDB, SHS-S, Compustat Global and Orbis.
Notes: Chart B presents the investor composition of the debt securities issued by euro area non-financial corporations at the end of 2019. The rest of the world is estimated as the difference between the total outstanding amount of debt securities and the amounts held by selected investors in the euro area. Holdings by non-financial corporations are not included. Panel a) presents the investor composition for all non-financial issuers, and in panel b) the sample is divided using the firm’s assets as an approximation for its size. In panel b) the firms’ assets grow with each quartile (i.e. the first quartile includes firms with the lowest level of total assets in the sample, while the firms in the fourth quartile have the highest level of total assets). MMF refers to money market funds.
Holdings of stable “buy-and-hold” bond investors are large in aggregate but small for weaker issuers. Chart B presents the investor composition at the end of 2019 for all corporate bonds issued by all non-financial euro area issuers in panel a) and by non-financial euro area issuers of different size in panel b). Comparing the two reveals the following. First, the investor composition of the largest issuers is similar to the aggregate. However, the investor composition of smaller private issuers is noticeably different. The share of “buy-and-hold” investors (for example, the Eurosystem, insurance corporations and pension funds) is only 5%, or roughly 20 percentage points lower than in aggregate. Long-term investors’ mandates limit their exposure to risk and can systematically exclude new issuers because of their bond size or rating status. Second, we see higher shares of holdings by households (14% compared with 3%) and by banks (over 40% compared with 9%). For small issuers, bond holdings are highly concentrated in the banking sector, implying a high degree of exposure to banking shocks. These facts suggest that firm-investor matching occurs.
Overall, the landscape of corporate debt financing has changed significantly over the past 15 years, with many more firms exposed to market fluctuations. Firms’ increased access to credit and their reduced reliance on the banking sector is well documented. However, the impacts of this shift on financial stability and potential interactions with regulation are yet to be fully understood. The evidence of heterogenous bond investor composition across different types of issuer is a first step towards building a more comprehensive framework around bond credit supply and its macroeconomic implications. Further analysis is needed to better understand the welfare and policy implications of this shift in corporate debt financing.
3 Monetary policy and firm financing flows
Empirical evidence suggests that monetary policy was a key driver behind the differences in firm financing flows between the two crises. In addition to the differing nature of the two crises, the monetary policy response differed in terms of speed and strength during the GFC compared with during the pandemic. The following analysis seeks to assess whether these differences in monetary policy have also contributed to the differential patterns in bond financing flows. The analysis is based on a medium-scale BVAR with sign restrictions to identify multiple financial, real and monetary policy shocks.[13] Based on a historical decomposition, this model is used to quantify the contribution of each identified shock to real NFC loan and bond growth (Chart 5). The analysis indicates that monetary policy was a key factor distinguishing the two crises. While monetary policy also supported bond financing flows during the GFC, its positive contribution was almost twice as high and markedly more persistent during the pandemic. These results are also consistent with the specific design of the policy response, which during the pandemic – unlike during the GFC – also comprised central bank asset purchases that provided more direct support to corporate bond markets than standard policy rate cuts would have done.[14]
Chart 5
Monetary policy’s contribution to growth in NFC debt instruments during the two crises
(percentage points)

Sources: ECB and ECB calculations.
Notes: Monetary policy’s contribution to real NFC loan growth (panel a) and real NFC bond growth (panel b) based on a medium scale BVAR model that identifies multiple financial and real shocks with sign restrictions (see Adalid, Korobilis and Musso, 2021). The contributions were recorded from four quarters before to eight quarters after the crises, the latter reflecting the start of the respective recessions (denoted by “T”, i.e. one quarter after the peak as established by the CEPR Euro Area Business Cycle Dating Committee). The latest observation is for Q2 2021.
Besides injecting additional accommodation, monetary policy also supported corporate bond markets by preventing a prolonged period of financial market turmoil. As the pandemic reached Europe in late February 2020, the risk-off mode in financial markets triggered a sharp sell-off in the euro area corporate bond market, with spreads nearly doubling in around two weeks. With the announcement of the PEPP on 18 March 2020, the rising pressure on corporate bonds subsided quickly, while equity prices also recovered (Chart 6). The PEPP’s role in safeguarding transmission was therefore instrumental in enabling corporate bond markets to complement the backstop provided by bank lending to firms.[15] Moreover, this stabilising effect on the market was later reinforced by further changes to monetary policy, such as the expansion of the PEPP in June 2020.[16]
Chart 6
Corporate bond spread and stock market reactions around PEPP announcements
(x-axis: changes in investment-grade bond spreads relative to the overnight index swap (OIS) rate in basis points; y-axis: percentage changes in stock prices)

Sources: IHS Markit iBoxx, Refinitiv and ECB calculations.
Notes: The charts show scatter plots of daily changes in investment grade bond spreads and daily stock market returns of corresponding companies at the time of policy announcements. Only those bonds eligible for corporate sector purchase programme purchases are considered.
4 Implications for the transmission of shocks
The continued shift towards market-based finance may alter the transmission of key macroeconomic forces. Bank loans are typically easier to adjust in response to unexpected changes in the economic landscape, whereas corporate bonds benefit from a more diversified creditor base and a longer maturity than bank lending to firms.[17] These differences may impinge on the direction, strength and speed with which the debt instruments respond to economic shocks. But empirical evidence testing this hypothesis is scarce, and it therefore warrants further analysis. Among the many shocks that may hit the euro area economy at any given point in time, two appear particularly relevant in the current circumstances. The first is a positive demand shock originating in firms’ increased business investment activity in response to an accelerating recovery from the pandemic. The second is an adverse aggregate supply shock, which could stem, for instance, from further intensification of global supply and transport bottlenecks, as well as from commodity market fluctuations similar to those observed since the onset of the war in Ukraine.
Corporate bond financing complements bank lending when it comes to responding to positive business investment shocks, whereas it temporarily dampens credit contraction after adverse aggregate supply shocks. This analysis is again centred on the empirical framework underlying Chart 5 and uses sign restrictions to distinguish between different types of shocks. It focuses on a positive demand shock arising from a pick-up in business investment and on an adverse aggregate supply shock.[18] The estimates show that bank lending and bond issuance both expand after positive business investment shocks, and the timing and size of the effects on both are very similar (Chart 7, panel a). By contrast, negative aggregate supply shocks initially trigger offsetting adjustments in loan and bond finance: loans immediately enter on a contractionary path, whereas bond issuance expands in the first two quarters after the shock (Chart 7, panel b).[19] This dampening effect of bond finance becomes insignificant after that horizon, but its subsequent downward adjustment is also moderate and statistically indistinguishable from zero. As a result, the overall contraction in credit is less pronounced in the presence of bond markets as an alternative source of finance than if firms were only able to draw on bank loans to finance their debts.[20] A possible interpretation of these findings is that, in response to an accelerating recovery driven by expanding business investment, firms prefer to diversify their sources of financing for new investment projects, thus resorting to both bank borrowing and bond issuance. By contrast, after an adverse supply shock, banks swiftly restrict their sources of new lending given the worsened economic outlook, forcing firms to mainly tap into broader capital markets to access external financing.[21]
Chart 7
Responses of NFC loan and bond financing flows to macroeconomic shocks
(x-axis: quarters; y-axis: percentage median and 68th confidence sets)
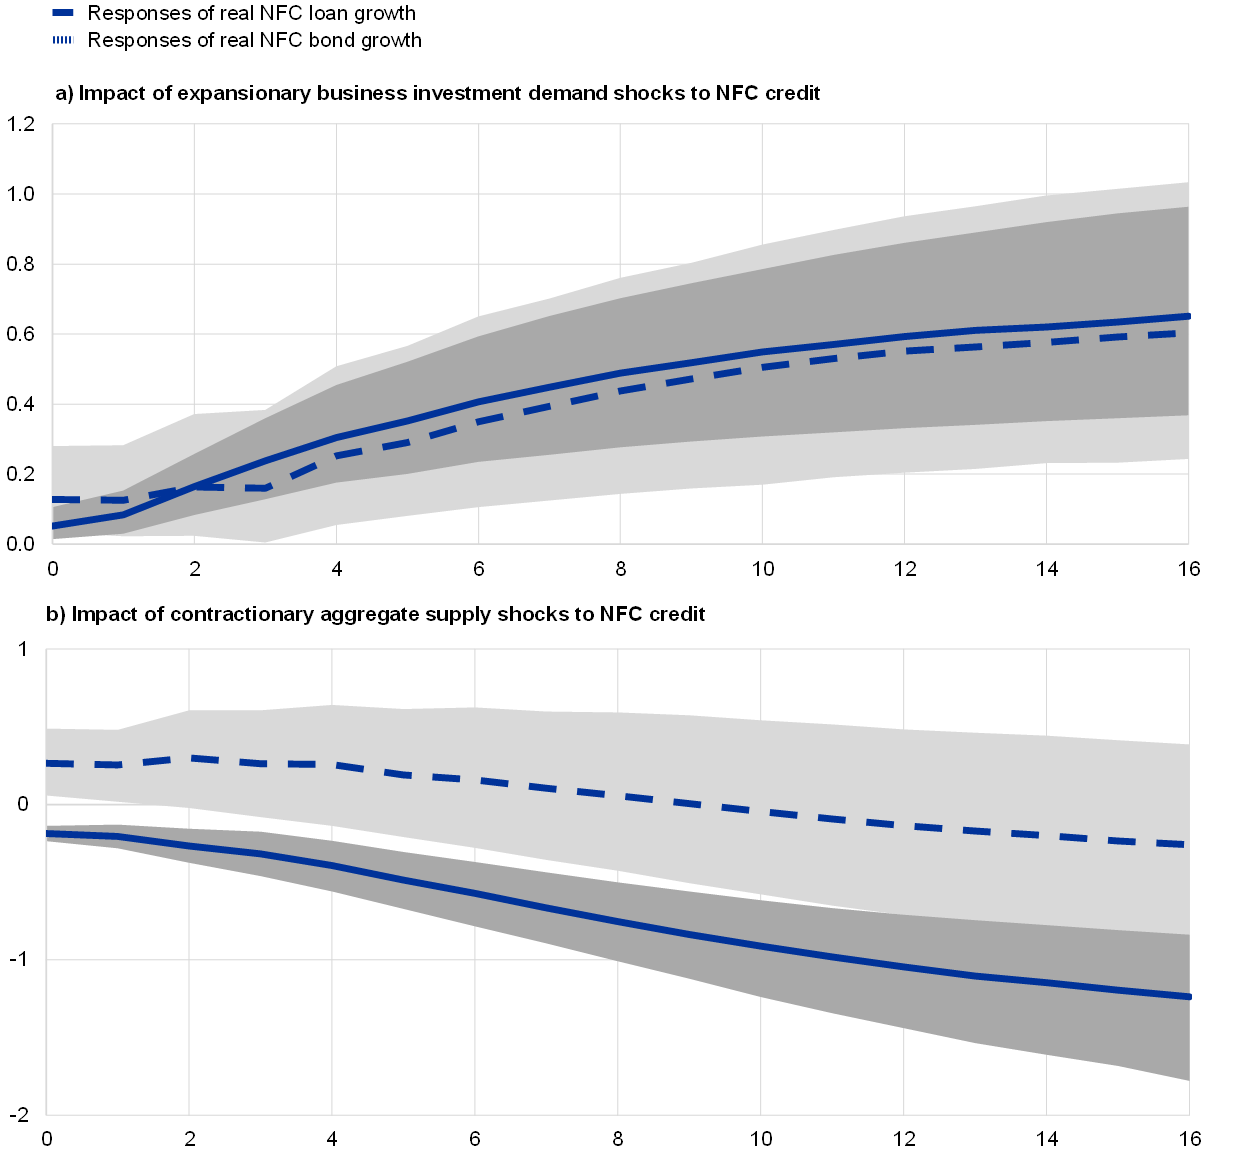
Sources: ECB and ECB calculations.
Notes: This chart shows the impulse response functions (IRFs) of real NFC loan growth (median: full line; 68th confidence band: dark grey area) and to real NFC bond growth (median: dashed line; 68th confidence band: light grey area) to an expansionary business investment demand shock (panel a) and a contractionary aggregate supply shock (panel b), based on a medium-scale BVAR model identifying multiple financial and real shocks with sign restrictions (see Adalid, Korobilis and Musso, 2021). Confidence sets are delimited by the 16th and 84th posterior percentiles, as is typical in Bayesian VAR analysis.
Lastly, debt financing structures also alter the relative strength of different monetary policy transmission channels. As corporate bond markets offer an alternative source of debt finance, they may counteract policy-induced shifts in loan supply arising from the bank lending channel of transmission. However, bond finance may be more responsive to other transmission channels, for instance owing to the impact of monetary policy on the medium to longer-term segments of the yield curve, where the bulk of corporate bond issuance takes place. Local projections based on a panel of euro area countries confirm this hypothesis.[22] In countries with a high bond financing share, the corporate sector responds to a standard monetary policy shock by further tilting its debt structure towards bonds, the supply of which (and hence the costs) are less responsive to the shock than those of loans. In countries with an average or lower share of bond finance, this substitution does not take place, so they also exhibit stronger transmission of short-rate shocks to the real economy (Chart 8). The pattern is reversed for policy-induced increases in long-term rates, which are followed by a stronger relative contraction in bond finance, eventually translating into a stronger impact on GDP.[23]
A given set of policies may therefore exert diverse economic effects on different parts of the euro area. While specific monetary policy measures tend to intervene on different yield curve segments simultaneously, the impact of policy-rate changes (asset purchases) tends to concentrate in the front end (back end) of the yield curve. Hence, policy rate changes (asset purchases) are likely to exert stronger financial and real effects in euro area countries with a low (high) share of bond finance.
Chart 8
Response of GDP to long-rate and short-rate monetary policy tightening shocks
(percentages)
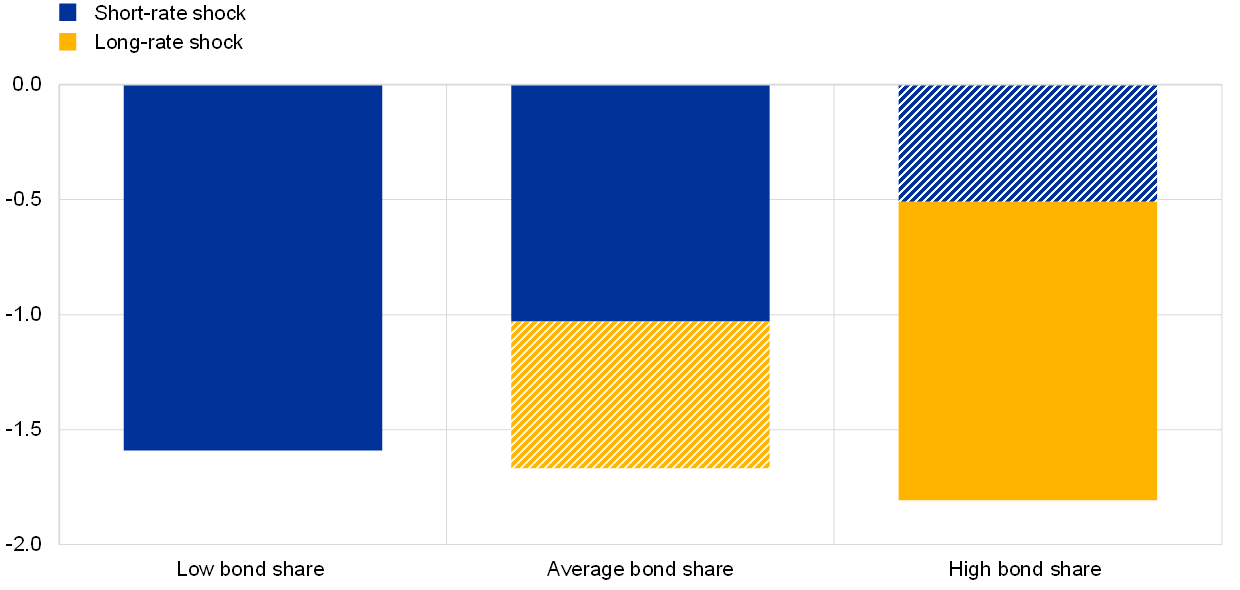
Sources: ECB and ECB calculations.
Notes: This chart shows the peak effects of monetary policy tightening shocks, identified via high frequency variation in interest rates, in a panel local projections model using monthly data from euro area countries. Impacts are calibrated to a 25 basis point increase in rates. Short-rate (long-rate) shocks refer to surprises in the one-month OIS rate (five-year Bund yield). Economic activity is measured as 100 times log (GDP). Low (high) bond share refers to lower (upper) quintile of the cross-country bond share distribution and average refers to the median. The respective bond shares are 9.3% (29.0) for the lower (upper) quintile and 20.3 for the median. The striped bars denote estimates for which precision falls below conventional significance levels.
Box 2
Market-based finance for corporations – the demand for and supply of credit
The rise in euro area corporate bond issuance documented in Section 1 has been driven by both demand and supply factors. On the one hand, the demand for market-based credit from firms was stimulated by the reduced cost of market-based debt relative to loan rates, the ECB’s asset purchases and corporate sector purchase programme, as well as the need to diversify funding sources following the global financial crisis (GFC).[24] On the other hand, the growth of non-banks, which hold over 50% of outstanding euro area corporate bonds, increased the supply of credit from the market, further incentivising firms to issue bonds. At the same time, stricter regulation of banks dampened the bank lending supply, especially to riskier firms.[25]
As loans and bonds are not perfect substitutes, firms’ incentives to use bond financing vary with their balance sheet characteristics, the structure of capital markets and the cost of alternative funding sources.[26] Empirical evidence based on a sample of large euro area non-financial corporations (NFCs) between 2014 and 2019 shows that NFCs issuing bonds are on average larger, more leveraged and have a lending relationship with a larger number of banks (Chart A). Also, firms are more likely to tap into the market if they have issued bonds in the past, if the average guarantee provided by the underwriters at issuance is larger and if the supply of credit from connected banks is lower. Moreover, bond issuance is more likely if the firm-specific cost of loans relative to bond financing rises.
Chart A
Differences between NFCs issuing bonds and NFCs financed only by banks
(left-hand scale: Q4 2014 – Q3 2019, log of total assets; right-hand scale: percentages)

Sources: Large Exposure dataset, IMIR, Dealogic, Orbis and authors’ calculations.
Notes: The chart shows the differences in size, loan rates, coupon rates, the number of connected banks and leverage between (comparable) firms which issue bonds and firms which do not. Size refers to the log of total assets. The loan rate is the average bank-level rate for loans with a given maturity and amount. For issuer firms, the coupon rate is the annualised coupon rate, while for non-issuers it is the average coupon rate of firms domiciled in the same country and with the same rating. Leverage is the ratio of firm debt to equity, divided by 100.
A comparison of firms with a similar probability of issuing bonds using propensity score matching suggests that credit cost is not the only driver of bond issuance.[27] Greater market supply – as measured by the average share of issuance guaranteed by underwriters – stimulates issuance, especially by firms with a low probability of issuing bonds ex ante. By contrast, when bank lending is constrained, firms with a high probability of issuing bonds tend to replace bank credit with market-based finance. And, when bank lending increases, they resort to both sources of financing.
The growing supply of credit from the market, in particular from non-banks, has positive effects on economic growth, as it facilitates the efficient allocation of capital and provides firms with an alternative credit source to finance new investments.[28] It may, however, also introduce new sources of volatility to the economic cycle and contribute to increasing corporate leverage, thus exacerbating the vulnerabilities of highly indebted firms. While banking regulation seeks to limit excessive credit supply, credit from non-banks lacks this sort of shock absorption mechanism. For this reason, it is important to assess whether bond issuance adds to bank credit in a way that increases firms’ leverage, or whether it is instead a substitute for bank loans.
For the sample of euro area firms that issued bonds between the first quarter of 2014 and the third quarter of 2019, empirical evidence suggests that bond issuance has replaced bank financing. Estimating the joint effect of bond issuance on firms’ size, leverage and financing structure allows the complementary or substitutive relationship between the two funding sources to be tested. If firms collectively experience an increase in size and leverage and a reduction in loan financing over total debt after issuing bonds, then this has increased their balance-sheets, thus complementing bank loans. By contrast, if firms’ size and leverage do not change, and the financing structure shifts towards bond financing, then the latter has replaced bank lending. The regression results in Table A show that bond issuance has not altered firms’ size and leverage but has replaced bank financing.[29] The shift towards market-based finance is, however, not homogeneous across countries and firms of different sizes. This may influence the transmission of monetary policy when it comes to the cost and volumes of financing, which has financial stability implications related to market fragmentation in credit provision.
Table A
Estimated impact of new credit on firms’ assets, leverage and financing structure
(Q4 2014 – Q3 2019, coefficient estimates)

Sources: Large Exposure dataset, IMIR, Dealogic, Orbis and authors’ calculations.
Notes: The table includes the estimated coefficient obtained via a dynamic panel with Arellano and Bond estimator where the change in total assets, leverage and financing structure over two subsequent quarters are regressed on the change in bonds and loans. ∆TA, ∆Lev and ∆Financing Structure indicate the changes in the logarithm of firms’ total assets, leverage (measured as debt over total assets) and financing structure (measured as share of bank loans to total debt) respectively, after issuing bonds. The set of control variables includes firms’ size in t-1, change in equity, change in cash holdings, firms’ profitability in t-1 measured as EBITDA, and country*time fixed effects.
5 Conclusion
This article has reviewed the evolution of firm financing structures in the euro area and the implications for macroeconomic shock transmission. The share of bonds in euro area corporate debt has risen, in particular since the GFC, and this trend has persisted through the ongoing pandemic crisis. However, the motives for firms to access bond markets have differed across these crises. During the GFC, firms accessed bond markets as a substitute for falling loan supply. However, during the pandemic crisis, they did so as a result of the favourable relative cost of bond financing, amid a supportive monetary policy environment, which also comprised measures directly targeted at fostering credit supply from corporate bond markets. As such, monetary policy effects have materialised alongside certain longer-term structural drivers of the increased reliance by firms on bond markets. These drivers include, for example, the growing footprint of non-bank financial intermediaries, which supply the bulk of credit in this market.[30] Moreover, drivers include the strengthened prudential landscape in which banks operate, which has an influence on loan market conditions.[31]
The rise of bond finance has significant consequences for the transmission of shocks to the euro area economy. Based on an empirical analysis of aggregate data, this article has highlighted the varying responses of different debt financing instruments to specific macroeconomic shocks: while accelerating business investment demand triggers qualitatively similar adjustments in bond and loan volumes, bond issuance mildly cushions the credit contraction after adverse supply shocks. Moreover, a higher share of bond financing strengthens the transmission of monetary policy measures that primarily operate via longer-term yields, whereas short-term rate changes tend to exert stronger real effects in economies that are more dependent on loans.
There is substantial scope for further analysis of the mechanisms underlying these stylised macroeconomic facts. The literature on firm financing structures and shock transmission is still nascent, in particular for the euro area. Complementary analysis drawing on firm-level data and linking the supply and demand sides of corporate bond and loan markets appears to be a particularly promising avenue to gather additional insight into the matters addressed in this article.
The change in firm financing structures may also have broader implications for the strength and resilience of the euro area corporate sector. As this sector has partly diversified away from bank loans, it may become more resilient to crises concentrated in the banking sector. In addition to this benefit at the aggregate level, the incidence of such crises also becomes less heterogeneous as more small and medium-sized firms move away from being solely reliant on bank loans and are instead gaining access to bond markets as a cushion. However, this beneficial diversification effect may be counteracted by other risks and sources of volatility across the economic cycle. Most notably, it is primarily non-bank financial intermediaries that provide credit to firms via bond markets. Structural vulnerabilities and shocks that impair their ability to provide credit can negatively affect NFC funding costs. Also, as some of the non-bank intermediary sectors are subject to less stringent regulatory and prudential frameworks, these may face weaker constraints on engaging in excessive risk-taking behaviour. In addition to the resulting risks to financial resilience and capital misallocation, more leveraged firms have increasingly started to access euro area bond markets over recent decades. Against this backdrop, there is a case for enhancing the regulatory framework for non-banks – including from a macroprudential perspective – to support financial stability and the smooth transmission of monetary policy.
Throughout this article, we refer to corporate bond finance as also including shorter-term debt securities, such as commercial paper. In the euro area, the outstanding amounts of short-term debt securities reached around €120 billion at the end of 2021, corresponding to roughly 7% of the overall outstanding amount of corporate debt securities.
See, for example, Cappiello, L., Holm-Hadulla, F., Maddaloni, A., Mayordomo, S., Unger, R. et al., “Non-bank financial intermediation in the euro area: implications for monetary policy transmission and key vulnerabilities”, Occasional Paper Series, No 270, ECB, Frankfurt am Main, December 2021. The relative role of bond financing has also risen in other major economies over this period. In the United States, for instance, the outstanding volume of bonds relative to bank borrowing by firms has increased to around 65%, from roughly 50% in mid-2008.
See De Fiore, F. and Uhlig, H., “Corporate debt structure and the financial crisis”, Journal of Money, Credit and Banking, Vol. 47, No 8, pp. 1571-1598.
The ECB’s targeted longer-term refinancing operations are a prominent constituent of the monetary policy measures supporting bank-based transmission. See, for example, Barbiero, F., Boucinha, M. and Burlon, L., “TLTRO III and bank lending conditions”, Economic Bulletin, Issue 6, ECB, 2021. Further support for bank-based transmission came from the ECB’s pandemic emergency purchase programme, which counteracted the fragmentation pressures that emerged in the early phases of the crisis. See, for example, Lane, P., “The market stabilisation role of the pandemic emergency purchase programme”, The ECB Blog, 22 June 2020.
Outstanding euro area corporate bond issuance and bank-based borrowing amounted to €1,662 billion and €4,995 billion respectively at end-2021.
The loan supply indicator is based on Altavilla, C., Darracq Pariès, M. and Nicoletti, G., “Loan supply, credit markets and the euro area financial crisis”, Journal of Banking & Finance, Vol. 109, 2019.
Boxes 1 and 2 document two important additional facts that set apart corporate bond market conditions during the two crises. First, many first-time issuers entering this market during the crises were on average riskier than existing issuers. Second, and possibly related to this, the size of non-bank financial intermediaries – the main holders of corporate bonds – has grown since the GFC. This might have provided additional credit supply to firms, thus exerting downward pressure on the cost of bond finance. In contrast to these divergent patterns in debt financing flows during the GFC and the pandemic, the net issuance of equities was similar across the two crises.
A key feature of the pandemic crisis, which also sets it apart from the GFC, is that the economic fallout was very unevenly distributed across the corporate sector. Firms offering contact-intensive services were particularly hard-hit by the pandemic crisis, given the self-imposed and government-mandated restrictions on physical interactions. At the other end of the spectrum, the pandemic crisis in fact yielded economic benefits for many firms that were predominantly operating digitally, as both work and leisure activities increasingly moved online. Chart 4 focuses on large firms, whereas contact-intensive services are, for the most part, supplied by small companies. Therefore, this factor is unlikely to be the main driver of the patterns reported here.
This box is based on Darmouni, O. and Papoutsi, M., “The Rise of Bond Financing in Europe”, Working Paper Series, No 2663, ECB, Frankfurt am Main, May 2022.
See Altavilla, C., Pagano, M. and Simonelli, S., “Bank Exposures and Sovereign Stress Transmission”, Review of Finance, Vol. 21, No 6, October 2017, pp. 2103-2139; Arce, O., Mayordomo, S. and Gimeno, R., “Making Room for the Needy: The Credit-Reallocation Effects of the ECB’s Corporate QE”, Review of Finance, Vol. 25, No 1, February 2021, pp. 43-84; Becker, B. and Ivashina, V., “Financial Repression in the European Sovereign Debt Crisis”, Review of Finance, Vol. 22, No 1, February 2018, pp. 83-115; Becker, B. and Josephson, J., “Insolvency Resolution and the Missing High-Yield Bond Markets”, The Review of Financial Studies, Vol. 29, No 10, October 2016, pp. 2814-2849; De Santis, R. and Zaghini, A., “Unconventional monetary policy and corporate bond issuance”, Working Paper Series, No 2329, ECB, Frankfurt am Main, November 2019; Grosse-Rueschkamp, B., Steffen, S. and Streitz, D., “A capital structure channel of monetary policy”, Journal of Financial Economics, Vol. 133, No 2, August 2019, pp. 357-378; Ongena, S., Pinoli, S., Rossi, P. and Scopelliti, A., “Bank credit and market-based finance for corporations: the effects of minibond issuances”, Working Paper Series, No 2508, ECB, Frankfurt am Main, December 2020; Todorov, K., “Quantify the quantitative easing: Impact on bonds and corporate debt issuance”, Journal of Financial Economics, Vol. 135, No 2, February 2020, pp. 340-358.
Firms that entered the bond market after 2006 account for almost 15% of the total volume of bonds outstanding in 2019.
See Becker, B. and Benmelech, E., “The Resilience of the U.S. Corporate Bond Market During Financial Crises”, Working Paper Series, No 28868, National Bureau of Economic Research, Cambridge, MA, May 2021; Goldstein, I., Jiang, H. and Ng, D.T., “Investor flows and fragility in corporate bond funds”, Journal of Financial Economics, Vol. 126, No 3, December 2017, pp. 592-613; Falato, A., Goldstein, I. and Hortaçsu, A., “Financial Fragility in the COVID-19 Crisis: The Case of Investment Funds in Corporate Bond Markets”, Working Paper Series, No 27559, National Bureau of Economic Research, Cambridge, MA, May 2021.
The VAR is estimated with quarterly data from the first quarter of 1990 to the second quarter of 2021 for 16 variables (including six credit volume and price aggregates) and identifies 12 shocks (including six credit supply and credit demand shocks). Identification is achieved by imposing standard sign restrictions of the responses of variables, as well as ratios of variables. The sign restrictions to identify a monetary policy shock are imposed on a proxy shadow policy rate (derived as a principal component of available shadow rates for the euro area), implying that this shock is aimed at capturing both standard and non-standard monetary policy disturbances. See Adalid, R., Korobilis, D. and Musso, A., “Anatomy of Credit Cycles”, mimeo, ECB, 2021.
See Holm-Hadulla, F. and Thürwächter, C., “Heterogeneity in corporate debt structures and the transmission of monetary policy”, European Economic Review, Vol. 136, July 2021.
The PEPP played a market-stabilising role also by counteracting investment fund outflows in the early stages of the pandemic crisis. Investment funds belong to the main holders of corporate debt securities, and they came under strong selling pressure as redemptions exceeded their cash holdings during the initial turmoil. After the announcement of the PEPP, fund flows then stabilised; see “Financial Stability Review”, ECB, Frankfurt am Main, 2020. These patterns also concur with more systematic evidence on the link between accommodative monetary policy and investment fund flows; see Giuzio, M., Kaufmann, C., Ryan, E. and Cappiello, L., “Investment funds, risk-taking, and monetary policy in the euro area”, Working Paper Series, No 2605, ECB, Frankfurt am Main, October 2021.
In addition to its market stabilisation function, the impact of the PEPP on the monetary stance worked via compressing the bond yields of public and private-sector issuers. This ultimately supported the issuance of corporate bonds. It also helped by providing additional monetary policy accommodation, at a time when the reduction in ECB rates was constrained by their proximity to the effective lower bound.
For instance, the share of loans to euro area firms with maturity or interest rate reset within 12 months is more than 50%, whereas for corporate bonds the share with residual maturity below one year is around 10%; for further discussion of the distinctive features of loan versus bond-financing instruments, see Crouzet, N., “Credit disintermediation and monetary policy”, IMF Economic Review, International Monetary Fund, Vol. 69, No 1, 2021, pp. 1-67; De Fiore, F. and Uhlig, H., op. cit., pp. 1571-1598. As regards the creditor base, bond finance may differ from loans not only due to a higher degree of diversification, but also in terms of the different types of financial institutions populating the supply side of this market: it is primarily non-bank financial intermediaries that extend corporate credit via bond markets, whereas loans to euro area firms are predominantly supplied by banks. Since banks and non-banks differ fundamentally in their business models, balance sheet structures and regulatory environment, creditor composition may act as a further factor that differentiates the transmission of shocks to loan and bond markets; see Cappiello, L., Holm-Hadulla, F., Maddaloni, A., Mayordomo, S., Unger, R. et al., “Non-bank financial intermediation in the euro area – implications for monetary policy transmissions and key vulnerabilities”, Occasional Paper Series, No 270, ECB, Frankfurt am Main, December 2021.
Aggregate supply shocks are assumed to imply responses of real GDP growth and inflation in opposite directions, while business investment demand shocks, if expansionary (contractionary), are assumed to imply a positive (negative) response of real GDP growth, inflation, the shadow rate, and real business investment growth, as well as a stronger response of real business investment growth relative to other aggregates (such as residential investment, consumption or NFC loan growth).
While the analysis focuses on financing flows to the euro area corporate sector as a whole, the incidence of aggregate shocks to different types of firms may differ substantially. In particular, small and medium-sized enterprises often face obstacles in accessing bond markets and therefore rely heavily on bank loans to finance their debts (Box 1). Accordingly, the cushioning impact of bond financing is likely to benefit only a subset of the sector, consisting of larger companies that do have access to this market.
This finding adds to previous literature suggesting that economies with a higher prevalence of bond financing and more active substitution of loans with bonds in the corporate sector tend to recover more quickly from recessions; see Grjebine, T., Szczerbowicz, U. and Tripier, F., “Corporate debt structure and economic recoveries”, European Economic Review, Vol. 101, January 2018, pp. 77-100.
As the econometric model is symmetric with regard to positive and negative shocks, it would point to analogous conclusions if the analysis were to consider a supply expansion or demand contraction, instead of the supply contraction and demand expansion discussed in the text.
The analysis is based on Holm-Hadulla, F. and Thürwächter, C., “Heterogeneity in corporate debt structures and the transmission of monetary policy”, European Economic Review, Vol. 136, July 2021.
These findings add to ample literature on the effects of monetary policy, and in particular the ECB’s corporate sector purchase programme, on corporate bond markets in the euro area; see, for example, De Santis, R. and Zaghini, A., op. cit.; Grosse-Rueschkamp, B. et al., op. cit.; Arce, O., Mayordomo, S. and Gimeno, R., op. cit.
See Grosse-Rueschkamp, B. et al., op. cit.; Todorov, K., op. cit.; and De Santis, R. and Zaghini, A., op. cit.
See Becker, B. and Ivashina, V., op. cit.; and Altavilla et al., op. cit.
See Crouzet, N., op. cit.
See Cappiello, L., Giuzio, M. and Lenoci, F., “Market-based finance for corporations: demand and supply of credit”, mimeo, June 2022.
See, for example, Gambacorta, L., Yang, J. and Tsatsaronis, K., “Financial structure and growth”, BIS Quarterly Review, March 2014, pp. 21-35; Langfield, S. and Pagano, M., “Bank bias in Europe: Effects on systemic risk and growth”, Economic Policy, Vol. 31, No 85, January 2016, pp. 51-106.
The substitutive relationship between loans and bonds over the period considered in this analysis therefore corresponds more closely to the patterns observed during the GFC and stands in contrast to the complementary relationship seen during the pandemic, which began after the end of the sample considered here.
While bond purchases are the primary channel for non-banks to extend credit to the corporate sector, some jurisdictions have also experienced increasing non-bank lending activity to firms; see, for example, the Irish case documented in Heffernan, T., McCarthy, B., McElligott, R. and Scollard, C., “The role of non-bank lenders in financing Irish SMEs: Behind the Data”, Central Bank of Ireland, Dublin, April 2021.
See, for example, Altavilla, C., Laeven, L. and Peydró, J.-L., “Monetary and macroprudential policy complementarities: evidence from European credit registers”, Working Paper Series, No 2504, ECB, Frankfurt am Main, December 2020.