
- STATISTICAL RELEASE
Euro area economic and financial developments by institutional sector: second quarter of 2023
27 October 2023
- As of October 2023, ECB quarterly financial accounts provide breakdown of life insurance and pension entitlements by investment risk
- Euro area net saving increased to €669 billion in four quarters to second quarter of 2023, compared with €640 billion one quarter earlier
- Household debt-to-income ratio decreased to 89.4% in second quarter of 2023 from 95.0% one year earlier
- Non-financial corporations' debt-to-GDP ratio (consolidated measure) decreased to 68.8% in second quarter of 2023 from 73.4% one year earlier
Life insurance and pension entitlements by investment risk
As of October 2023, the quarterly financial accounts published by the European Central Bank (ECB) provide a breakdown of life insurance and annuity entitlements as well as pension entitlements by investment risk.
In the case of unit-linked life insurance and defined contribution pensions, the investment risk is borne by households. This means that the value of households’ entitlements depends on the investment returns of the premiums and contributions invested on their behalf.
In the case of non-unit linked life insurance and defined benefit pensions, the benefits are largely specified in nominal terms. The investment risk is primarily borne by the insurance corporation, and the pension fund or employer (or other pension sponsor).
In the euro area, more than 75% of life insurance and pension entitlements consist of non-unit linked life insurance and defined benefit pensions (see Chart 1). For more details see: life insurance and pension entitlement by investment risk explained.
Chart 1
Household life insurance and pension entitlements by investment risk
(Assets, outstanding amounts at the end of second quarter of 2023 as percentages of total)

Sources: ECB.
* Includes hybrid pension entitlements.
Total euro area economy
Euro area net saving increased to €669 billion (6.1% of euro area net disposable income) in the four quarters to the second quarter of 2023, as compared with €640 billion in the four-quarter period ending in the first quarter. Euro area net non-financial investment increased to €628 billion (5.7% of net disposable income), due to higher net investment by non-financial corporations more than offsetting a decrease by households, while net investment by financial corporations and general government were broadly unchanged (see Chart 2 and Table 1 in the Annex).
Euro area net lending to the rest of the world decreased to €87 billion (from €103 billion in the previous quarter), reflecting net non-financial investment increasing more than net saving. Net lending of non-financial corporations declined to €171 billion (1.5% of net disposable income) from €221 billion, while that of financial corporations grew to €97 billion (0.9% of net disposable income) from €79 billion. Net lending by households increased to €355 billion (3.2% of net disposable income) from €310 billion. The growth in net lending by the total private sector was more than offset by an increase in net borrowing by the general government (-4.9% of net disposable income, after -4.7% previously).
Chart 2
Euro area saving, investment and net lending to the rest of the world
(EUR billions, four-quarter sums)
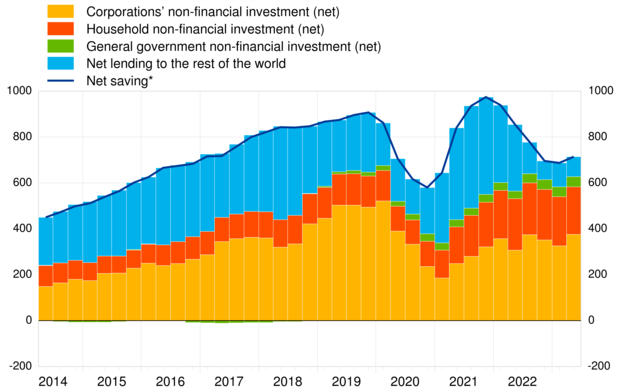
* Net saving minus net capital transfers to the rest of the world (equals change in net worth due to transactions).
Households
Household financial investment increased at an annual rate of 2.1% in the second quarter of 2023, down from 2.3% in the previous quarter. This deceleration was mainly due to lower growth rates of currency and deposits as well as shares and other equity, while net purchases of debt securities further strongly accelerated.
In the four quarters to the second quarter of 2023, households were net buyers of debt securities issued by all sectors, with net purchases increasing particularly strongly for debt securities issued by general government and MFIs. Households were net buyers of listed shares, although at a lower rate. This deceleration was mainly due to lower net purchases of listed shares issued by non-financial corporations (see Table 1 below and Table 2.2. in the Annex).
The household debt-to-income ratio[1] decreased to 89.4% in the second quarter of 2023 from 95.0% in the second quarter of 2022. The household debt-to-GDP ratio declined to 55.1% in the second quarter of 2023 from 58.1% in the second quarter of 2022 (see Chart 3).
Table 1
Financial investment and financing of households, main items
(annual growth rates)
Financial transactions | |||||
2022 Q2 | 2022 Q3 | 2022 Q4 | 2023 Q1 | 2023 Q2 | |
Financial investment* | 2.8 | 2.7 | 2.5 | 2.3 | 2.1 |
Currency and deposits | 3.7 | 4.0 | 3.8 | 2.3 | 1.6 |
Debt securities | 1.8 | 9.0 | 18.4 | 41.2 | 52.1 |
Shares and other equity | 2.3 | 1.8 | 1.0 | 1.4 | 1.1 |
Life insurance | 1.3 | 1.0 | 0.8 | 0.8 | 0.6 |
Pension schemes | 2.4 | 2.4 | 2.4 | 2.3 | 2.3 |
Financing** | 5.0 | 5.1 | 4.7 | 4.1 | 2.2 |
Loans | 4.4 | 4.3 | 3.7 | 2.9 | 1.8 |
Source: ECB.
* Items not shown include: loans granted, prepayments of insurance premiums and reserves for outstanding claims and other accounts receivable.
** Items not shown include: financial derivatives' net liabilities, pension schemes and other accounts payable.
Chart 3
Debt ratios of households and non-financial corporations
(percentages of GDP)
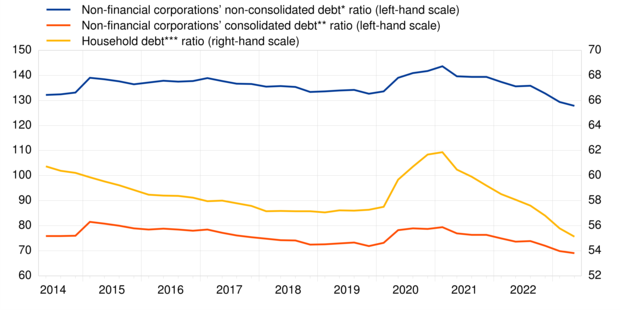
Source: ECB and Eurostat.
* Outstanding amount of loans, debt securities, trade credits and pension scheme liabilities.
** Outstanding amount of loans and debt securities, excluding debt positions between non-financial corporations.
*** Outstanding amount of loan liabilities.
Non-financial corporations
Financing of non-financial corporations increased at an annual rate of 0.8%, after 1.3% in the previous quarter. This resulted from a deceleration in financing by loans, in particular from MFIs and from within the non-financial corporation sector, as well as in financing by shares and other equity, and trade credits, while the financing by debt securities accelerated somewhat (see Table 2 below and Table 3.2 in the Annex).
Non-financial corporations' debt-to-GDP ratio (consolidated measure) decreased to 68.8% in the second quarter of 2023, from 73.4% second quarter of 2022; the non-consolidated, wider debt measure declined to 127.8% from 135.6% (see Chart 3).
Table 2
Financing and financial investment of non-financial corporations, main items
(annual growth rates)
Financial transactions | |||||
2022 Q2 | 2022 Q3 | 2022 Q4 | 2023 Q1 | 2023 Q2 | |
Financing* | 3.0 | 2.7 | 1.9 | 1.3 | 0.8 |
Debt securities | 4.8 | 3.2 | 1.1 | 0.0 | 0.7 |
Loans | 4.7 | 5.9 | 4.5 | 3.3 | 2.4 |
Shares and other equity | 1.1 | 0.7 | 0.6 | 0.3 | -0.2 |
Trade credits and advances | 12.4 | 8.5 | 4.2 | 2.6 | 1.3 |
Financial investment** | 4.6 | 3.9 | 3.0 | 2.4 | 1.7 |
Currency and deposits | 7.7 | 7.1 | 5.1 | 0.7 | -1.6 |
Debt securities | 5.2 | 11.1 | 14.7 | 24.1 | 23.4 |
Loans | 5.6 | 5.4 | 4.2 | 3.5 | 2.7 |
Shares and other equity | 2.5 | 2.1 | 1.5 | 1.1 | 0.7 |
Source: ECB.
* Items not shown include: pension schemes, other accounts payable, financial derivatives’ net liabilities and deposits.
** Items not shown include: other accounts receivable and prepayments of insurance premiums and reserves for outstanding claims.
For queries, please use the Statistical information request form.
Notes
- These data come from a second release of quarterly euro area sector accounts from the European Central Bank (ECB) and Eurostat, the statistical office of the European Union. This release incorporates revisions and completed data for all sectors compared with the first quarterly release on "Euro area households and non-financial corporations" of 5 October 2023.
- This statistical release incorporates revisions to the data since the first quarter of 1999, reflecting, amongst others, the inclusion of Croatia in the aggregates according to the fixed euro area composition also for the period before 2013.
- The euro area and national financial accounts data of non-financial corporations and households are available in an interactive dashboard.
- The debt-to-GDP (or debt-to-income) ratios are calculated as the outstanding amount of debt in the reference quarter divided by the sum of GDP (or income) in the four quarters to the reference quarter. The ratio of non-financial transactions (e.g. savings) as a percentage of income or GDP is calculated as sum of the four quarters to the reference quarter for both numerator and denominator.
- The annual growth rate of non-financial transactions and of outstanding assets and liabilities (stocks) is calculated as the percentage change between the value for a given quarter and that value recorded four quarters earlier. The annual growth rates used for financial transactions refer to the total value of transactions during the year in relation to the outstanding stock a year before.
- Hyperlinks in the main body of the statistical release lead to data that may change with subsequent releases as a result of revisions. Figures shown in annex tables are a snapshot of the data as at the time of the current release.
Calculated as loans divided by gross disposable income adjusted for the change in pension entitlements.