
- STATISTICAL RELEASE
Euro area quarterly balance of payments and international investment position:
fourth quarter of 2023
09 April 2024
- Current account surplus at €240 billion (1.7% of euro area GDP) in 2023, after a €79 billion deficit (0.6% of GDP) a year earlier.
- Geographical counterparts: largest bilateral current account surpluses vis-à-vis United Kingdom (€187 billion) and Switzerland (€66 billion) and largest deficits vis-à-vis China (€120 billion) and EU Member States and EU institutions outside the euro area (€34 billion)
- International investment position showed net assets of €585 billion (4.1% of euro area GDP) at end of 2023
- Special purpose entities represented 11.5% of euro area financial assets and 11.2% of liabilities at end of 2023
Current account
The current account of the euro area recorded a surplus of €240 billion (1.7% of euro area GDP) in 2023, after recording a deficit of €79 billion (0.6% of GDP) a year earlier (Table 1). This development was mainly driven by a switch from a deficit (€76 billion) to a surplus for goods (€246 billion) and, to a lesser extent, by an increase in the surplus for primary income (from €15 billion to €28 billion) and a decrease in the deficit for secondary income from €166 billion to €157 billion. These developments were partly offset by a reduction in the surplus for services (down from €148 billion to €123 billion).
The lower surplus for services was mainly due to a change from a surplus of €24 billion to a balanced account for transport services and widening deficits for other business services (from €43 billion to €60 billion) and other services (from €43 billion to €62 billion), partly offset by a larger surplus for telecommunication, computer and information services (from €147 billion to €163 billion).
The increase in the primary income surplus was mainly due to a larger surplus in direct investment income (from €24 billion to €85 billion), partly offset by a larger deficit in portfolio equity income (from €103 billion to €154 billion).
Table 1
Current account of the euro area

Source: ECB.
Notes: “Equity” comprises equity and investment fund shares. Discrepancies between totals and their components may arise from rounding.
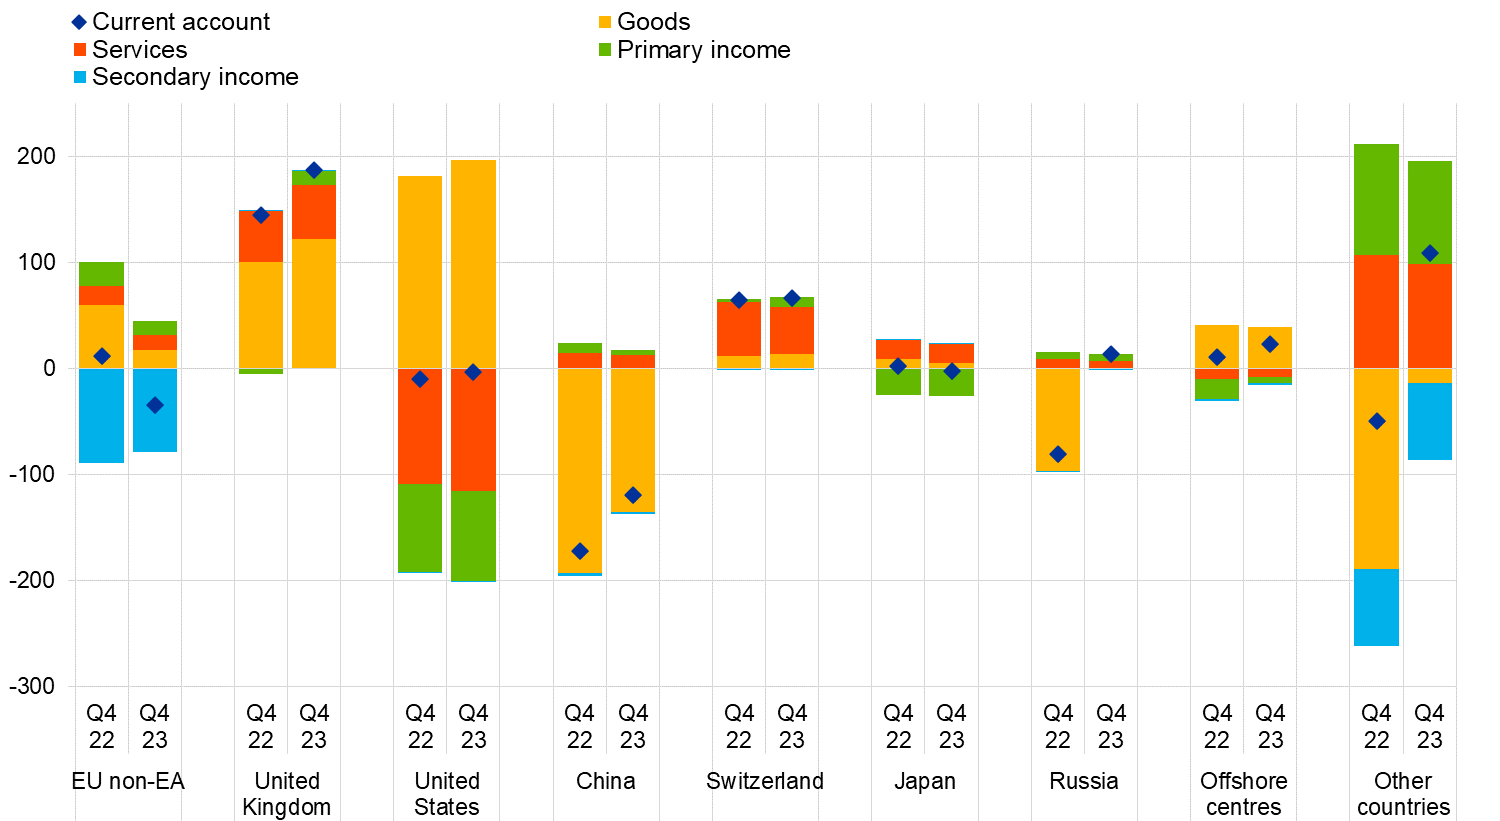
Data on the geographical counterparts of the euro area current account (Chart 1) show that in 2023 the euro area recorded its largest bilateral surpluses vis-à-vis the United Kingdom (€187 billion, up from €145 billion in 2022) and Switzerland (€66 billion, up from €64 billion). It also recorded a surplus vis-à-vis the residual group of other countries, switching from a €50 billion deficit in 2022 to a €109 billion surplus in 2023. The largest bilateral deficits were recorded vis-à-vis China (€120 billion, down from €172 billion in 2022) and the EU Member States and EU institutions outside the euro area (€34 billion, after a surplus of €12 billion in 2022).
The most significant changes in the geographical components of the current account in 2023 compared to 2022 were as follows. The goods deficits declined vis-à-vis Russia (from €97 billion to €1 billion), China (from €193 billion to €135 billion) and the residual group of other countries (from €190 billion to €14 billion). The change vis-à-vis the latter was partly due to a smaller deficit with Norway (from €76 billion to €40 billion), a larger surplus with Türkiye (from €9 billion to €25 billion) and lower imports from countries within the Organization of the Petroleum Exporting Countries. The surplus in goods vis-à-vis EU Member States and EU institutions outside the euro area decreased from €60 billion to €17 billion, while it increased vis-à-vis the United States from €182 billion to €197 billion.
In services, the surplus declined vis-à-vis Switzerland (from €51 billion to €44 billion) in 2023, while the deficit vis-à-vis the United States increased (from €109 billion to €115 billion). In primary income, a switch from a deficit (€5 billion) in 2022 to a surplus (€13 billion) was recorded vis-à-vis the United Kingdom, and the deficit in secondary income vis-à-vis the EU Member States and EU institutions outside the euro area decreased (from €90 billion to €80 billion).
Chart 1
Geographical breakdown of the euro area current account balance
(four-quarter moving sums in EUR billions; non-seasonally adjusted)
Source: ECB.
Note: “EU non-EA” comprises the non-euro area EU Member States and those EU institutions and bodies that are considered for statistical purposes as being outside the euro area, such as the European Commission and the European Investment Bank. “Other countries” includes all countries and country groups not shown in the chart, as well as unallocated transactions.
International investment position
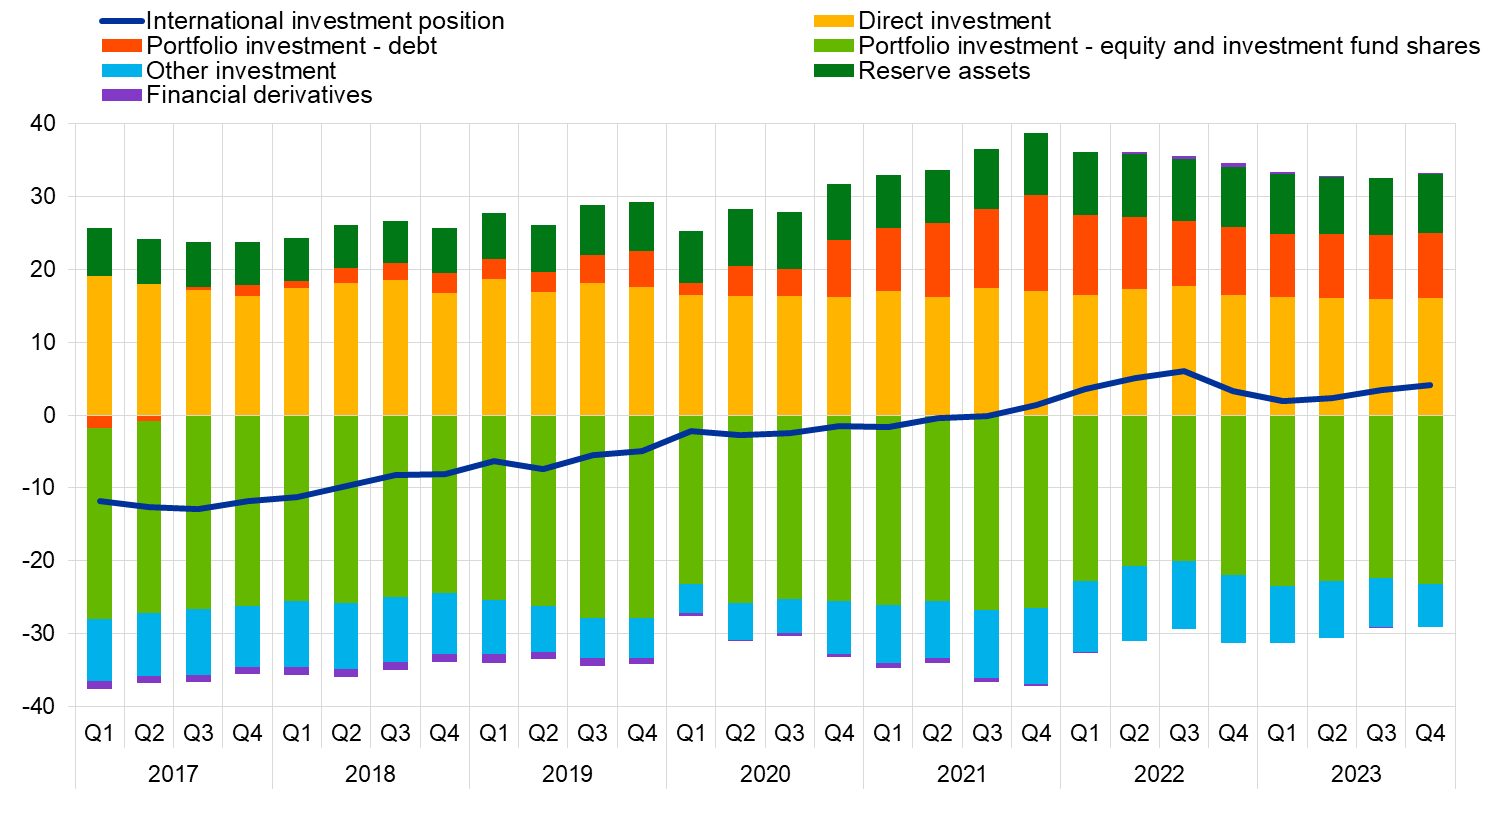
At the end of 2023, the international investment position of the euro area recorded net assets of €585 billion vis-à-vis the rest of the world (4.1% of euro area GDP), up from €483 billion in the previous quarter (Chart 2 and Table 2).
Chart 2
Net international investment position of the euro area
(net amounts outstanding at the end of the period as a percentage of four-quarter moving sums of GDP)
Source: ECB.
The €102 billion increase in net assets was mainly driven by lower net liabilities in other investment (down from €0.96 trillion to €0.84 trillion). Moreover, larger net assets were recorded in direct investment (up from €2.26 trillion to €2.32 trillion) and portfolio debt (up from €1.25 trillion to €1.29 trillion). These developments were partly offset by an increase in net liabilities in portfolio equity (from €3.17 trillion to €3.33 trillion).
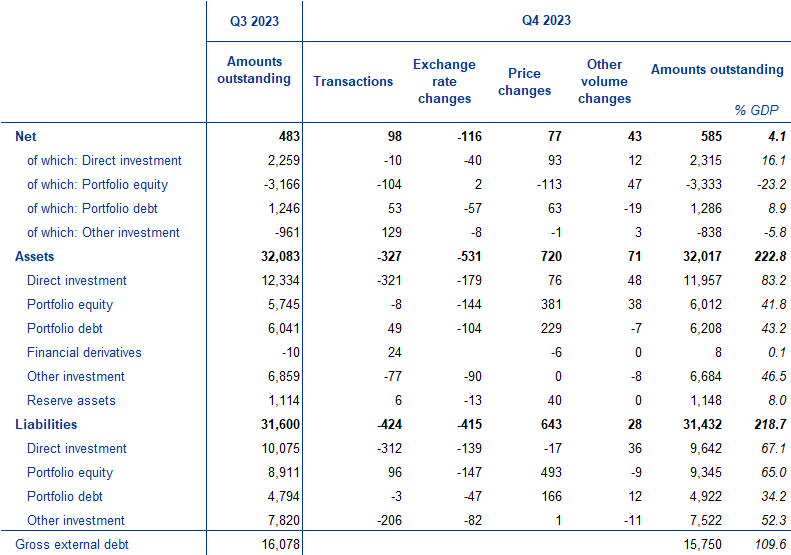
Table 2
International investment position of the euro area
(EUR billions, unless otherwise indicated; amounts outstanding at the end of the period, flows during the period; non-working day and non-seasonally adjusted)
Source: ECB.
Notes: “Equity” comprises equity and investment fund shares. Net financial derivatives are reported under assets. “Other volume changes” mainly reflect reclassifications and data enhancements. Discrepancies between totals and their components may arise from rounding.
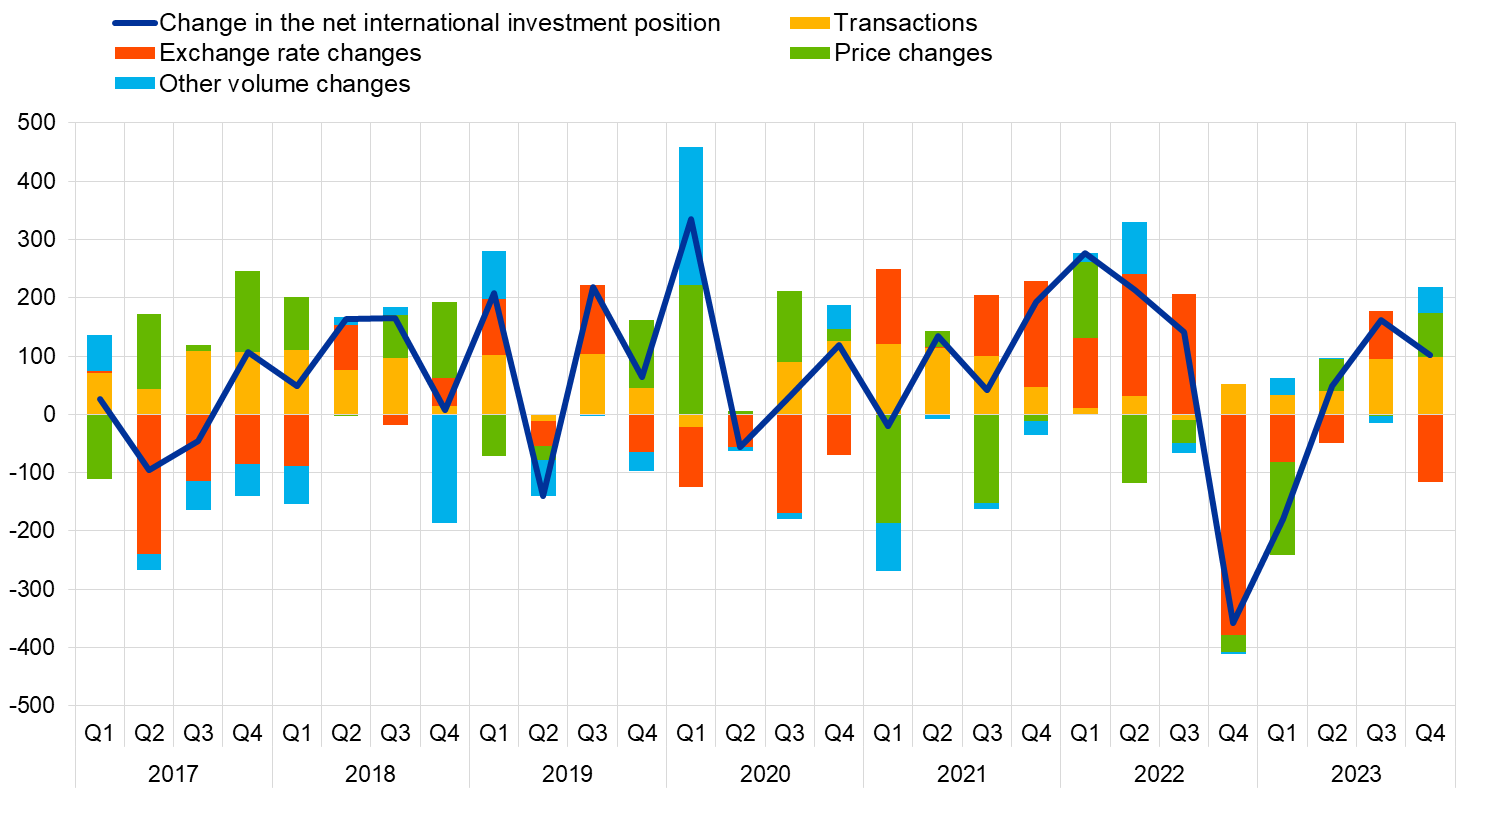
The developments in the euro area’s net international investment position in the fourth quarter of 2023 were driven mainly by transactions and positive net flows due to price changes and other volume changes which were partly offset by exchange rate changes (Table 2 and Chart 3).
At the end of the fourth quarter of 2023 the gross external debt of the euro area amounted to €15.8 trillion (110% of euro area GDP), down by €328 billion compared with the previous quarter.
Chart 3
Changes in the net international investment position of the euro area
(EUR billions; flows during the period; non-working day and non-seasonally adjusted)
Source: ECB.
Note: “Other volume changes” mainly reflect reclassifications and data enhancements.
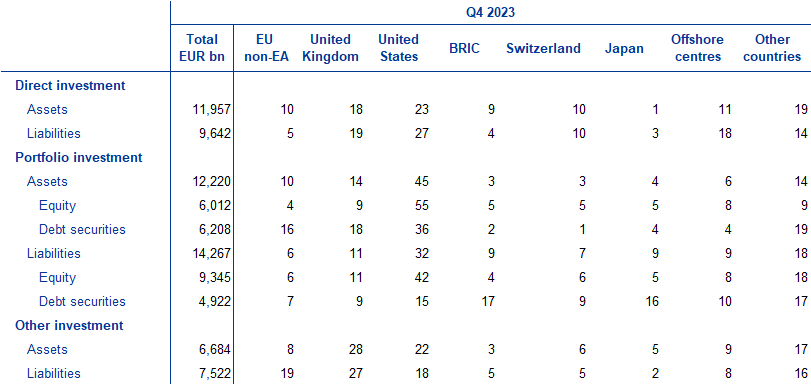
At the end of 2023 euro area direct investment assets were €12.0 trillion, 23% of which was invested in the United States and 18% in the United Kingdom (see Table 3). Euro area direct investment liabilities were €9.6 trillion, with 27% being investments from the United States, 19% from the United Kingdom and 18% from offshore centres.
In portfolio investment, euro area holdings of foreign securities amounted to €6.0 trillion in equity and €6.2 trillion in debt at the end of 2023. The largest holdings of equity securities were in securities issued by residents of the United States (accounting for 55%), followed by those issued by residents of the United Kingdom (accounting for 9%) and offshore centres (accounting for 8%). In debt securities, the largest euro area holdings were in securities issued by residents of the United States (accounting for 36%), the United Kingdom (18%) and the EU Member States and EU institutions outside the euro area (16%).
On the portfolio investment liabilities side, non-residents’ holdings of securities issued by euro area residents stood at €9.3 trillion in equity and at €4.9 trillion in debt at the end of 2023. The largest holder countries of euro area equity securities were the United States (42%) and the United Kingdom (11%), while in euro area debt securities the largest holders were the BRIC group of countries (17%), Japan (16%) and the United States (15%).
In other investment, euro area residents’ claims on non-residents amounted to €6.7 trillion, 28% of which was vis-à-vis the United Kingdom and 22% vis-à-vis the United States. Euro area other investment liabilities amounted to €7.5 trillion, with the United Kingdom accounting for 27%, while the shares of the EU Member States and EU institutions outside the euro area and the United States were 19% and 18% respectively.
Table 3
International investment position of the euro area – geographical breakdown
(as a percentage of the total, unless otherwise indicated; at the end of the period; non-working day and non-seasonally adjusted)
Source: ECB.
Notes: “Equity” comprises equity and investment fund shares. “EU non-EA” comprises the non-euro area EU Member States and those EU institutions and bodies that are considered for statistical purposes as being outside the euro area, such as the European Commission and the European Investment Bank. The “BRIC” countries are Brazil, Russia, India and China. “Other countries” includes all countries and country groups not listed in the table as well as unallocated positions.
Special purpose entities
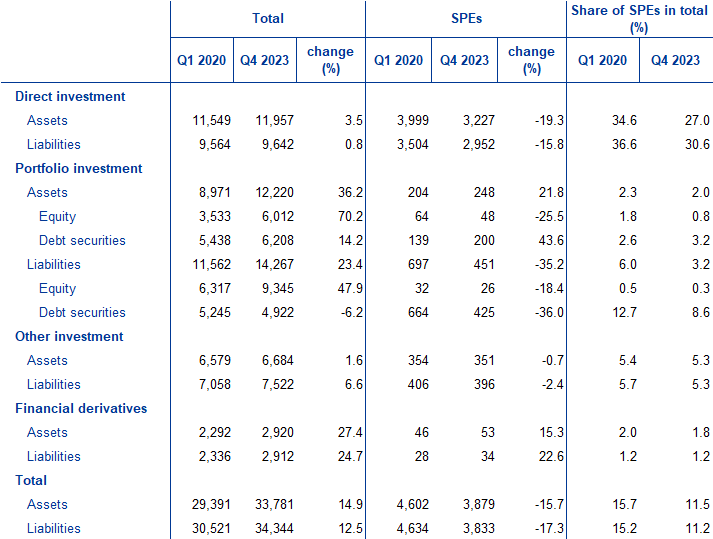
This release also includes information on a separate breakdown for special purpose entities (SPEs) in euro area balance of payments and international investment position statistics. SPEs are legal entities with minimal employment, physical presence and production in the host economy, established to obtain specific advantages provided by the host jurisdiction, controlled by non-residents and transacting almost entirely with non-residents of the host jurisdiction. The data show that resident SPEs represented 11.5% of euro area external financial assets and 11.2% of external liabilities at the end of 2023 (Table 4). Across functional categories, SPEs were most relevant in direct investment (accounting for 27.0% for assets and for 30.6% for liabilities) and in portfolio investment debt securities liabilities (8.6%). Since the first quarter of 2020 total asset and liability positions of SPEs had declined by 15.7% and 17.3% respectively, while the euro area’s total assets and liability positions had expanded by 14.9% and 12.5% respectively. The decline in assets and liabilities of SPEs was mainly due to developments in direct investment.
Table 4
International investment position of the euro area – breakdown by special purpose entities
(EUR billions, unless otherwise indicated; amounts outstanding at the end of the period; non-working day and non-seasonally adjusted)
Source: ECB.
Notes: Details on special purpose entities, including definition, methodology and data compilation, are available on the ECB’s website. “Equity” comprises equity and investment fund shares. “Total assets” and “total liabilities” refer to the sum of direct investment, portfolio investment, other investment and financial derivatives. Reserve assets are not included in the total. Financial derivatives are reported separately in gross terms under assets and liabilities. Discrepancies between totals and their components may arise from rounding. Percentage changes are computed for the period from the end of the first quarter of 2020 to the end of the fourth quarter of 2023.
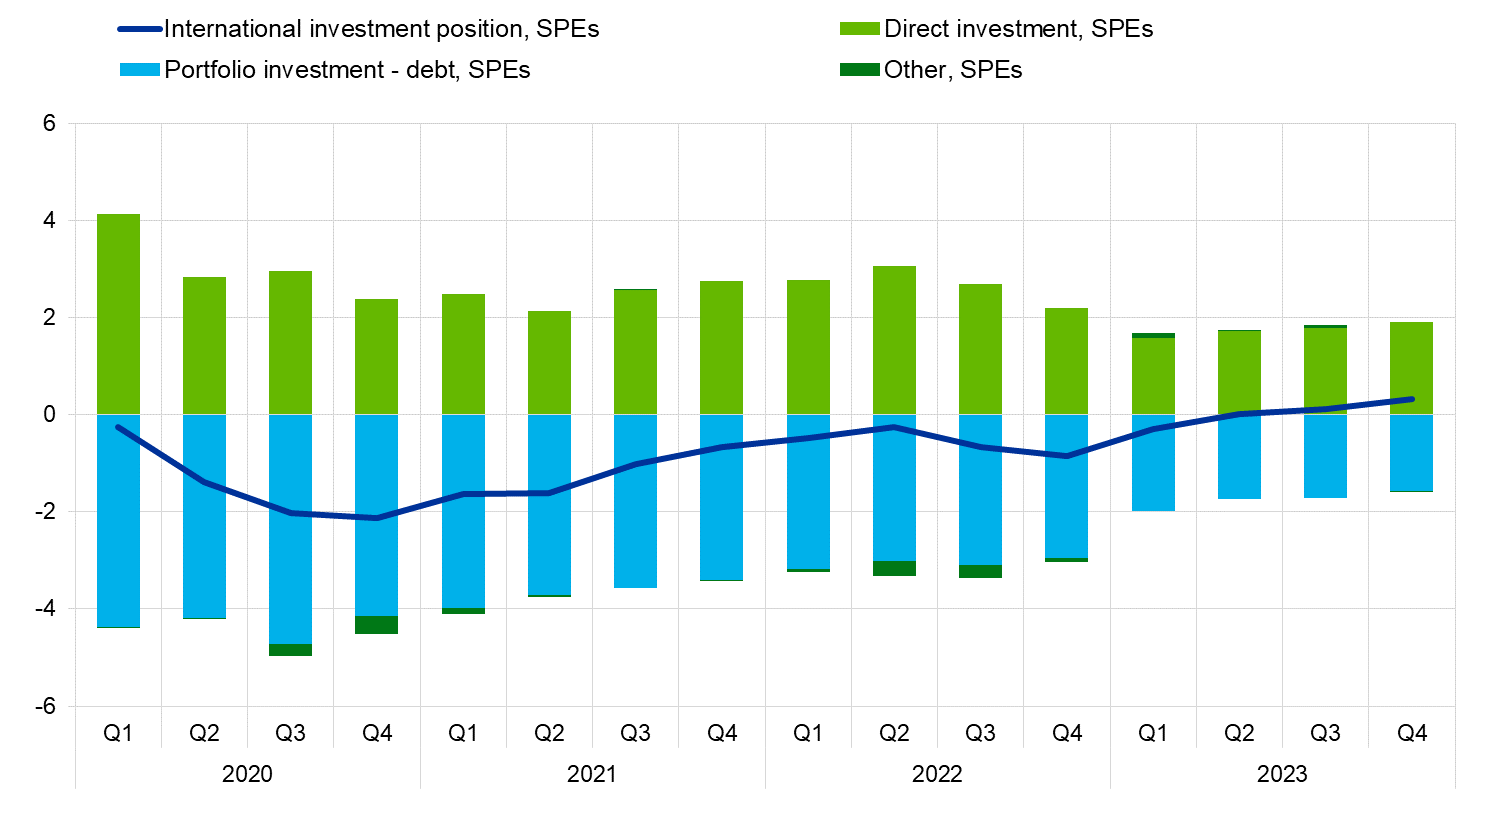
The euro area net international investment position of SPEs fluctuated around zero in recent years, showing net assets of 0.3% of GDP at the end of 2023 (Chart 4). Net assets were recorded in direct investment which were largely offset by net liabilities in portfolio investment debt securities.
Chart 4
Net international investment position of the euro area – role of special purpose entities
(net amounts outstanding at the end of the period as a percentage of four-quarter moving sums of GDP)
Source: ECB.
Notes: “Other, SPEs” includes the net amounts for portfolio equity, financial derivatives and other investment.
The impact of SPEs on the euro area current account balance was rather limited in recent years, showing a deficit of 0.1% of GDP in 2023.
Publication of data on special purpose entities
With this statistical release, additional details on SPEs, as indicated in the amended ECB External Statistics Guideline ECB/2022/23 are disseminated for the first time. These series present information on quarterly cross-border transactions and positions of SPEs in order to improve understanding of their role in the different components of external statistics. Details on SPEs, including definition, methodology and data compilation, are available on the ECB’s website. The data are disseminated for the euro area and euro area countries, beginning with data for the first quarter of 2020.
Data revisions
This statistical release incorporates revisions to the data for the reference periods between the first quarter of 2020 and the third quarter of 2023. The revisions reflect revised national contributions to the euro area aggregates as a result of the incorporation of newly available information.
Next releases
- Monthly balance of payments: 18 April 2024 (reference data up to February 2024)
- Quarterly balance of payments and international investment position: 4 July 2024 (reference data up to the first quarter of 2024)
For queries, please use the Statistical information request form.
Notes
- Data are neither seasonally nor working day-adjusted. Ratios to GDP (including in the charts) refer to four-quarter sums of non-seasonally and non-working day-adjusted GDP figures.
- Hyperlinks in this press release lead to data that may change with subsequent releases as a result of revisions.