The European Central Bank (ECB) has today published the 2012 statistics on non-cash payments, which comprise indicators on access to and use of payment instruments and terminals by the public, as well as volumes and values of transactions processed through payment systems. Statistics are published for each EU Member State, in addition to EU and euro area aggregates and comparative data.
Payment instruments [1]
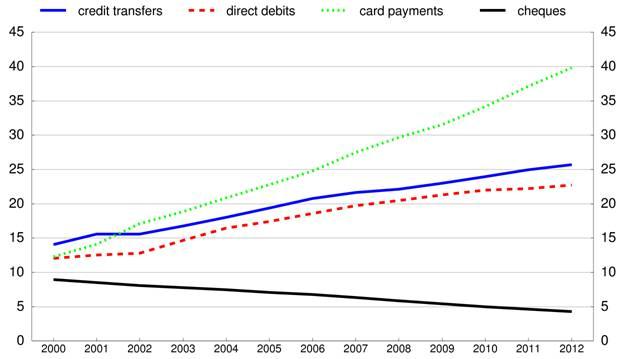
The total number of non-cash payments in the EU, using all types of instruments, increased by 4.2% to 94.5 billion in 2012 compared with the previous year. Card payments accounted for 42% of all transactions, while credit transfers accounted for 27% and direct debits for 24%.
The number of credit transfers within the EU increased in 2012 by 3.0% to 25.7 billion. The importance of paper-based transactions continued to decrease, with the ratio of paper-based transactions to non-paper-based transactions standing at around one to five.
The number of cards with a payment function in the EU increased in 2012 by 1.5% to 738 million. With a total EU population of 504 million, this represented around 1.46 payment cards per EU inhabitant. The number of card transactions rose by 7.3% to 39.8 billion, with a total value of €2.0 trillion. This corresponds to an average value of around €51 per card transaction. Chart 1 below shows the use of the main payment instruments from 2000 to 2012.
The relative importance of each of the main payment instruments continued to vary widely across EU countries in 2012 (see Annex).
In 2012, the total number of automatic teller machines (ATMs) in the EU decreased by 0.4% to 0.44 million, while the number of points of sale (POS) terminals increased by 7.9% to 9.7 million.
Chart 1: Use of the main payment instruments in the EU (2000-2012)
(number of transactions per year in billions, estimated)

Source:ECB
Note: Data have been partially estimated for periods prior to 2010, as methodological changes were implemented in previous years and some corresponding data are not available. The historical estimation done by the ECB ensures comparability of figures over the entire period. Statistics are also collected on e-money transactions and other payment instruments, which accounted for 2.1% of the total number of EU transactions in 2012.
Retail payment systems
Retail payment systems in the EU handle mainly payments that are made by the public, with a relatively low value and limited time-criticality.
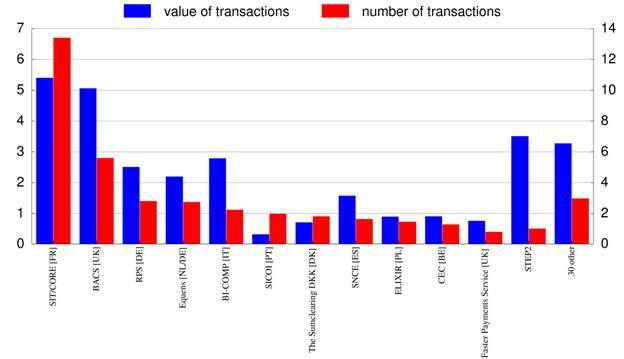
In 2012, 42 retail payment systems existed within the EU as a whole. During the year, nearly 40 billion transactions were processed by those systems with an amount of €30.0 trillion. 22 of these systems were located in the euro area, where they processed nearly 28 billion transactions in 2012 (i.e. 70% of the EU total) with a value amounting to €20.0 trillion (i.e. 67% of the EU total).
There continues to be a notable degree of concentration in EU retail payment systems in 2012. The five largest systems in terms of number of transactions (SIT/CORE in France, BACS in the United Kingdom, RPS in Germany, Equens in the Netherlands and Germany and BI-COMP in Italy) processed 67% of the volume and 60% of the value of all transactions processed by EU retail payment systems. Chart 2 shows the number and value of transactions processed by EU retail payment systems in 2012.
Chart 2: Retail payment systems in the EU in 2012
(value of transactions in EUR trillions (left-hand scale) and number of transactions in billions (right-hand scale))

Source: ECB.
Large-value payment systems
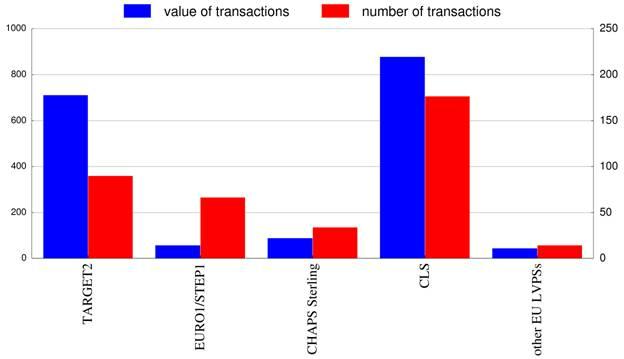
Large-value payment systems (LVPSs) are designed primarily to process urgent or large-value interbank payments, but some of them also settle a large number of retail payments. During 2012, 15 systems settled 740 million payments with a total value of €908 trillion in the EU. [2] The two main LVPSs in the euro area (TARGET2 and EURO1/STEP1) [3] settled 157 million transactions amounting to €769 trillion in 2012, i.e. 85% of the total value. In the non-euro area EU countries, CHAPS Sterling [4] in the United Kingdom is the largest LVPS in terms of value and number of transactions.
Outside the EU, Continuous Linked Settlement [5] (CLS) is the most important large value payment system processing, inter alia, euro and other EU currencies. CLS (all currencies) settled 177 million transactions with a value of €878 trillion in 2012. Chart 3 below shows the number and value of transactions processed by LVPSs in 2012
Chart 3: Large-value payment systems in 2012
(value of transactions in EUR trillions (left-hand scale) and number of transactions in millions (right-hand scale))

Source:ECB. Note: Other EU LVPSs exclude CERTIS and ESTA, which act as both LVPSs and retail systems.
The full set of payment statistics can be downloaded from the Statistical Data Warehouse (SDW) on the ECB's website (http://sdw.ecb.europa.eu/browse.do?node=2746). The "Reports" section of the SDW also contains pre-formatted tables with payment statistics for the last five years. The data are presented in the same format as in the former "Blue Book Addendum", which is available in the "Statistics" section of the ECB's website (http://sdw.ecb.europa.eu/reports.do?node=100000760).
Annex
Table 1: Relative importance of the main payment instruments in the EU (2012)
(percentages of total number of transactions1)
| Credit transfers 2012 | Credit transfers Change from 2011 (pp) | Direct debits 2012 | Direct debits Change from 2011 (pp) | Cards 2012 | Cards Change from 2011 (pp) | Cheques 2012 | Cheques Change from 2011 (pp) | |
| Belgium | 37.51 | -3.51 | 11.41 | 0.84 | 49.01 | 2.89 | 0.22 | -0.04 |
| Bulgaria | 82.49 | -0.37 | 3.06 | -0.93 | 14.44 | 1.30 | – | – |
| Czech Republic | 55.64 | 0.56 | 13.30 | -1.59 | 30.23 | 2.75 | 0.06 | -0.01 |
| Denmark | 17.00 | -0.98 | 11.96 | 0.11 | 70.81 | 0.97 | 0.24 | -0.10 |
| Germany | 33.79 | -0.44 | 48.37 | -0.38 | 17.47 | 0.89 | 0.19 | -0.04 |
| Estonia | 30.56 | -0.47 | 5.84 | -0.18 | 63.59 | 0.65 | 0.00 | 0.00 |
| Ireland | 22.00 | -0.31 | 15.72 | 0.04 | 51.37 | 1.68 | 10.91 | -1.42 |
| Greece | 40.38 | 3.32 | 8.80 | -1.14 | 39.87 | -0.36 | 8.34 | -2.09 |
| Spain | 14.60 | 0.13 | 41.95 | 1.20 | 41.58 | -0.94 | 1.44 | -0.24 |
| France | 17.14 | 0.16 | 19.61 | -0.54 | 46.91 | 1.80 | 15.53 | -1.41 |
| Italy | 29.11 | -1.23 | 13.90 | -0.54 | 39.21 | 1.54 | 6.36 | -0.65 |
| Cyprus | 30.81 | 2.79 | 7.06 | -1.16 | 41.05 | -0.53 | 20.12 | -1.32 |
| Latvia | 49.35 | -0.64 | 1.62 | -0.15 | 48.47 | 0.70 | 0.00 | 0.00 |
| Lithuania | 53.73 | -1.99 | 4.23 | -1.14 | 42.00 | 3.15 | 0.04 | -0.02 |
| Luxembourg2) | 5.81 | -1.62 | 1.33 | -0.47 | 7.12 | -0.57 | 0.03 | 0.01 |
| Hungary | 61.95 | -2.02 | 7.21 | -0.26 | 29.58 | 2.42 | 0.00 | 0.00 |
| Malta | 22.10 | 0.43 | 4.41 | 0.23 | 49.46 | 6.00 | 23.90 | -6.72 |
| Netherlands | 28.94 | -0.46 | 23.38 | -0.54 | 45.15 | 1.53 | – | – |
| Austria | 41.05 | -1.35 | 36.80 | -0.06 | 20.14 | 1.26 | 0.07 | -0.01 |
| Poland | 58.37 | -2.40 | 0.78 | -0.09 | 40.85 | 2.49 | 0.00 | 0.00 |
| Portugal | 11.62 | 0.35 | 14.26 | 0.69 | 68.60 | -0.47 | 5.01 | -0.94 |
| Romania | 52.99 | -2.90 | 1.93 | 0.72 | 43.22 | 2.55 | 1.87 | -0.37 |
| Slovenia | 47.12 | -2.14 | 12.99 | -2.15 | 39.85 | 4.29 | 0.03 | -0.01 |
| Slovakia | 55.12 | -0.06 | 14.20 | -0.32 | 30.66 | 0.38 | 0.01 | 0.00 |
| Finland | 49.06 | 2.83 | 3.33 | -0.42 | 47.60 | -2.41 | 0.01 | 0.00 |
| Sweden | 25.67 | -1.11 | 8.88 | -0.44 | 65.45 | 1.56 | 0.01 | -0.01 |
| United Kingdom | 19.96 | -0.28 | 18.46 | -0.21 | 56.99 | 1.35 | 4.58 | -0.87 |
Source:ECB
Notes: 1) Percentages may not add up to 100% as e-money transactions and other payment instruments are not shown. A dash (–) indicates data are not applicable.
2) In the special case of Luxembourg, a very high number of e-money payments are executed on accounts held in their vast majority by non-residents but recorded in the Luxembourg data due to the methodology applied. Therefore, the relative importance of the payment instruments in Luxembourg, as presented in the table, appears to be lower than their actual domestic importance. When disregarding e-money, the relative importance of the main payment instruments in 2012 is as follows: credit transfers (40.7%), direct debits (9.3%), cards (49.8%) and cheques (0.2%).
-
[1]SEPA instruments are included in the respective categories. Information on the SEPA instruments can be found on the ECB's website ( http://www.ecb.europa.eu/paym/sepa/html/index.en.html).
-
[2]Among the LVPSs that also process retail payments, CERTIS - a Czech Republic system - is the main contributor in terms of number of transactions to the EU aggregate figure, with 510 million. In terms of value, CERTIS settled €5.6 trillion during 2012.
-
[3]TARGET2 is the second-generation Trans-European Automated Real-time Gross settlement Express Transfer system. It is operated by the Eurosystem and settles payments in euro in central bank money. EURO1/STEP1 is an EU-wide multilateral net large-value payment system for euro payments operated by EBA CLEARING. Credit transfers and direct debits are processed in EURO1 throughout the day and final balances are settled at the end of the day in TARGET2.
-
[4]CHAPS Sterling handles sterling-denominated interbank payments.
-
[5]CLS is a worldwide clearing and settlement system that settles FX transactions on a payment-versus-payment basis.


