

Published as part of the ECB Economic Bulletin, Issue 5/2023.
House price growth is slowing across advanced economies as monetary policy is tightened around the world and the rapid rises observed during the coronavirus (COVID-19) pandemic tail off. Over recent years, many advanced economies experienced a significant rise in real house prices that became even more marked during the pandemic. Statistical tests point to strong house price growth in many countries during the pandemic, with some seeing annual increases in excess of 10% (Chart A).[1] Several forces were at play. First, the low interest rate environment of the last decade gave rise to search-for-yield behaviour that pushed up house prices. Second, fiscal support boosting household net worth, especially during the main period of the pandemic, made it possible for house price growth to remain elevated. And third, stronger demand for certain types of housing stemming in part from a shift in living preferences – in connection with the new working from home requirements and reduced need for commuting, among other things – also contributed.[2] This pattern in house prices went into reverse in 2022 as monetary policy began tightening around the world, with some countries starting to see smaller increases or even decreases in real house prices (Chart A).[3]
Chart A
Real house price developments in advanced economies
(year-on-year percentage changes)

Sources: Federal Reserve Bank of Dallas and ECB calculations.
Note: “Pandemic” refers to the period from the first quarter of 2020 to the first quarter of 2022; “Post-pandemic” refers to the period from the second quarter of 2022 to the third quarter of 2022.
Housing is an important element in the transmission of monetary policy to the economy. Seminal academic papers have found a close link between housing and monetary policy transmission in DSGE models, for example.[4] In such models, the presence of borrowing-constrained home buyers strengthens monetary policy transmission through additional channels beyond the standard intertemporal substitution channel. One is the cash-flow channel, under which rising interest rates, for instance, increase the cost of mortgage repayments, thus reducing resources left for consumption; the second is the collateral channel, under which rising interest rates dampen the house prices that underpin collateral for mortgages, thus making constraints more binding.[5] The intensity of these channels is affected by specific features of a given country’s mortgage market, such as the share of adjustable-rate mortgages (ARMs) or the level of household debt. Academic research has pointed towards a positive correlation between the share of ARMs and the strength of monetary policy transmission.[6] As for the level of household debt, there is some evidence to suggest a relationship with a stronger effect of monetary policy on GDP.[7] Thus, structural changes in the mortgage market and levels of household debt in the euro area are possible factors making the current tightening cycle different from previous ones. Given the limited time dimension available to study these questions empirically, this box presents evidence from a cross-country analysis.
The analysis relies on structural empirical models, building on recent literature and using comparable house price data and shadow rates to account for unconventional monetary policy as well. We estimate structural BVAR models for 19 advanced economies from the first quarter of 1995 to the first quarter of 2022; the analysis can be updated whenever new data become available. The sample includes most advanced economies for which comparable house price data are available, eight of which are members of the euro area.[8] In fact, euro area countries turn out to be rather dissimilar in terms of the effects of monetary policy on the economy because of factors that may be linked to the housing market. A cross-country analysis encompassing other advanced economies helps to rationalise these differences. The model includes the following variables: private consumption, consumer prices, credit to households, real house prices, an interest rate and the real effective exchange rate.[9] Regarding the interest rate, we use the policy rate or the shadow rate computed by Krippner (see footnote), since this is available for many countries where asset purchases were conducted by the respective central banks.[10] We also include a block of foreign variables to control for global developments.[11] The identification approach extends the methodology used in other studies to identify housing demand, monetary policy and mortgage supply shocks separately from aggregate demand and aggregate supply shocks.[12]
The peak effect of monetary policy shocks on house prices and consumption varies greatly across advanced economies. The effect of monetary policy tightening on house prices is negative and stronger in countries with higher levels of household debt. Monetary policy shocks have a more negative effect on consumption where there are a higher share of homeowners with mortgages and a higher level of household debt (Chart B). A 1% increase in the (shadow) interest rate has a negligible effect on private consumption in Germany and Italy, where the share of homeowners with mortgages is low or very low, while reducing private consumption by around 2.5% in Denmark and Norway. However, up to the end of the sample period, there is only weak evidence that a higher share of ARMs implies that monetary policy shocks have a stronger impact on consumption.[13]
Chart B
Peak effect of 1% rate monetary policy shock on consumption depending on the share of homeowners with mortgages and levels of household debt
a) Share of homeowners with mortgages
(percentages)

b) Level of household debt
(percentages)

Sources: OECD, BIS and ECB calculations.
Notes: The set of countries depends on data availability. The latest observations for the effects on consumption refer to the first quarter of 2022. Panel a: the latest observations for the share of homeowners with mortgages are for 2020 or earlier. Panel b: the latest observations for household debt-to-GDP ratios are for the first quarter of 2022.
The collateral and cash-flow channels are key elements explaining cross-country differences in the strength of the housing channel of monetary policy transmission. Some of the cross-country differences in the impact of monetary policy shocks could be attributable to their differing effects on house price levels. In order to disentangle how much of this heterogeneity is due to the collateral channel – reflecting the fact that the value of housing collateral is affected differently across countries – we look at the peak effect on consumption, normalised by the peak effect on house prices. The results show that, after such normalisation, it is still the case that monetary policy has a stronger impact on consumption in countries with a higher share of homeowners with mortgages (Chart C, panel a). Thus, the main channel at work seems to be the cash-flow channel. A higher household debt-to-GDP ratio implies a stronger impact on consumption, but the relationship is weaker after conditioning on the peak effect on house prices. Finally, in countries with a higher share of ARMs, the peak effect on consumption is larger (and happens earlier), after normalising for the peak effect on house prices (Chart C, panel b). This further supports the notion of the cash-flow channel driving the relationship, although there are other structural differences in the mortgage markets of European countries that may play a role in explaining some of the cross-country differences.
Chart C
Peak effect of housing wealth on consumption depending on the share of homeowners with mortgages and the share of ARMs
a) Share of homeowners with mortgages
(percentages)

b) Share of ARMs
(percentages)
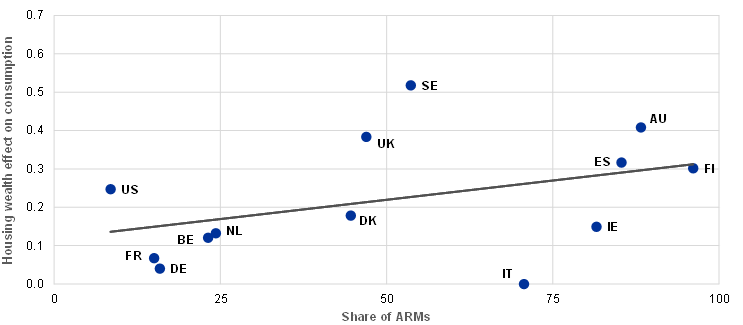
Sources: OECD, Badarinza et al.*), Corsetti et al.**) and ECB calculations.
Notes: The peak effect on consumption is normalised by the peak effect on house prices. The latest observations for the housing wealth effects are for the first quarter of 2022. The set of countries depends on data availability. Panel a: the latest observations for share of homeowners with mortgages are for 2020 or earlier. Panel b: the latest observations for the share of ARMs are for 2013.
*) Badarinza, C., Campbell, J.Y. and Ramadorai, T., “What Calls to ARMs? International Evidence on Interest Rates and the Choice of Adjustable-Rate Mortgages”, Management Science, Vol. 64, No 5, 2018, pp. 1975-2471.
**) Corsetti, G., Duarte, J.B. and Mann, S., “One Money, Many Markets”, Journal of the European Economic Association, Vol. 20, Issue 1, 2022, pp. 513-548.
Compared with previous hiking cycles, the collateral and cash-flow channels may amplify the transmission of monetary policy in the euro area via the housing market. Overall, these findings contribute to the ongoing discussion about the transmission of monetary policy by highlighting the crucial role of the collateral and cash-flow channels.[14] In relative terms, the larger euro area countries lie at the lower end of the distribution in terms of the shares of homeowners with mortgages and levels of household debt (Chart C), thus signalling a weaker housing wealth channel coming from indebted households. Looking at the patterns across time, the share of ARMs in the euro area has declined in the last decade, especially in countries with high such shares.[15] At the same time, the shares of homeowners with mortgages and the levels of household debt are higher now than during previous hiking cycles in many countries. In aggregate, the increase is modest, and countries have increasingly come to resemble each other (Chart D). Thus, monetary policy transmission through the housing channel might be somewhat stronger and more even across countries than in past hiking cycles. This finding is also in line with analysis of the effect of monetary policy shocks on housing investment in the United States and the euro area, pointing to a stronger effect in jurisdictions with higher levels of household debt.[16]
Chart D
Changes in shares of homeowners with mortgages and levels of household debt in the euro area
a) Share of homeowners with mortgages
(percentages)

b) Level of household debt
(percentages of GDP)

Sources: European Union Statistics on Income and Living Conditions and BIS.
Notes: The set of countries depends on data availability. Panel a: the latest observations are for 2022, or 2021 where 2022 not available. Panel b: the latest observations are for the first quarter of 2022. Data source chosen for consistency with analysis reported in Charts B and C.
A modified unit root test following the approach in Pavlidis, E. et al., “Episodes of Exuberance in Housing Markets: In Search of the Smoking Gun”, The Journal of Real Estate Finance and Economics, Vol. 53, Issue 4, 2016, pp. 419-449, is one possible test of exuberance in real house price growth. Updated estimates are provided by the Federal Reserve Bank of Dallas.
Based on analysis published in the box entitled “Drivers of rising house prices and the risk of reversals”, Financial Stability Review, ECB, May 2022, using similar data and models.
For an overview of the global monetary policy stance, see the CFR Global Monetary Policy Tracker. For an analysis on how euro area households’ perceptions of housing as a good investment have dropped recently, driven mainly by expectations of higher mortgage interest rates, see the box entitled “Why has housing lost its lure? Evidence from the ECB’s Consumer Expectations Survey”, Economic Bulletin, Issue 5, ECB, 2023.
See Iacoviello, M., “House Prices, Borrowing Constraints, and Monetary Policy in the Business Cycle”, American Economic Review, Vol. 95, No 3, 2005, pp. 739-764; Iacoviello, M. and Neri, S., “Housing Market Spillovers: Evidence from an Estimated DSGE Model”, American Economic Journal: Macroeconomics, Vol. 2, No 2, 2010, pp. 125-164; Gerali, A., Neri, S., Sessa, S. and Signoretti, F.M., “Credit and Banking in a DSGE Model of the Euro Area”, Journal of Money, Credit and Banking, Vol. 42, Issue s1, 2010, pp. 107-141.
The intertemporal substitution channel means that, for example, rising interest rates incentivise agents to shift resources available today into savings, in order to increase consumption tomorrow.
See Corsetti, G., Duarte, J.B. and Mann, S., “One Money, Many Markets”, Journal of the European Economic Association, Vol. 20, Issue 1, 2022, pp. 513-548; Calza, A., Monacelli, T. and Stracca, L., “Housing finance and monetary policy”, Journal of the European Economic Association, Vol. 11, Issue s1, 2013, pp. 101-122.
See Gelos, R.G., Mancini Griffoli, T., Narita, M., Grinberg, F., Rawat, U. and Khan, S., “Has Higher Household Indebtedness Weakened Monetary Policy Transmission?”, IMF Working Papers, No 2019/011, International Monetary Fund, 2019. For an analysis of Swedish data, see Di Casola, P. and Iversen, J., “Monetary policy with high household debt and low interest rates”, Staff Memo, Sveriges Riksbank, October 2019, and Stockhammar, P., Strid, I. and Tornese, T., “How has the impact of the policy rate on consumption changed when the debt-to-income ratio has risen?”, Economic Commentary, No 9, Sveriges Riksbank, 2022.
House price data are taken from the database constructed by the Federal Reserve Bank of Dallas. For a description of the dataset, see Mack, A. and Martínez-García, E., “A Cross-Country Quarterly Database of Real House Prices: A Methodological Note”, Working Paper Series, No 99, Globalization and Monetary Policy Institute, Federal Reserve Bank of Dallas, 2011. We selected all the advanced economies in the database apart from Switzerland, due to shorter data availability, and Luxembourg, due to its special nature.
Data on consumption and consumer prices are from the OECD. Data on credit to households and real effective exchange rate are from the BIS. The shadow rate is a measure of the monetary policy stance when interest rates are near the zero lower bound. Krippner’s shadow rate is based on a term structure model; see Krippner, L., “Measuring the stance of monetary policy in zero lower bound environments”, Economics Letters, Vol. 118, Issue 1, 2013, pp. 135-138.
Where not available, we use the short-term government bond rate (for Sweden).
For all the countries except the United States, we also include a foreign variable block as block exogenous, in order to capture the influence of foreign factors for small open economies. For the foreign block, we consider an average of US and euro area variables or alternatively only US data, depending on the trade relationships of each small open economy. In addition, for the large euro area countries (Germany, Spain, France and Italy), we include the aggregate euro area GDP and consumer prices as an endogenous block to take into account the role of large euro area countries for the aggregate, reflecting Ciccarelli, M., Kuik, F. and Martínez Hernández, C, “The asymmetric effects of weather shocks on euro area inflation”, Working Paper Series, No 2798, ECB, 2023. The importance of accounting for the foreign block in VAR models of small open economies is shown, among others, in Corbo, V. and Di Casola, P., “Drivers of consumer prices and exchange rates in small open economies”, Journal of International Money and Finance, Vol. 122, 2022.
For shock identification, we use zero and sign short-run restrictions and the Max Forecast Error Variance (FEV) approach, extending the methodology set out in Calza, A. et al., op. cit. and Nocera, A. and Roma, M., “House prices and monetary policy in the euro area: evidence from structural VARs”, Working Paper Series, No 2073, ECB, 2017. The Max FEV approach was originally proposed in Uhlig, H., “What moves real GNP?”, mimeo, 2003. Both the housing demand shock and the mortgage supply shock are assumed to affect consumption, consumer prices and the interest rate with a lag. While the mortgage supply shock is assumed to generate co-movement between house prices and credit to households, the housing demand shock is assumed to be the shock that explains most of the forecast error variance decomposition (FEVD) of house prices at short horizons. The monetary policy shock is assumed to affect consumption and consumer prices with a lag. Moreover, a rise in interest rates is assumed to generate a drop in real house prices and credit to households and to strengthen the local currency.
Data are based on new mortgages, based on Badarinza, C., Campbell, J.Y. and Ramadorai, T., “What Calls to ARMs? International Evidence on Interest Rates and the Choice of Adjustable-Rate Mortgages”, Management Science, Vol. 64, No 5, 2018, pp. 1975-2471. For evidence on the drivers of the share of ARMs in the euro area, see Albertazzi, U., Fringuellotti, F. and Ongena, S., “Fixed Rate versus Adjustable Rate Mortgages: Evidence from Euro Area Banks”, Research Paper Series, No 20-99, Swiss Finance Institute, 2023. For further analysis on how the share of ARMs and the debt burden affect consumer expectations in times of monetary policy tightening, see also the box entitled “Consumers’ interest rate expectations in a monetary policy tightening cycle”, Economic Bulletin, Issue 5, ECB, 2023.
For example, Sveriges Riksbank used the presence of higher levels of household debt in its monetary policy communication in September 2022 to argue that less monetary policy tightening is needed than in the past to achieve the same effect on the economy. By contrast, in June 2023 the Bank of England used the argument of the greater share of fixed-rate mortgages in the United Kingdom to explain why the full impact of the increase in the Bank Rate to date would not be felt for some time.
See Lane, P.R., “The euro area hiking cycle: an interim assessment”, Dow Lecture at the National Institute of Economic and Social Research, 16 February 2023.
See the box entitled “Monetary policy and housing investment in the euro area and the United States”, Economic Bulletin, Issue 3, ECB, 2023.