


The role of supply and demand in the post-pandemic recovery in the euro area
The role of supply and demand in the post-pandemic recovery in the euro area
Published as part of the ECB Economic Bulletin, Issue 4/2023.
1 Introduction
This article assesses the factors that caused the sharp decline in economic activity in the euro area in 2020 and shaped the subsequent economic recovery. The widespread lockdowns which began in March 2020, implemented to contain the spread of the coronavirus (COVID-19) pandemic, caused global supply disruptions and suppressed demand. As a result, euro area output dropped and international trade plummeted. The euro area economy recovered solidly after the first strict lockdowns were lifted in 2020, despite the adverse shocks in 2021 and 2022 associated with global supply bottlenecks, the energy crisis and the uncertainty generated by Russia’s invasion of Ukraine. Euro area GDP fell by 6.1% in 2020, before rebounding by 5.3% in 2021 and further increasing by 3.5% in 2022. By the end of 2022 output in the euro area was 2.4% above its pre-pandemic level, but 0.9 percentage points below its extrapolated pre-pandemic linear trend, largely thanks to strong policy support (Chart 1, panel a). The developments at sectoral level have been heterogenous. Services were mainly affected by the various containment measures, which led to a delayed recovery in services activity in 2021 (Chart 1, panel b). Industrial and construction production have been also constrained by supply chain disruptions, energy shocks and labour shortages, although the former two factors have recently eased significantly.
Chart 1
Real GDP – breakdown by demand components and sectoral value added
(index: Q4 2019 = 0, percentages and percentage point contributions)
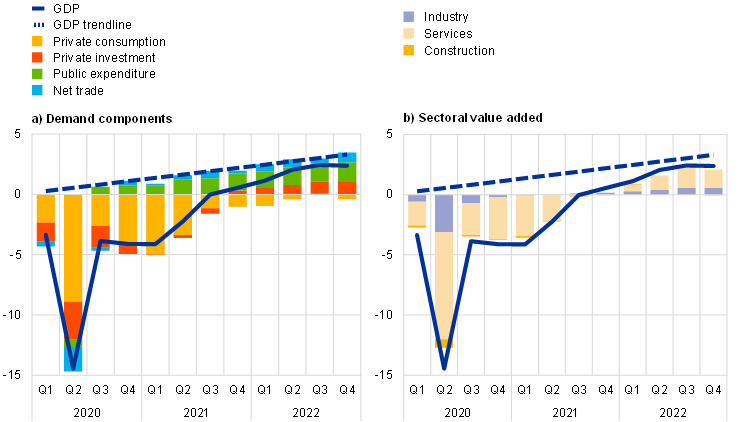
Sources: Eurostat and ECB calculations.
Notes: The pre-COVID-19 deterministic trend is estimated by regressing the log of real GDP on a constant and a linear trend over the period from the first quarter of 1999 to the fourth quarter of 2019. Given the disproportionate impact of highly volatile transactions in intangible assets in Ireland on euro area investment and imports (see footnote 2), euro area private investment has been depicted excluding investment in intellectual property products in Ireland, while imports are shown after netting out services imports in Ireland. Public expenditure includes government consumption and government investment. Industry excludes construction value added in panel b). Owing to statistical differences between GDP and total gross value added, contributions from industry, services and construction do not add up to total GDP in panel b).
Since 2020 activity in the euro area has been shaped by three key exogenous factors: the reopening of the economy following the lockdowns (supported by fiscal policies), global supply disruptions and Russia’s war in Ukraine. After the first strict lockdowns were eased in May 2020, output rose immediately and the economy largely reopened. Demand also partially recovered, supported by considerable monetary and fiscal stimuli, although remaining containment measures and health concerns continued to restrict consumption possibilities. Subsequently, with the changing epidemiological situation, containment policies varied across the world and measures in different countries were strengthened or relaxed in an unsynchronised way. This, together with the shortages resulting from the misplacement of cargo containers globally, contributed to additional unexpected and abrupt bottlenecks in global supply chains. Rising geopolitical tensions in the autumn of 2021 and Russia’s invasion of Ukraine in February 2022 caused a surge in energy prices and amplified the ongoing supply disruptions, while also contributing to a jump in economic uncertainty with negative implications for domestic activity.
This article analyses the magnitude and channels through which the above three factors have affected demand and production. Section 2 looks at the demand composition of GDP, focusing on the main factors that shaped the dynamics of household income, savings, consumption and investment. Section 3 analyses the production side, focusing on those sectors most affected by the supply bottlenecks and energy shocks. The article also compares the post-pandemic economic recoveries in the euro area and the United States (Box 1), discusses the role of fiscal policy in shaping the business cycle in 2021 and 2022 (Box 2) and offers an assessment of the relative significance of the different shocks that have characterised the post-pandemic recovery using a structural empirical model (Box 3). While monetary policy supported the economic recovery in 2021-22, a detailed analysis of its impact is beyond the scope of this article.[1] Section 4 concludes.
2 The role of demand
The recovery of aggregate demand has not been uniform across components. Private consumption was negatively affected by the waves of restrictions imposed to contain the spread of the pandemic, which resulted in strongly negative demand shocks in 2020 (Box 3). The recovery in private consumption was relatively slow and it did not return to its pre-pandemic level until the third quarter of 2022, i.e. four quarters after real GDP. This was, in part, because the pandemic re-occurred over several waves, with the related containment measures and health concerns restricting consumption possibilities. By contrast, public consumption and public investment supported the recovery in GDP immediately, exceeding their pre-pandemic level from the third quarter of 2020 and continuing to grow thereafter. This reflected the pandemic and energy-related support provided between 2020 and 2022 (Box 2). Housing investment also recovered relatively quickly, already exceeding its pre-pandemic level by the end of 2020. By contrast, private non-construction investment plummeted during the first wave of the pandemic and, despite the subsequent rebound, did not recover until the fourth quarter of 2021. Net exports (abstracting from the volatility related to intangible asset transactions in Ireland) also plunged during the initial lockdowns in 2020. However, the net trade component of euro area GDP recovered swiftly thereafter, already exceeding its pre-pandemic level in the fourth quarter of 2020, as exports rebounded more strongly than imports (Chart 1, panel a).[2]
Developments in private consumption lagged behind the resilience shown by aggregate disposable income. Real disposable income has been strongly supported by job retention schemes since 2020. The strong fiscal policy support deployed by euro area governments during the pandemic mitigated risks for entrepreneurs and employees, and prevented widespread bankruptcies. Although compensation of employees slumped in 2020 (Chart 2), overall this was more than buffered by fiscal support, with the implemented measures, such as job retention schemes, resulting in a strongly positive contribution to disposable income of direct taxes, social contributions and transfers (Box 2). In addition, ECB monetary policy action at the time supported favourable financing conditions. Labour compensation recovered strongly in 2021-22 and was the main contributor to growth in real disposable income in these two years.[3] From mid-2021 the resulting impetus to consume was partly offset by the surge in energy prices, which made a strong negative contribution to real disposable income growth in 2022 via a deterioration in the terms of trade.[4] However, its negative impact on spending was buffered by a gradual (albeit incomplete) unwinding of the previously exceptionally high saving flows, together with the positive developments in labour and non-labour income. The pandemic restrictions, coupled with policy support for incomes, resulted in an unprecedented increase in household savings to 25% of disposable income in the second quarter of 2020.[5] Although it fell back from its peak thereafter, the saving ratio has remained above its pre-pandemic level, resulting in an accumulation of “excess” savings amounting to around €930 billion by the fourth quarter of 2022, or about 11.4% of annual disposable income. However, these pandemic savings have been accumulated mostly in illiquid assets, are concentrated among wealthier households and have been partly eroded in real terms by the recent high inflation. These factors are all likely to limit the support stemming from these accumulated savings to consumption growth.[6]
Chart 2
Real disposable income components and real consumption
(index: Q4 2019 = 0, percentages and percentage point contributions)
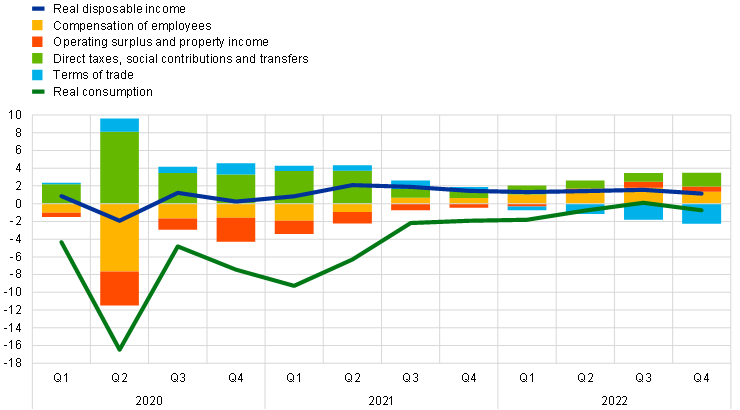
Sources: Eurostat and ECB calculations.
Notes: Disposable income is deflated with the private consumption deflator, whereas its components are deflated with the GDP deflator. “Terms of trade” are calculated as the ratio of GDP to the private consumption deflators. The latest observations are for the fourth quarter of 2022.
Across components, consumption of services, in particular contact-intensive activities such as travel, accommodation and food services, played a key role during the pandemic and its aftermath. Demand for contact-intensive services contributed strongly to the drop in consumption in the acute phases of the pandemic and to its subsequent recovery.[7] Services consumption returned to its pre-pandemic level only in the third quarter of 2022 (Chart 3). The consumption of durable goods, which is typically pro-cyclical and highly volatile, rebounded quickly after the lockdowns, but was affected by tight global supply constraints in 2021-22. Meanwhile, expenditure on non-durable and semi-durable goods suffered less than that on services during the pandemic and had already recovered to pre-pandemic levels by mid-2021. However, consumption of non-durable and semi-durable goods was hit by the repercussions of Russia’s invasion of Ukraine, with the ensuing high energy and food inflation contributing to a decline in this expenditure component over 2022.
Chart 3
Private consumption components
(index: Q4 2019 = 0, percentages and percentage point contributions)
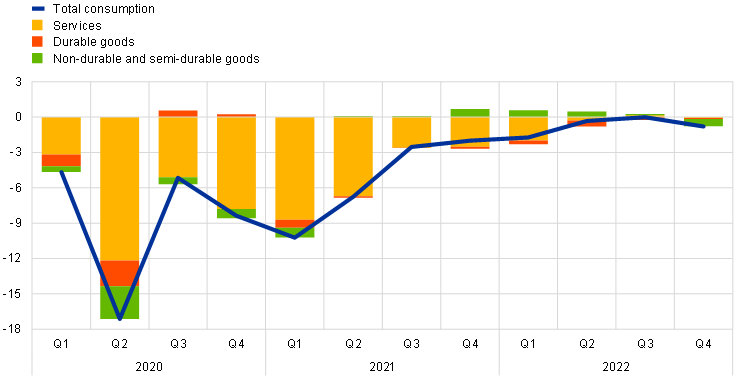
Sources: Eurostat, European Commission (DG ECFIN) and ECB calculations.
Note: The latest observations are for the fourth quarter of 2022.
During the post-pandemic reopening phase, private consumption growth was held back by the rising energy prices, increasing uncertainty and stricter financing conditions, including higher interest rates.[8] The surge in energy costs following Russia’s invasion of Ukraine translated into a jump in consumer uncertainty and price expectations, and a steep drop in consumer confidence, which reached extremely low levels in September 2022 (Chart 4). While consumer uncertainty has moderated since October 2022, it has remained elevated from a historical perspective, and its detrimental economic impact was significant in 2022.[9] With fading concerns related to the supply of gas and declining energy prices, consumer confidence started to improve, albeit still remaining at a low level, and the consumer price trend expectations declined to below its historical average level in early 2023. Nevertheless, private consumption growth has been increasingly affected by the ongoing tightening of monetary policy and the related stricter financing conditions.
Chart 4
Consumer confidence, uncertainty and price expectations
(standardised percentage balances)
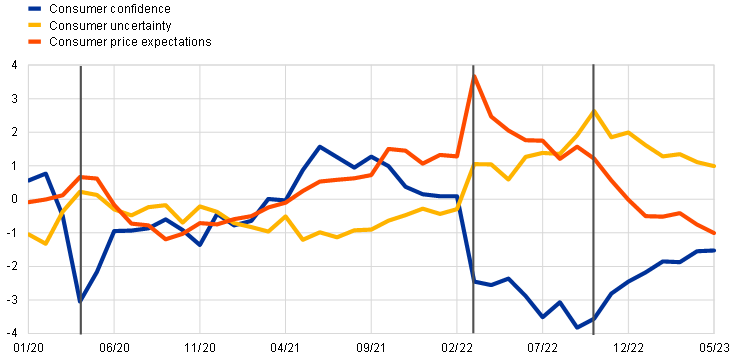
Sources: European Commission (DG ECFIN) and ECB calculations.
Notes: Consumer confidence and price expectations standardised over 1985-2019, consumer uncertainty standardised over April 2019-May 2023. The vertical lines mark turning points in April 2020, March 2022 and October 2022. The latest observations are for May 2023.
Turning to investment, the initial strong rebound of the residential component reflected pandemic-specific needs and the favourable financing environment. Households have also allocated a small part of their above-trend savings to capital formation since the beginning of 2021.[10] However, the spike in uncertainty and the gradual tightening of financing conditions in the course of 2022 resulted in increasingly steep moderation in housing investment activity (Chart 5, panel a).[11] By contrast, euro area non-construction investment, which dropped during the pandemic, took longer to recover in its aftermath. While its rebound has been significant, this has varied considerably across countries, firms and types of investment, and has been weaker in the euro area than in the United States (Box 1).[12] While the recovery of non-construction investment was also helped by substantial policy support, headwinds such as increased uncertainty, energy cost rises and supply bottlenecks induced a relatively high level of savings by companies and delayed investment decisions (Chart 5, panel b). Nevertheless, strengthened structural trends since the pandemic, including the further digitalisation and greening of the euro area economy, with the Next Generation EU (NGEU) funds acting as a catalyst, have recently supported growth in non-construction investment demand.
Chart 5
Investment growth decomposition and key factors
a) Decomposition
(quarter-on-quarter percentage changes and percentage point contributions)
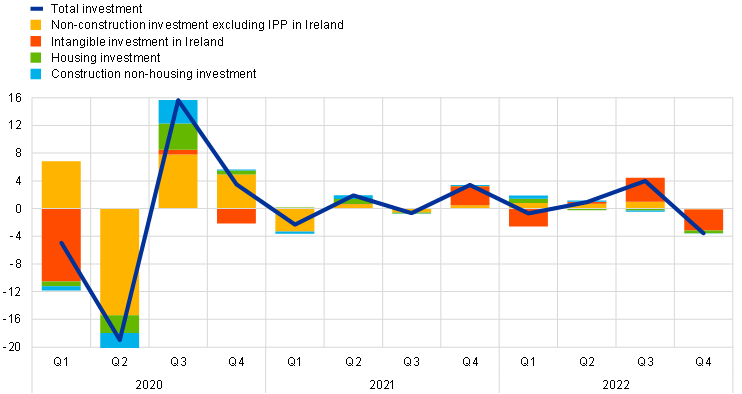
b) Key factors
(percentage points)
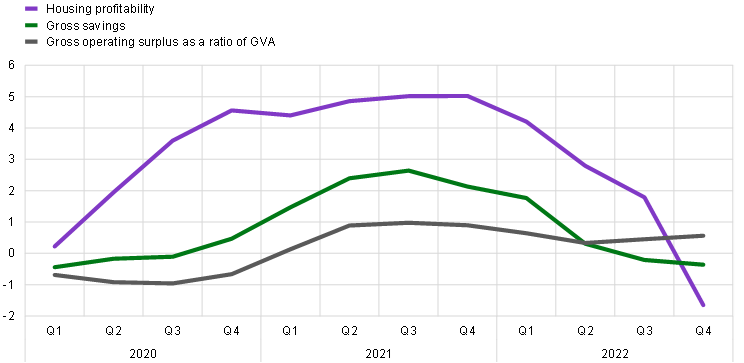
Sources: Eurostat and ECB calculations.
Notes: In panel b), Housing profitability is the ratio of the residential property price index and the housing investment deflator, scaled to zero in the fourth quarter of 2019. Gross savings represent the retained earnings by non-financial corporations (NFCs) divided by the sector-specific gross value added. Gross savings and the Gross operating surplus (and mixed income) of NFCs as a ratio of sector-specific gross value added (GVA) are shown as differences (in percentage points) from the historical averages over 2015-19, at 24.2% and 40.2% respectively. The latest observations are for the fourth quarter of 2022.
The net export component of GDP recovered swiftly as manufacturing exports rebounded strongly, while import growth was more contained. While the export of services, in particular tourism, benefited from the subsequent easing and eventual elimination of pandemic-related restrictions, momentum on the goods side moderated in 2021 as supply bottlenecks hit key export industries and was further held back in the first half of 2022 with the intensification of supply constraints. Supply chain disruptions eased in the second half of 2022, but euro area export growth remained subdued as global demand weakened. Import growth was supported by restocking in 2021-22 and energy stockpiling in 2022 amid heightened uncertainty about future energy prices and availability. Overall, abstracting from some volatility at the quarterly level, net trade contributed increasingly positively to the level of GDP in 2021-22.
Box 1
A comparison of economic developments in the euro area and the United States since the pandemic
Prepared by Malin Andersson, Ryan Minasian and Michel Soudan
This box compares the post-pandemic economic recoveries in the euro area and the United States. Output contracted more strongly in the euro area than in the United States during the pandemic (Chart A). The earlier onset of the pandemic by a couple of weeks, the more severe lockdowns and the later availability of vaccines were important factors behind the stronger decline in GDP in the euro area in 2020. However, differences in economic structures, growth potential[13] and policy responses also played a role.[14] Both regions provided ample monetary policy stimulus from the start of the pandemic. Very strong fiscal support directed primarily at households in the United States led to high demand for consumer goods and a substantial positive output gap.[15] While there were also significant discretionary fiscal support measures in the euro area in 2020 (Box 2), these were smaller than in the United States. They were also more targeted and directed more at supporting employment through job retention schemes.[16] This led to a much larger contraction in private consumption in the euro area than in the United States in 2020 and a weaker boost in 2021. The euro area also saw a more pronounced decline in investment in 2020 following the more extensive lockdowns and reduced mobility along with the stronger fall in output. Meanwhile, a negative net trade contribution in the United States in 2021 resulted from imports driven by domestic demand (enabled by the rundown of excess savings) and weak services exports, notably tourism. By contrast, more modest imports and a rebound in goods exports led to a positive trade contribution in the euro area in 2021.
Chart A
Real GDP growth in the euro area and the United States from 2019 to 2022
(left-hand scale: annual percentage changes and percentage point contributions; right-hand scale: index: 2019 = 100)
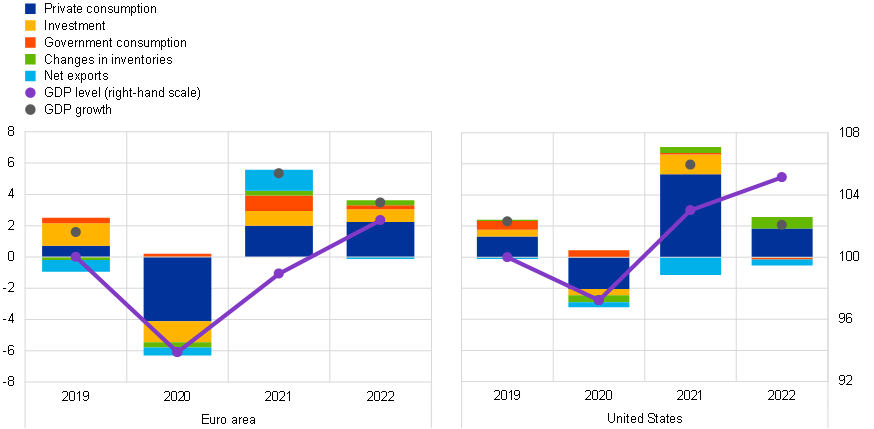
Sources: Eurostat and ECB calculations.
The return to pre-pandemic levels of output took longer in the euro area than in the United States, with real GDP reaching its pre-pandemic level in the third quarter of 2021 in the euro area, while US output had already recovered in the first quarter of 2021 (Chart A). Following similar real GDP growth rates in 2021, euro area GDP growth in 2022 exceeded that of the United States. In 2022 euro area growth was boosted by the reopening of the services sector, fading supply side constraints in the manufacturing sector and fiscal support. Euro area activity was, however, gradually dampened by adverse repercussions related to the proximity of Europe to Russia’s war in Ukraine, its high dependence on energy imports from Russia, the resulting energy crisis (which pushed up inflation), terms of trade losses and weakening demand. Meanwhile, tightening financial conditions and waning fiscal support took their toll on US growth. Since the start of the monetary policy tightening cycle, ten-year government bond yields have risen notably in both jurisdictions. However, this has triggered a stronger fall in residential investment in the United States, which has been found to be more sensitive to interest rates than the euro area owing to continued high house prices.[17]
Box 2
The impact of discretionary fiscal policy measures on real GDP growth from 2020 to 2022
Prepared by Cristina Checherita-Westphal
This box summarises the discretionary response of fiscal policy in the euro area from the start of the pandemic crisis in early 2020 to 2022 and its impact on real GDP growth by means of model simulations.[18] It focuses on the typical fiscal policy instruments that have a direct impact on the budget balance. In addition, euro area governments granted various forms of liquidity support to companies, including large-scale guarantee programmes. Finally, automatic stabilisers also played an important role in income and output dynamics in 2020.[19]
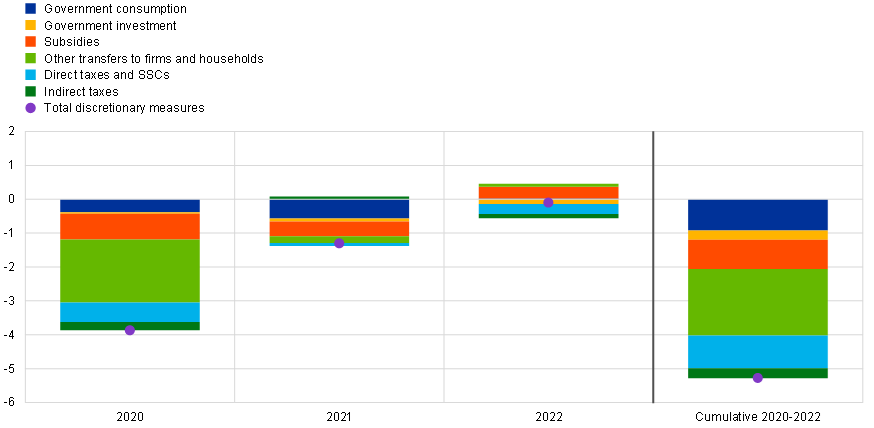
The discretionary reaction of fiscal policy in the euro area over the period 2020-22 was significant and persistent (Chart A). Compared with the pre-pandemic period (2019), cumulative discretionary fiscal stimulus measures with an impact on the budget balance are estimated to have amounted to about 5.3% of GDP at the end of 2022. In 2020 euro area governments responded to the COVID-19 crisis with various stimulus measures estimated to amount to close to 4% of GDP. These measures were directed in particular at protecting employment through job retention schemes, but also at funding increased health spending, while direct cash support to households and other similar transfers or public investment were relatively limited. In 2021 additional measures amounting to about 1.3% of GDP were approved to support the economic recovery from the pandemic, including those funded at EU level through the Next Generation EU (NGEU) programme.[20] In 2022 the level of support remained broadly unchanged compared to 2021 – some pandemic-related measures started to be withdrawn, but new fiscal support measures were introduced in response to the energy crisis and war-related spending.
In terms of fiscal instruments, in 2020 the stimulus was mainly focused on transfers to firms and households, including subsidies, as well as other support for job retention schemes, such as relief on social security contributions (SSCs) and direct taxes. Government consumption, mainly in the form of health-related spending, also played an important role in 2020. Over the period 2021-22 stimulus measures financed through the NGEU ‒ predominantly government investment and other capital support for firms – complemented the previously granted fiscal support. Finally, in 2022 reductions in indirect taxes, particularly energy taxes, became more prevalent as a response to the energy crisis. Subsidies decreased in net terms compared with 2021, mainly reflecting the end of the COVID-19 crisis and the partial withdrawal of the pandemic recovery measures. However, the share of overall subsidies directly linked to energy price relief increased in response to the surge in wholesale gas and electricity prices.
Chart A
Proxy for discretionary fiscal policy measures over the period 2020-22 and their composition by programme and fiscal instrument
a) Discretionary measures by programme
(percentages of potential GDP, fiscal support in annual changes unless otherwise indicated)
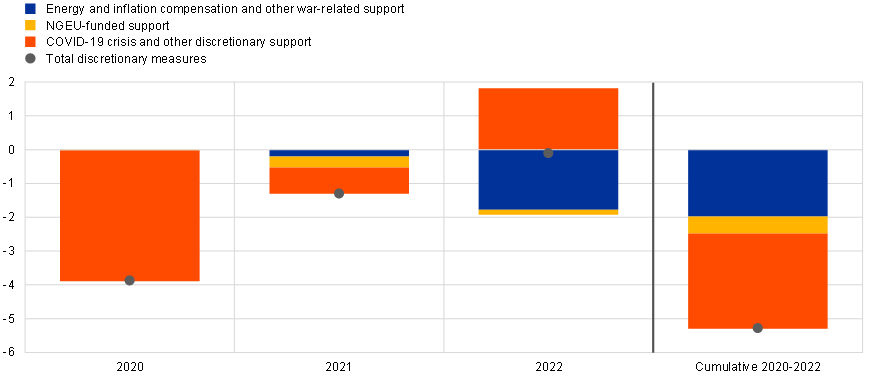
b) Discretionary measures by instrument
(percentages of potential GDP, fiscal support in annual changes unless otherwise indicated)
Sources: Eurosystem and ECB calculations.
Notes: ECB staff calculations based on the assessment of measures as per the December 2022 Eurosystem staff macroeconomic projections database. Negative numbers denote fiscal stimulus (loosening); positive numbers denote fiscal tightening or withdrawal of previous stimulus. The bars depict the marginal fiscal support (i.e. fiscal support in annual changes divided by the nominal potential GDP of the previous year), apart from those labelled “cumulative”, which capture the total discretionary fiscal support (sum of ratios) over 2020-22. A calculation of the marginal fiscal support as a percentage of nominal GDP would indicate a slightly higher stimulus in 2020. The proxy shown in this chart includes only fiscal policy measures with an impact on the budget balance.
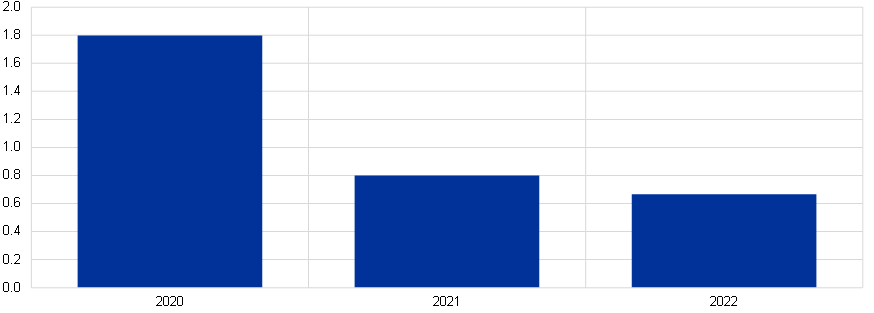
The discretionary fiscal policy measures estimated above significantly cushioned the fall in GDP in 2020 and supported the recovery over 2021-22 (Chart B). Cumulatively, the measures are estimated to have increased real GDP in the euro area over the period 2020-22 by about 3.3% compared with a counterfactual scenario with no fiscal policy support. At about 0.6, the implied fiscal multiplier of the entire fiscal package over 2020-22 mainly reflects the composition of measures, with a large part of the support taking the form of broad-based transfers and subsidies, which have a relatively low multiplier in the models. Nevertheless, as mentioned above, these effects reflect only the discretionary stimulus measures with a direct budgetary impact, and thus do not cover the indirect effects of liquidity support and automatic stabilisers.
Chart B
Impact of discretionary fiscal policy measures on real GDP growth over the period 2020-22
(percentage points, deviation from a counterfactual scenario with no fiscal policy support)
Sources: Eurosystem, ECB and ECB calculations.
Note: ECB staff calculations are based on average simulation results from a number of ECB and Eurosystem staff macroeconomic models used in the context of the December 2022 Eurosystem staff macroeconomic projections and earlier vintages.
3 The role of supply
The evolution of pandemic restrictions and related policy responses shaped the dynamics of services and industrial production in 2020 and 2021. Services and manufacturing activity were severely restrained during the lockdowns, while policy measures prevented widespread bankruptcies and job losses, and reduced entrepreneurial financial risks. Particularly contact-intensive activities, such as trade, transport, accommodation, and food services, contributed significantly to the waves of decline and recovery in services production in 2020-21. Overall, the rebound in services production was initially much more muted relative to that in manufacturing production owing to repeated restrictions aimed at containing new waves of the pandemic (Chart 6).
Chart 6
Industrial and services production
(index: December 2019 = 0)

Sources: Eurostat and ECB staff calculations.
Note: The latest observations are for February 2023 for services production and March 2023 for industrial production and its components.
Euro area industrial production has been negatively affected during the post-pandemic recovery by global supply chain disruptions and the rise in energy prices. After the rapid recovery in the summer of 2020, industrial production stagnated in 2021 owing to the output drop in the capital goods sector and, after some positive developments around the beginning of 2022, stagnated again over the remaining period owing to the fall in activity in the intermediate goods and energy sectors. The drag from supply bottlenecks caused by shortages of materials and then from energy prices were the main factors behind these developments. Conversely, consumer goods and services production recovered steadily as the epidemiological situation improved and containment policies were relaxed.
Labour shortages have particularly affected the production of the service sectors during the recovery phase. Since the summer of 2021, labour has been perceived as a limiting factor, in particular for activity in more contact-intensive services, such as the accommodation and food and beverage subsectors. Unlike the manufacturing sector, the services sector did not experience shortages of materials in 2021 and 2022, but it was more sensitive to pandemic-related constraints. More recently, however, shortages of materials are also perceived as an increasingly limiting factor for services.
Disruptions to goods supply chains started weighing on the euro area economy following the outbreak of the pandemic and since late 2020, after the lifting of the first lockdowns (Box 3). On the supply side, the lockdowns in March and April 2020 can be interpreted as disruptions to the supply chains of businesses. Subsequently, supply bottlenecks stemmed from the interplay of three main factors. First, a shortage of microchips and other components to assemble goods affected key manufacturing sectors, such as automotive producers. Second, restrictions adopted in several countries in the Asia-Pacific region to contain the pandemic caused a drop in exports of key goods. Third, disruptions to container vessel activities lengthened the arrival times of key intermediate inputs, further exacerbating supply bottlenecks.[21] The capital goods sector was adversely affected by supply bottlenecks, which caused a decline in sector output during the course of 2021 (Chart 7), while other manufacturing activities registered positive growth over the same period. Within the capital goods sector, vehicle production, which has one of the longest supply chains across manufacturing sectors, was severely affected by the supply bottlenecks.[22] The vehicle sector almost halted in March and April 2020, dropped by about 50% in the first half of 2021 and then fluctuated heavily before returning to growth in March 2022 as supply disruptions started to dissipate. The impact of supply chain disruption shocks on the automotive sector was very strong. The shortage of microchips and other components needed to assemble new motor vehicles led to an unprecedented reduction in supply in the period 2020-22. The energy-intensive sector was also adversely affected by supply chain bottlenecks, but to a much lesser extent.
Chart 7
Euro area production in the capital goods, vehicle and energy-intensive sectors
(index: December 2019 = 100)
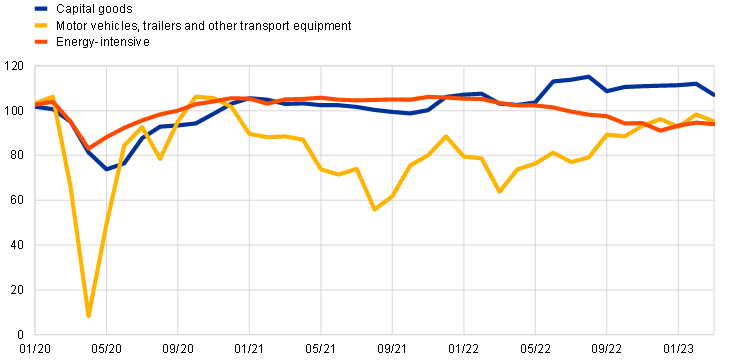
Sources: Eurostat, ECB and ECB staff calculations.
Notes: The energy-intensive sector is defined by aggregating the production of chemicals, chemical products and basic metals, which account on average for about 10% of euro area industrial production. Time-varying weights are used to construct the index. Capital goods are shown as three-month moving averages. The latest observations are for March 2023.
Supply factors explain a large portion of the increase in the time taken to deliver finished and intermediate goods in the euro area. The Purchasing Managers’ Index (PMI) suppliers’ delivery times index shows the percentage of companies reporting an improvement, deterioration or no change in delivery times for intermediate and finished goods. It captures the extent of supply chain delays in an economy. Readings of 50 indicate no change in delivery times relative to the preceding month, readings above 50 indicate that delivery times have improved (become shorter or faster) and readings below 50 indicate that delivery times have deteriorated (become longer or slower). The PMI suppliers’ delivery times index fell sharply in March and April 2020, swiftly reverted to its trend by the summer 2020, fell again up to mid-2021, recovered slowly until mid-2022, before finally improving quickly. A model-based analysis shows that supply shocks, particularly the supply chain disruption shocks, were largely responsible for the fall in the indicator (Chart 8).[23] In addition, the pandemic-driven rotation of demand away from services towards goods also contributed to the lengthening of delivery times by mid-2021. At the beginning of 2023 the PMI suppliers’ delivery times index (in a deviation from its trend) turned positive, mainly driven by improvements on the supply side. This is corroborated by the ECB’s regular survey of contacts in the corporate sector, which indicated that supply issues had eased significantly by early 2023.[24]
Chart 8
Supply chain pressures in the euro area – factor contributions to the PMI manufacturing suppliers’ delivery times index
(diffusion index, deviation from stochastic trend)
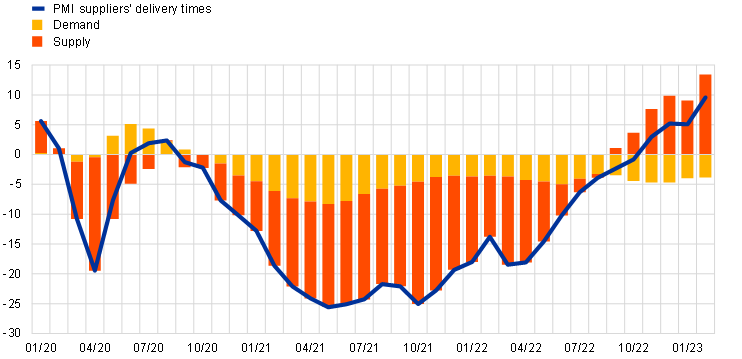
Sources: Eurostat, S&P Global and ECB staff calculations.
Notes: For details of the underlying models, see the box entitled “Sources of supply chain disruptions and their impact on euro area manufacturing”, Economic Bulletin, Issue 8, ECB, 2021. The latest observations are for February 2023.
The surge in energy prices since the autumn of 2021 is another adverse supply force which has constrained output, in particular industrial production, owing to the higher energy use in manufacturing relative to services.[25] Gas supplies from Russia to the European Union were cut significantly at the beginning of autumn 2021, contributing to the sluggish replenishment of gas inventories in Europe ahead of the 2021/22 winter season. At the end of February 2022 Russia invaded Ukraine, which caused an additional and sudden surge in energy prices. The energy crunch led to a significant decline in the production of chemicals and basic metals, which are relatively energy-intensive sectors (Chart 7). In the acute phase of the energy crisis, from October 2021 to October 2022, euro area consumer energy prices increased by 49.5% and euro area industrial production excluding construction grew by 3%, while the output of the energy-intensive sectors, such as chemicals and basic metals, dropped by 10.2% (Chart 8). After the energy price trend reversed, euro area consumer energy prices decreased by 8.8% between October 2022 and February 2023. Over the same period, euro area industrial production excluding construction grew by 2.4%, and the output of the energy-intensive sectors first stabilised and then began to grow, increasing by 0.6% overall. The surge in energy prices recorded between the autumn of 2021 and October 2022 is mainly attributable to adverse supply forces, which undermined economic activity (Box 3).
Box 3
A model-based assessment of the drivers of economic activity
Prepared by Roberto A. De Santis
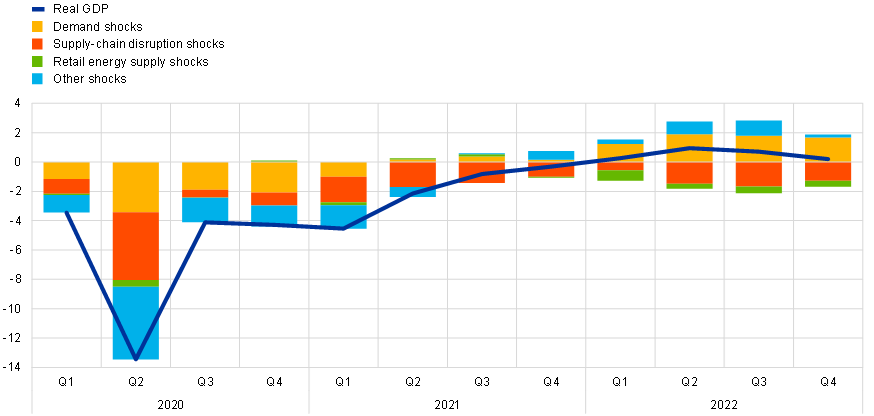
A model-based analysis is used to shed light on the importance of the different factors for GDP growth since the beginning of 2020. A Bayesian structural vector autoregression (SVAR) model is used which disentangles demand, supply chain disruptions and energy supply shocks. The analysis is based on real GDP, motor vehicle output, energy-intensive sector output, the PMI vehicle suppliers’ delivery times index, the Harmonised Index of Consumer Prices (HICP) excluding food and energy, motor vehicle prices, retail energy prices and two-year inflation expectations from the Survey of Professional Forecasters (SPF). Motor vehicle output, the PMI vehicle suppliers’ delivery times index and motor vehicle prices are used to identify supply chain disruption shocks; the energy-intensive sector output and retail energy prices are used to identify retail energy supply shocks; real GDP and HICP excluding food and energy are used to identify aggregate demand shocks. The eight variables of the SVAR are endogenous to the system of equations and the identified shocks therefore affect all variables jointly.
After the drop in demand during the first lockdown, the unwinding of previous negative demand forces in 2021 and positive demand shocks in 2022 strongly supported economic activity. Focusing on the period following the last quarter of 2020, when economic activity rebounded, empirical results suggest that demand forces, driven by the desire of households to normalise consumption after the easing of pandemic-related restrictions and supported by favourable fiscal policies, have contributed positively to economic growth since the start of 2021. As documented in Section 2, the recovery of labour income, supported by fiscal policies, and the normalisation of savings in 2021-22 played a key role in explaining the strength of demand. Our estimates suggest that favourable demand shocks raised real GDP by 3.6% between the fourth quarter of 2020 and the fourth quarter of 2022 (Chart A).
The shock decomposition also highlights the strong negative impact of supply chain disruption shocks since the first lockdown in 2020. Initially, when the first lockdown measures were introduced, the model interprets the temporary closures of businesses as a combination of adverse demand and supply chain disruption shocks. The latter captures the disrupted supply conditions stemming from the strict lockdowns, which contributed to the unprecedent drop in real GDP in the second quarter of 2020. The easing of containment measures in the summer of 2020, allowed production to resume briskly, explaining most of the resilience of economic activity. However, subsequently, the shortage of chips, COVID-19 restrictions in Asia and disruptions in container vessel activities, as well as labour shortages, again negatively affected real GDP. Starting from the end of the third quarter of 2020, the cumulated loss of GDP amounted to 1.1% in the third quarter of 2022 owing to supply chain disruption shocks. This cumulated loss declined to 0.7% by the end of 2022 as these shocks started to ease.
Chart A
Contributions of drivers to real GDP
(percentage deviations from stochastic trend, index: December 2019 = 0)
Sources: ECB, Eurostat and ECB staff calculations.
Notes: The model is based on euro area aggregate data from January 1999 to December 2022. Shocks are identified using the method used in Antolín-Díaz, J. and Rubio-Ramírez, J.F., “Narrative Sign Restrictions for SVARs”, American Economic Review, Vol. 108, No 10, October 2018, pp. 2802-29, but with sign contribution restrictions as in De Santis, R.A. and Van der Veken, W., “Deflationary financial shocks and inflationary uncertainty shocks: an SVAR investigation”, Working Paper Series, No 2727, ECB, September 2022. The assumed sign restrictions at impact are as follows: demand shocks imply core HICP (+), HICP energy (+), real GDP (+) and PMI motor vehicle suppliers’ delivery times index (-); energy supply shocks imply HICP energy (+) and energy-intensive sector production (-); supply chain disruption shocks imply vehicle prices (+), vehicle production (-) and PMI vehicle suppliers’ delivery times index (‑). The assumed narrative restrictions are as follows: the largest contribution to forecast errors in the PMI suppliers’ delivery times index in March-May 2020 is attributed to supply chain disruption shocks; the largest contribution to forecast errors in HICP energy in October 2021, November 2021 and March 2022 is attributed to energy supply shocks. It is also assumed that demand shocks have a negative sign in March and April 2020 and a positive sign in May 2020, March 2021, June 2021 and May 2022. The stochastic trend provides the dynamics of real GDP in absence of shocks.
Adverse energy supply shocks also negatively affected real GDP, albeit to a lesser extent than other supply disruptions. The reduced availability of gas imports from Russia in the autumn of 2021 and Russia’s invasion of Ukraine in February 2022 caused a sharp rise in energy prices owing to the fall in Russian gas supplies to the euro area. The largest negative impact on aggregate economic activity is recorded in March 2022. However, we estimate that the initial adverse impact on real GDP had been partly absorbed by the end of 2022, as energy prices declined rather sharply in the fourth quarter. It is likely that the impact of the energy crunch on aggregate economic activity was mitigated because governments introduced energy subsidies and/or price caps after the surge in wholesale gas and electricity prices to contain the rise in retail energy prices. Finally, other shocks, probably capturing the extraordinary nature of the pandemic-related restrictions, also contributed to the collapse of economic activity in 2020. With the ensuing targeting of restrictions, and learning and behavioural adjustments by firms and households, the adverse effects of these shocks subsided, which supported the economic recovery.
4 Conclusions
The post-pandemic economic recovery in the euro area has been solid, supported by resolute policy responses. Strong fiscal and monetary policy support reduced entrepreneurial risk and prevented widespread bankruptcies and job losses following the outbreak of the pandemic. The resilient labour market supported households’ purchasing power and aggregate demand, and helped the euro area economy weather well the extraordinary adverse supply shocks that have hit it over the past three years.
The economic recovery has been challenged by supply bottlenecks, the energy crunch and heightened uncertainty triggered by Russia’s war in Ukraine. This article shows that supply chain disruptions have been weighing on the euro area economy, although these have been fading since mid-2022. Vehicle production, which has one of the longest supply chains across manufacturing sectors, has been heavily affected by these bottlenecks. In addition, the surge in energy prices since the autumn of 2021 has constrained output, particularly industrial production in 2022, owing to the higher energy intensity of manufacturing relative to services. Finally, heightened uncertainty in the euro area triggered by Russia’s invasion of Ukraine also adversely affected economic activity in 2022. However, the resilient disposable income of households, thanks to policy stimuli and a robust labour market, the boost from the reopening of the economy and the ongoing normalisation of savings have all supported the recovery of aggregate demand. In addition, the adverse supply shocks have largely dissipated lately. Receding energy supply concerns and energy prices have reduced economic uncertainty and improved households’ confidence, albeit from low levels, providing support to economic growth. However, the monetary policy tightening by the ECB and the related stricter financing conditions are likely to dampen consumption spending on durable goods and private investment.
A comprehensive assessment of the role of monetary policy can be found in Lagarde, C., “Monetary policy in the euro area”, Karl Otto Pöhl Lecture, organised by Frankfurter Gesellschaft für Handel, Industrie und Wissenschaft, Frankfurt, 20 September 2022; and Lane, P.R., “The euro area hiking cycle: an interim assessment”, Dow Lecture at the National Institute of Economic and Social Research, London, 16 February 2023. See also the box entitled “The macroeconomic impact of the ECB’s monetary policy tightening since December 2021: a model-based assessment”, Economic Bulletin, Issue 3, ECB, 2023.
Euro area private investment and net trade were disproportionately affected by the highly volatile evolution of Irish intellectual property products. The calculations here abstract from the resulting strong volatility. See the box entitled “Intangible assets of multinational enterprises in Ireland and their impact on euro area GDP”, Economic Bulletin, Issue 3, ECB, 2023. For a deeper discussion on business investment after the pandemic, see the article entitled “The recovery in business investment – drivers, opportunities, challenges and risks”, Economic Bulletin, Issue 5, ECB, 2022.
Typically, an increase in labour income provides stronger support to consumption than other sources of income as it is associated with a higher marginal propensity to consume. See the article entitled “Monetary policy and inequality”, Economic Bulletin, Issue 2, ECB, 2021; and Slačálek, J., Tristani, O. and Violante, G.L., “Household balance sheet channels of monetary policy: A back of the envelope calculation for the euro area”, Journal of Economic Dynamics & Control, Vol. 115, Article 103879, June 2020.
See the article entitled “Energy prices and private consumption: what are the channels?”, Economic Bulletin, Issue 3, ECB, 2022.
See the box entitled “COVID-19 and the increase in household savings: an update”, Economic Bulletin, Issue 5, ECB, 2021. See also the box entitled “Household saving during the COVID-19 pandemic and implications for the recovery of consumption”, Economic Bulletin, Issue 5, ECB, 2022.
For a deeper analysis, see the box entitled “The consumption impulse from pandemic savings ‒ does the composition matter?” in this issue of the Economic Bulletin, ECB, 2023.
See the box entitled “Economic developments and outlook for contact-intensive services in the euro area”, Economic Bulletin, Issue 7, ECB, 2021.
See the article entitled “Energy prices and private consumption: what are the channels?”, Economic Bulletin, Issue 3, ECB, 2022.
See the box entitled “The impact of the Russian invasion of Ukraine on euro area activity via the uncertainty channel”, Economic Bulletin, Issue 4, ECB, 2022.
See the box entitled “The consumption impulse from pandemic savings – does the composition matter?” in this issue of the Economic Bulletin, ECB, 2023.
See Battistini, N., Falagiarda, M., Hackmann, A. and Roma, M., “Navigating the housing channel of monetary policy across euro area regions”, Working Paper Series, No 2752, ECB, November 2022. See also the box entitled “Monetary policy and housing investment in the euro area and the United States”, Economic Bulletin, Issue 3, ECB, 2023
See the article entitled “The recovery in business investment – drivers, opportunities, challenges and risks”, Economic Bulletin, Issue 5, ECB, 2022.
Euro area potential growth has been lower than in the United States over the past two decades owing to lower total factor productivity growth related to a slower adoption of information and communication technologies, less investment in intangibles and lower labour supply. See Licchetta, M., Mattozzi, G., Raciborski, R. and Willis, R., “Economic adjustment in the euro area and the United States during the COVID-19 crisis”, SUERF Policy Brief, No 341, SUERF, June 2022.
A recent analysis found that structural differences (i.e. the share of tourism and consumption in GDP) and the technological lead (i.e. the share of the services sector where teleworking was a possibility and teleworking technology was used) explain almost 60% of the growth differential between the euro area and the United States in 2020. The rest is associated with involuntary and voluntary mobility restrictions and government support. See Chatelais, N., “Covid-19 and divergence in GDP declines between Europe and the United States”, Eco Notepad, No 229, Banque de France, 28 September 2021.
See Milesi-Ferretti, G.M., “A most unusual recovery: How the US rebound from COVID differs from rest of G7”, Up Front, Brookings, 8 December 2021.
While consistent data comparisons are difficult, the discretionary component of the fiscal response to the pandemic in 2020 was estimated to have amounted to about 4.25% of GDP in the euro area (after some ex post downward revision; see Box 2) and about 7.75% of GDP in the United States. If the impact of automatic stabilisers ‒which are assessed to be relatively larger in the euro area – is included, the total fiscal impulse in the euro area in 2020 came somewhat closer to the impulse in the United States (at about 7% of GDP compared with just below 10% in the United States). Fiscal policies also differed in design, with direct transfers to households through tax credits and an extension of unemployment benefits in the United States, while the euro area focused on job retention schemes and experienced a much milder impact from pandemic-related unemployment. For more details, see the box entitled “Economic developments in the euro area and the United States in 2020”, Economic Bulletin, Issue 2, ECB, 2021. Similar conclusions are also captured in Boone, L., “The EA and the US in the COVID-19 crisis: Implications for the 2022-2023 policy stance”, Ecoscope, Organisation for Economic Co-operation and Development, 18 January 2022.
See the box entitled “Monetary policy and housing investment in the euro area and the United States”, Economic Bulletin, Issue 3, ECB, 2023.
For more details on various fiscal support measures at country level, see the article entitled “The initial fiscal policy responses of euro area countries to the COVID-19 crisis”, Economic Bulletin, Issue 1, ECB, 2021; and the box entitled “Government expenditure in the euro area during the pandemic crisis ‒ insights from the Classification of the Functions of Government data”, Economic Bulletin, Issue 3, ECB 2023. Going beyond the COVID-19 crisis, for more details on fiscal policy measures in 2022, including their impact on real GDP growth and inflation, see the box entitled “Euro area fiscal policy response to the war in Ukraine and its macroeconomic impact”, Economic Bulletin, Issue 5, ECB, 2022; and the article entitled “Fiscal policy and high inflation”, Economic Bulletin, Issue 2, ECB, 2023.
Euro area governments granted liquidity support to companies in the form of tax deferral schemes and capital injections, thereby affecting government debt, as well as through substantial guarantees for loans, with an initial envelope of over 16% of euro area GDP. See the article entitled “The initial fiscal policy responses of euro area countries to the COVID-19 crisis”, op. cit. Finally, automatic stabilisers also played an important role in cushioning the impact on income and output in 2020. For the role of automatic stabilisers in the euro area and a comparison with other jurisdictions, see the article entitled “Automatic fiscal stabilisers in the euro area and the COVID-19 crisis”, Economic Bulletin, Issue 6, ECB, 2020.
For an in-depth analysis of NGEU plans, see Bańkowski, K. et al., “The economic impact of Next Generation EU: a euro area perspective”, Occasional Paper Series, No 291, ECB, April 2022.
For a detailed analysis of these factors and their economic impact, see Lane, P.R., “Bottlenecks and monetary policy”, The ECB Blog, ECB, 10 February 2022; and the boxes entitled “What is driving the recent surge in shipping costs?”, Economic Bulletin, Issue 3, ECB, 2021; “The semiconductor shortage and its implication for euro area trade, production and prices”, Economic Bulletin, Issue 4, ECB, 2021; “The impact of supply bottlenecks on trade”, Economic Bulletin, Issue 6, ECB, 2021; and “Sources of supply chain disruptions and their impact on euro area manufacturing”, Economic Bulletin, Issue 8, ECB, 2021.
For a detailed discussion of the drivers behind reduced activity in the automotive sector, see the box entitled “Motor vehicle sector: explaining the drop in output and the rise in prices”, Economic Bulletin, Issue 7, ECB, 2022.
For a discussion of the model, see the box entitled “Sources of supply chain disruptions and their impact on euro area manufacturing”, Economic Bulletin, Issue 8, ECB, 2021.
See the box entitled “Main findings from the ECB’s recent contacts with non-financial companies”, Economic Bulletin, Issue 3, ECB, 2023.
For a detailed analysis, see the box entitled “Natural gas dependence and risks to euro area activity”, Economic Bulletin, Issue 1, ECB, 2022.