Measuring fragmentation in the euro area unsecured overnight interbank money market: a monetary policy transmission approach
Published as part of the ECB Economic Bulletin, Issue 5/2018.
The overnight money market plays an important role in the implementation and transmission of monetary policy in the euro area. Money market fragmentation is a sign of impairment in the transmission mechanism which merits the close monitoring of a set of suitable indicators. This article discusses concepts and measurement of fragmentation and proposes a new measure of fragmentation from a monetary policy transmission perspective.
1 Introduction
The overnight money market is the starting point of the monetary policy transmission mechanism. Expectations about the path of the ECB’s key policy rates underpin the expected path of overnight rates. Overnight rates, in turn, anchor the entire yield curve, as long-term rates that matter most for economic activity are a function of expectations of future overnight rates plus risk premia. Hence, a well-functioning overnight money market without fragmentation is important for the transmission of monetary policy.
The unsecured overnight interbank segment is especially relevant, because price formation in this market has arguably the closest link to monetary policy. The unsecured segment remains highly relevant for the implementation and transmission of monetary policy, notwithstanding the secular shift in euro area money market activity towards secured transactions.[1] Prices in this segment reflect supply and demand dynamics for central bank reserves. As such, price formation is predominantly liquidity-driven and depends on factors under the direct control of the central bank: (i) the key policy rates and (ii) the quantity of reserves provided by the central bank. By contrast, the demand for central bank reserves is not necessarily the driving factor behind price formation in the secured money market. For the majority of repo transactions, it is the supply of and demand for collateral that drives prices. Although monetary policy can impact the market for collateral,[2] exogenous factors such as regulation[3] are also important.
Fragmentation is a sign of impairment in the initial transmission of monetary policy, which can undermine its effectiveness in steering broad credit conditions for households and firms. The first signs of market stress during the financial crisis became evident in the unsecured interbank segment. The ECB – as well as other central banks – therefore closely monitored developments in interbank funding markets over the course of the crisis, as evidenced in official publications, speeches and summaries of policy meetings.[4] To address impairments in the interbank market, the ECB introduced a variety of measures, such as fixed rate tender procedures with full allotment, additional longer-term refinancing operations and reciprocal liquidity swap lines with several other central banks.
The financial crisis led to an increase in academic research on interbank markets to improve understanding of their structure and functioning, as well as the sources and degree of stress and fragmentation in these markets. For example, Heider et al. develop a model of interbank lending and borrowing with counterparty risk and analyse how banks’ private information about risks affects the trading and pricing of liquidity in this market segment.[5] Eisenschmidt and Tapking show that concerns about market access in the future can lead banks to either increase their short-term lending rates or withdraw entirely from interbank lending.[6] Cocco et al. and Bräuning and Fecht find that lending relationships are an important determinant of the availability of funding and the interest rate at which banks can borrow in the interbank market.[7] Frutos et al. examine stress in the European interbank market using payments systems data; they find that increased counterparty risk of borrowers in non-core euro area countries resulted in less lending by banks in core countries.[8] Garcia-de-Andoain et al. and Mayordomo et al. develop indicators of fragmentation for the interbank market based on interest rate differentials.[9]
This article adds to the literature on the measurement of fragmentation by taking a monetary policy transmission perspective. Section 2 discusses concepts of fragmentation and outlines some of the existing measures. Section 3 explains how it is possible to build an indicator of fragmentation based on unsecured overnight money market transactions. Section 4 discusses the properties of the new indicator compared with existing indicators.
2 Defining and measuring fragmentation
From a monetary policy transmission perspective, fragmentation can be viewed as the lack of full tradability of central bank reserves across borders which cannot be explained by technical or fundamental factors. In the context of a monetary union, a well-functioning money market without fragmentation implies that reserves flow freely between banks. As a result, interest rates should satisfy the law of one price, meaning that they should be homogenous across banks after controlling for technical (e.g. access to the central banks’ standing facilities)[10] and fundamental factors (e.g. counterparty credit risk) that would justify rate differentials. Although there might be idiosyncratic factors affecting cross-border trading, there should be no systematic impediments to cross-border borrowing and lending in a non-fragmented market.[11]
Conceptually, fragmentation in the euro area is often viewed through the lens of financial integration, while data availability has led to indicators deviating from this concept being used to assess the state of fragmentation. Seen from the financial integration perspective, impairment in cross-border market activity – in terms of either interest rate differentials across countries or the lack of cross-border funding – can indicate fragmentation. Measuring fragmentation in terms of risk-adjusted rates and cross-border activity requires transaction data which are not publicly available. In practice, therefore, fragmentation has often been assessed using timely and readily available indicators of money market activity (e.g. money market interest rate spreads, which are not necessarily indicative of cross-border fragmentation). Other measures used to gauge fragmentation include indicators of interest rate dispersion (which is linked to the law of one price),[12] network dynamics[13] and recourse to the Eurosystem’s balance sheet.[14]
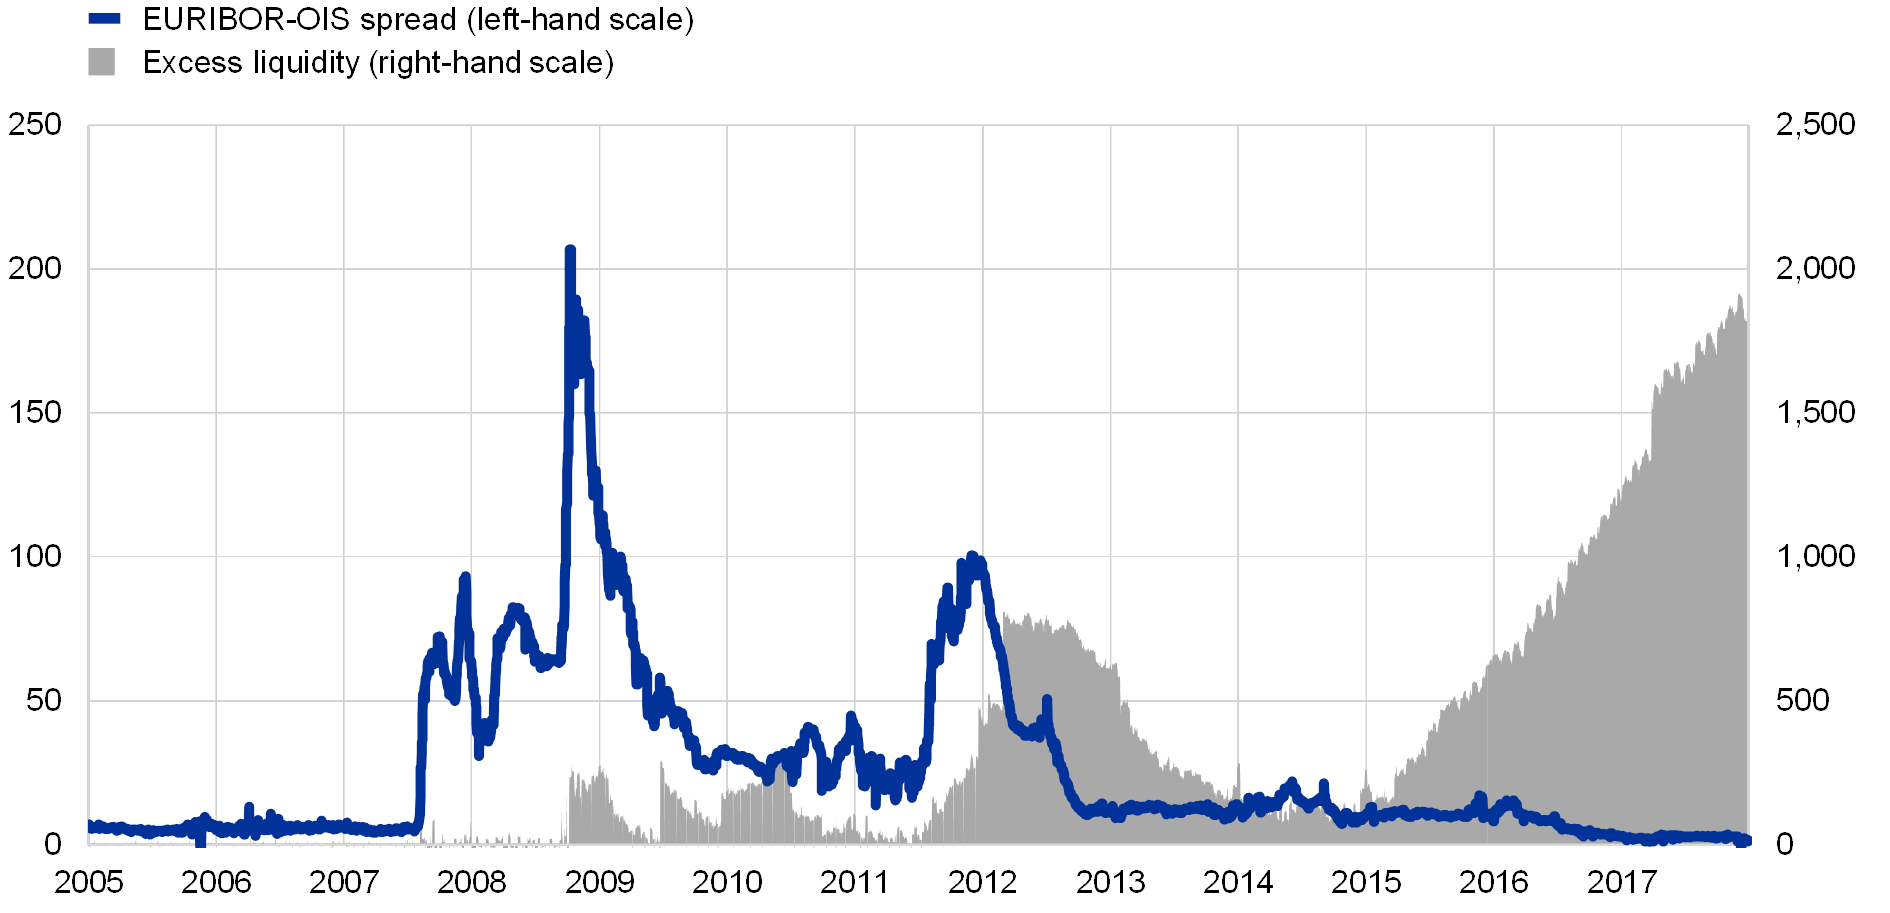
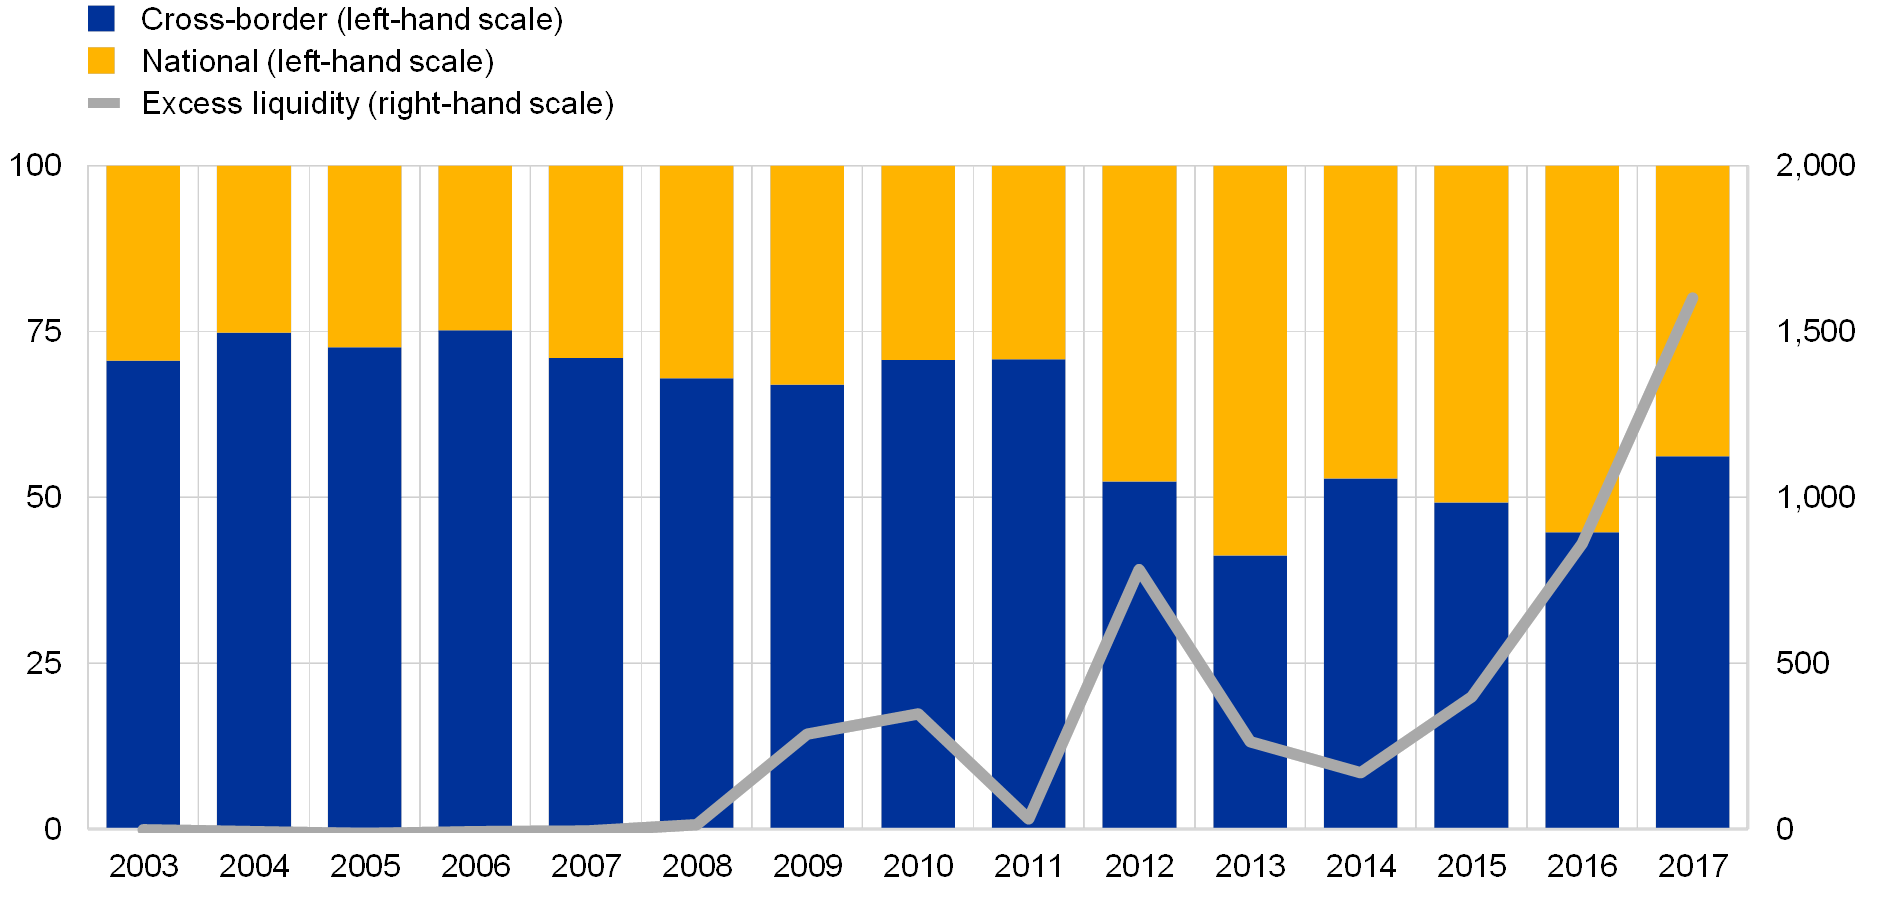
Different measures reflect different aspects of fragmentation and can be affected by non-standard monetary policies. Prior to the financial crisis, the three-month EURIBOR-OIS spread was small (see Chart 1).[15] As money market tensions increased in 2007, 2008 and 2011, this commonly used metric widened sharply, before narrowing again in response to the non-standard monetary policy measures introduced over the past decade. The figure has been very stable since 2013 and is currently below its pre-crisis level.[16] Like many other indicators, the EURIBOR-OIS spread is affected by central bank interventions, making it difficult to distinguish the underlying degree of fragmentation from the mitigating impact of central bank policies. Similarly, cross-border trading volumes – another common measure of fragmentation – are affected by excess liquidity, which can significantly change supply and demand dynamics in the market for central bank reserves, thereby distorting their signalling effect. Between 2014 and 2016, for example, the rise in excess liquidity was accompanied by a decline in the share of cross-border trading in the unsecured interbank money market (see Chart 2).[17] Seen in isolation, this could be (mis)interpreted as an increase in fragmentation, which conflicts with the signal emanating from the EURIBOR-OIS spread.
Chart 1
Three-month EURIBOR-OIS spread and excess liquidity
(left-hand scale: basis points; right-hand scale: EUR billions; daily data)
Sources: Bloomberg and ECB calculations.
Note: The latest observations are for 31 December 2017.
Chart 2
Geographical distribution of money market transactions
(left-hand scale: percentages of total volume; right-hand scale: EUR billions; annual data)
Sources: ECB “Financial integration in Europe” report 2018, ECB’s Euro Money Market Survey, ECB money market statistical reporting (MMSR) and ECB calculations.
Notes: Data refer to the second quarter of each year. Data for 2016 (third quarter) and 2017 are taken from the MMSR dataset. All data pertain to those reporting banks that were part of both the Money Market Survey panel and the MMSR database. These data are still subject to potential revision. The excess liquidity series shows levels at the end of the second quarter of each year.
Existing fragmentation indicators could be improved by both taking into account a broader set of transactions and controlling for the prevailing level of policy support. Considering indicators based on all money market transactions rather than a subset of trades or quotes (e.g. EURIBOR) can provide insight into smaller pockets of stress that may not be visible otherwise. In addition, given the endogeneity between fragmentation and monetary policy support, indicators that aim to control for the impact of monetary policy can shed light on underlying fragmentation. The next section proposes a new indicator of fragmentation for the unsecured overnight interbank market that takes these factors into account.
3 Fragmentation from a monetary policy transmission perspective: a new indicator based on unsecured overnight interbank transactions
This section details the construction of a new indicator of money market fragmentation. It starts with an overview of the theoretical underpinnings of the indicator, in particular the question of how unsecured short-term rates are determined in a corridor system under different liquidity conditions. It then explains the steps needed to build the indicator.
3.1 Rate formation in a corridor system and the impact of excess liquidity on market rates and volumes
Rate formation in the unsecured overnight interbank money market is a function of the ECB’s key policy rates and the quantity of reserves provided by the central bank. Under balanced liquidity conditions, whereby central bank liquidity provision is calibrated to fulfil the liquidity needs of the banking sector arising from reserve requirements and autonomous factors, overnight rates in the unsecured interbank money market are anchored to the main refinancing operations (MRO) rate. The rates on the standing facilities – the marginal lending facility and the deposit facility – provide a corridor around the MRO rate and serve as a ceiling and a floor for rates in the unsecured overnight interbank money market (assuming both counterparties in the trade have access to these facilities).
The position of rates within the corridor, as well as transaction volumes, depends on the level of reserves in the banking system. When liquidity conditions are neutral, the central bank provides just enough reserves to meet the needs of the banking sector at a rate linked to the MRO rate.[18] Hence, the end-of-day marginal value of reserves is equal to the MRO rate (assuming no fragmentation in the market). In general, the end-of-day marginal value is a weighted average of the rates on the marginal lending and deposit facilities, whereby the weights are a function of the probability of taking recourse to either facility (see Chart 3). In the context of full allotment tender procedures and the asset purchase programme (APP), the level of reserves provided by the Eurosystem has greatly exceeded the liquidity needs of the banking system over recent years. This has resulted in high levels of excess liquidity, which has reduced trading volumes and made the deposit facility rate (DFR) the effective anchor for market rates (as the probability of end-of-day recourse to the deposit facility has effectively increased to one).[19]
Chart 3
Stylised relationship between unsecured overnight interbank rates and the ECB’s key policy rates in the absence of fragmentation
(x-axis: central bank liquidity provision; y-axis: unsecured overnight interbank rate)
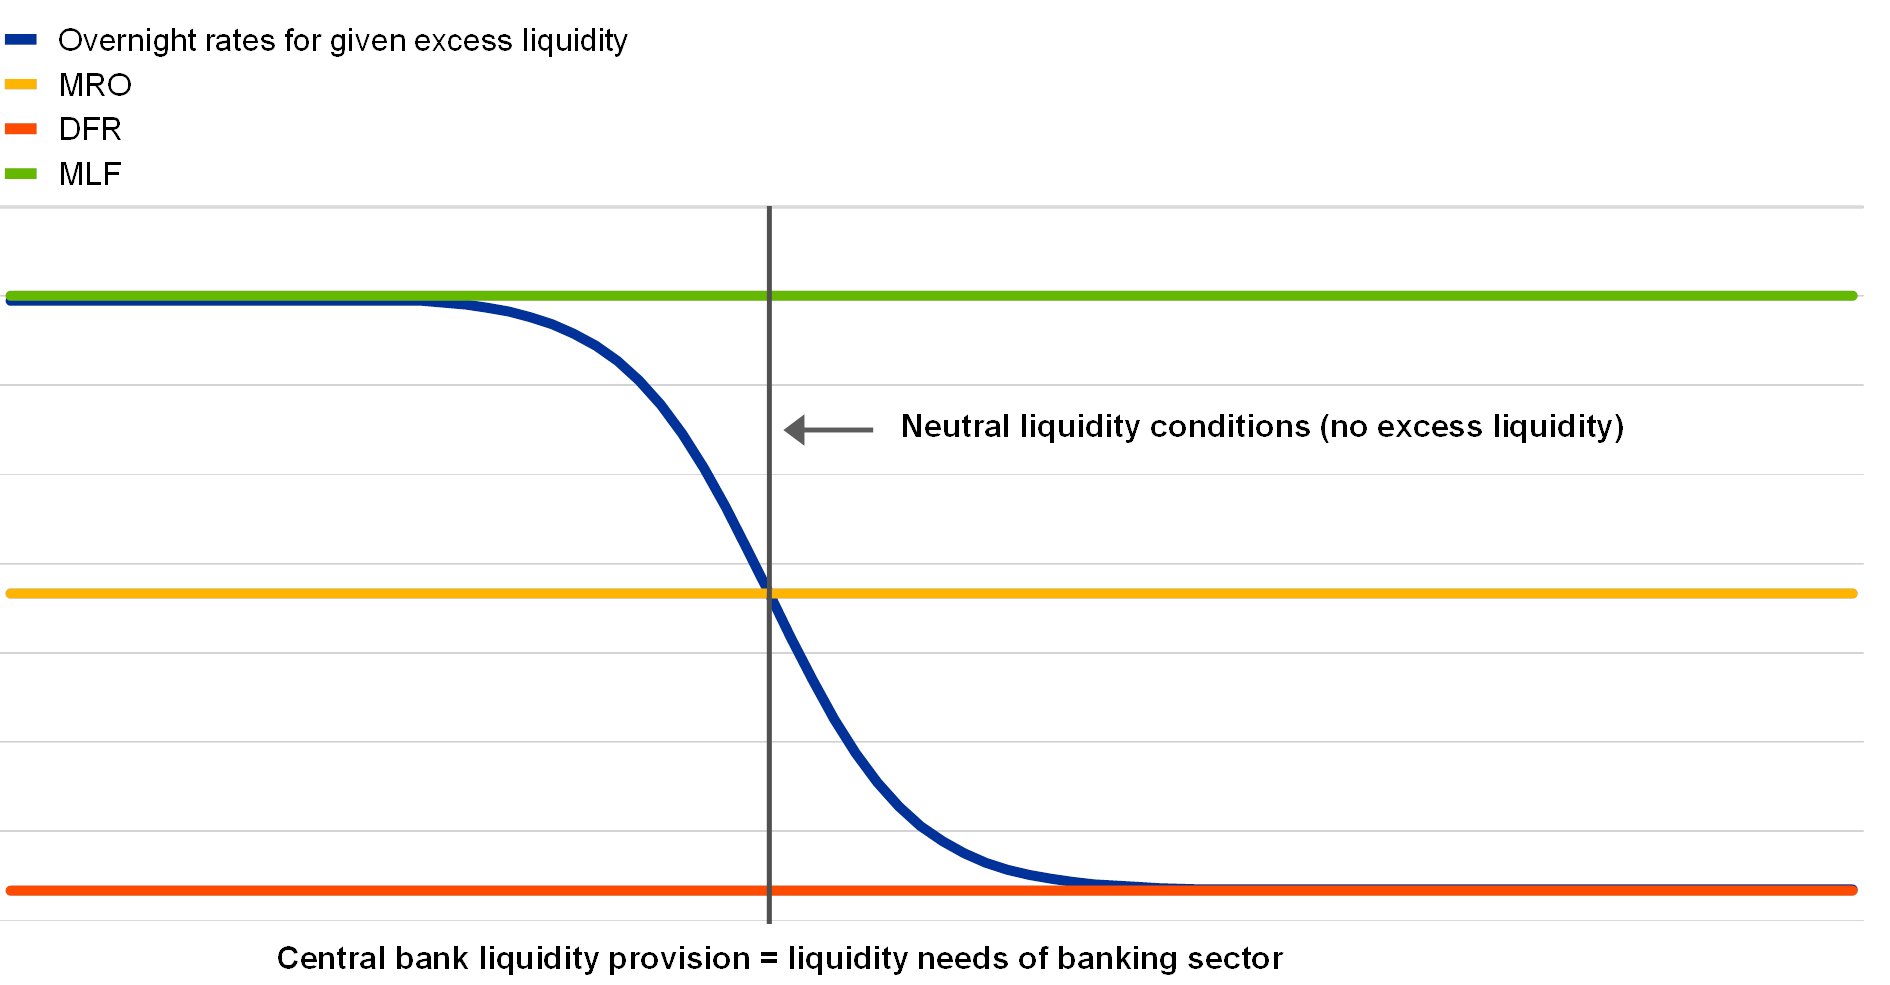
Notes: This is a stylised chart illustrating a symmetrical standing facilities corridor. The same broad concepts apply to an asymmetrical corridor. MLF, MRO and DFR stand for the rates that apply to the marginal lending facility, the main refinancing operations and the deposit facility, respectively. To the left of the grey line, there is a shortage of reserves in the banking sector; to the right of the grey line, there is excess liquidity (i.e. a surplus of reserves).
The distribution of central bank reserves in itself is not an indicator of fragmentation. As discussed in Eisenschmidt et al., the financial structure of the euro area has led to excess liquidity accumulating in particular locations during the period of the APP.[20] This concentration of excess liquidity is not necessarily indicative of fragmentation. Assuming risk neutrality, arbitrage ensures that rates in the unsecured overnight interbank market are equilibrated across banks, and thereby across countries, within the euro area. The extent to which arbitrage opportunities exist and are not exploited, however, does convey information on fragmentation. This concept is the basis for the discussion in Section 3.2.
3.2 Construction of the new indicator
Full fungibility of central bank reserves across borders implies that the rate paid by any bank to borrow reserves in the unsecured overnight market should be a function of the aggregate, rather than domestic, level of excess liquidity.[21] The blue line in Chart 4 presents a stylised illustration of the relationship between the weighted average euro area overnight rate in the unsecured interbank money market ( ) and aggregate excess liquidity ( ).[22] With an aggregate level of excess liquidity denoted by the grey line, the unsecured overnight interbank rate equals . Abstracting from technical or fundamental factors that may impact rates, it follows from the monetary policy transmission-based definition of fragmentation presented in Section 2 that rates should equal across banks regardless of the levels of excess liquidity banks are exposed to in their domestic markets. Charts 5 and 6 show stylised examples of a fragmented and a non-fragmented market under conditions of aggregate excess liquidity given by in Chart 4. In the fragmented market, there is a clear correlation between rates and the country level of excess liquidity: the country-level rates rise higher above as the level of domestic excess liquidity falls (yellow region of the chart). In the non-fragmented market, rates are equal to regardless of the domestic level of excess liquidity.
Chart 4
Stylised relationship between aggregate excess liquidity and the unsecured overnight interbank rate in the euro area
(x-axis: aggregate excess liquidity; y-axis: unsecured overnight interbank rate)
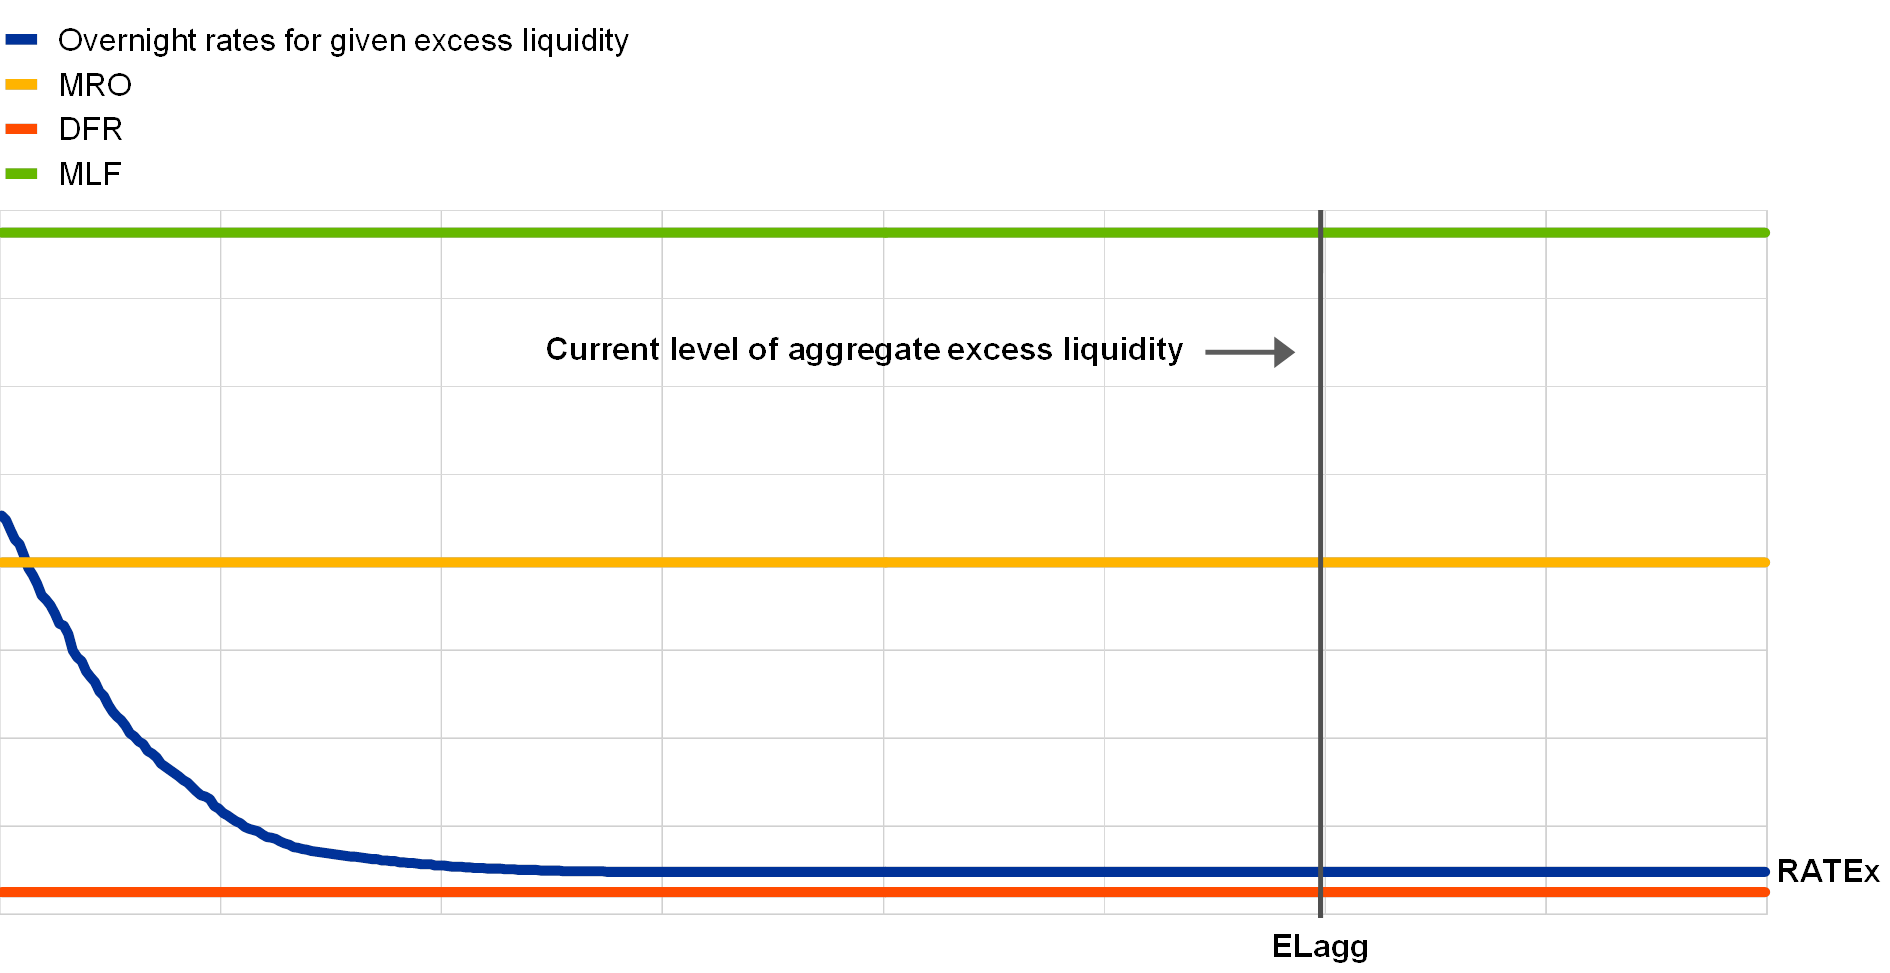
Notes: This is a stylised chart illustrating a symmetrical standing facilities corridor. The same broad concepts apply to an asymmetrical corridor. MLF, MRO and DFR stand for the rates that apply to the marginal lending facility, the main refinancing operations and the deposit facility, respectively.
Chart 5
Stylised example of a fragmented market
(x-axis: country-level excess liquidity; y-axis: country-level unsecured overnight interbank rate)
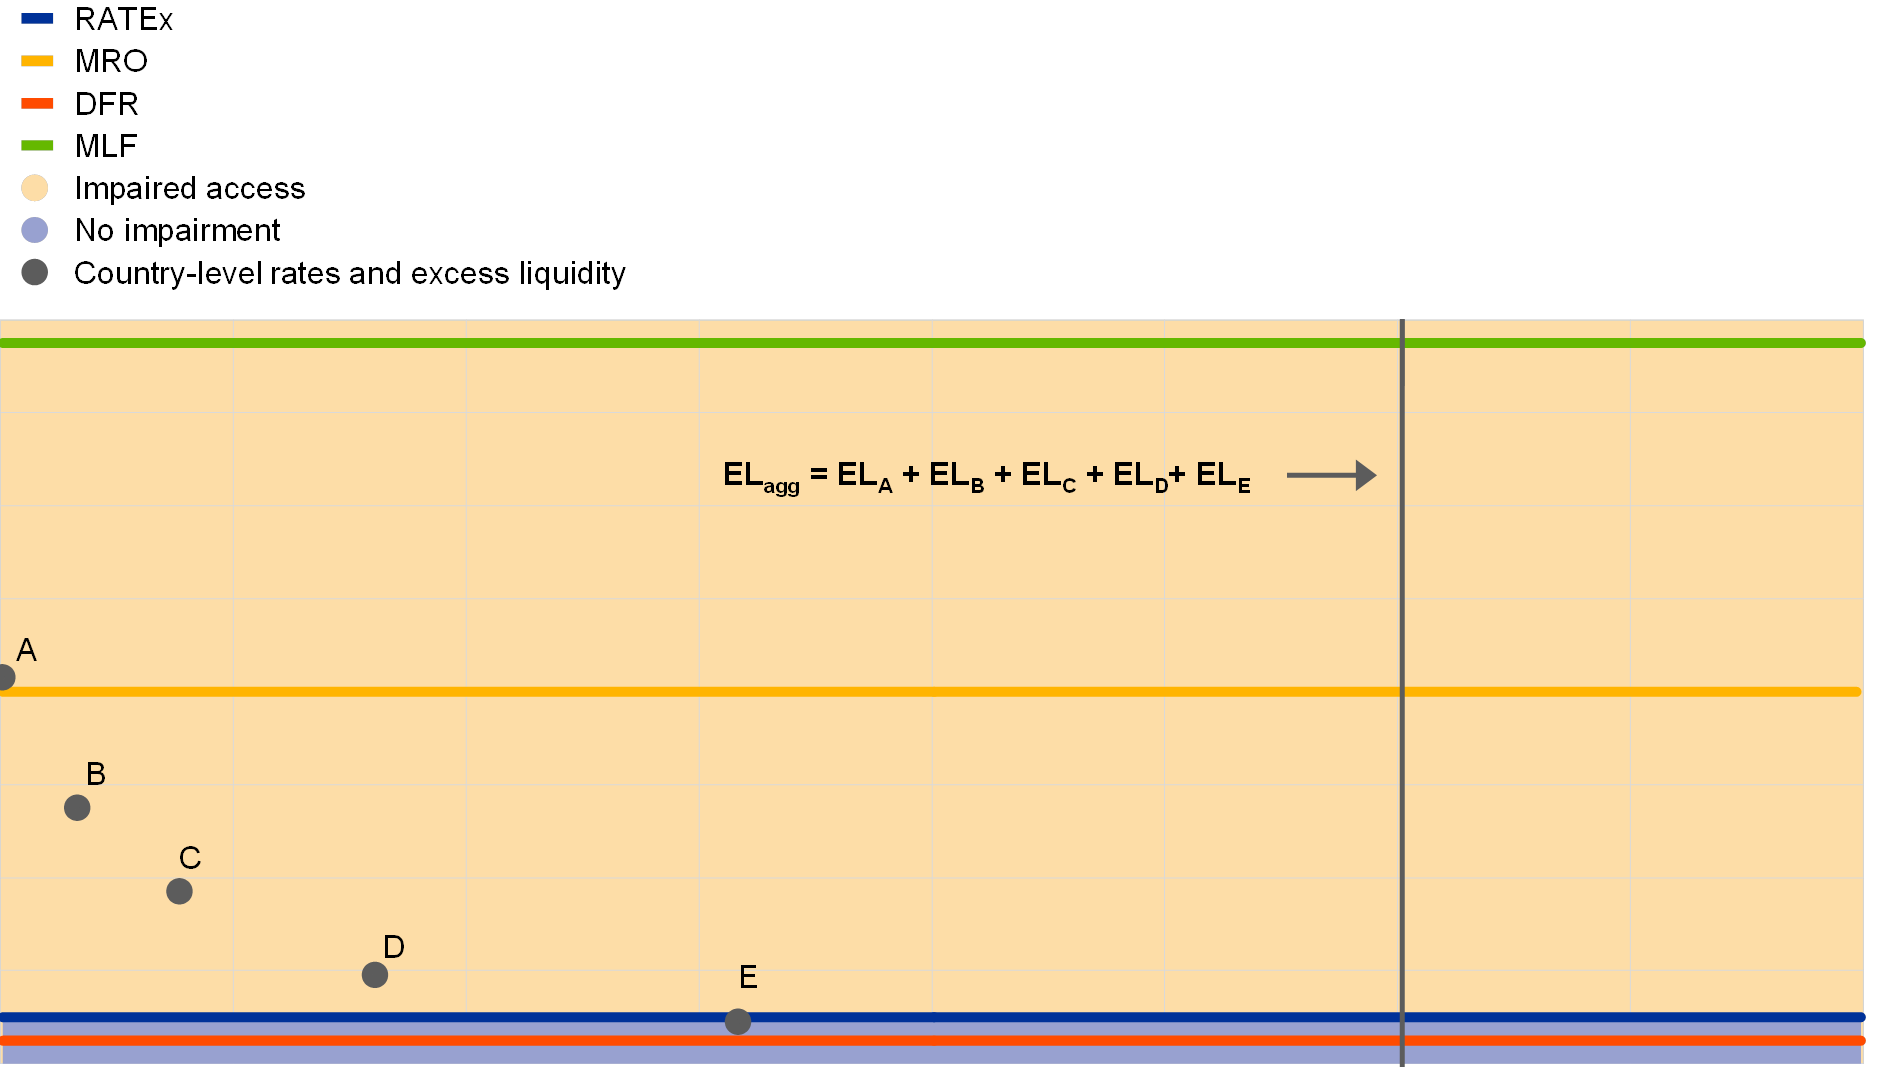
Notes: This is a stylised chart illustrating a symmetrical standing facilities corridor. The same broad concepts apply to an asymmetrical corridor. MLF, MRO and DFR stand for the rates that apply to the marginal lending facility, the main refinancing operations and the deposit facility, respectively. is the aggregate unsecured overnight interbank rate in the euro area for the level of aggregate excess liquidity denoted by , as shown in Chart 4. is the sum of excess liquidity across all countries. , , , and denote the levels of excess liquidity in countries A, B, C, D and E.
Chart 6
Stylised example of a non-fragmented market
(x-axis: country-level excess liquidity; y-axis: country-level unsecured overnight interbank rate)
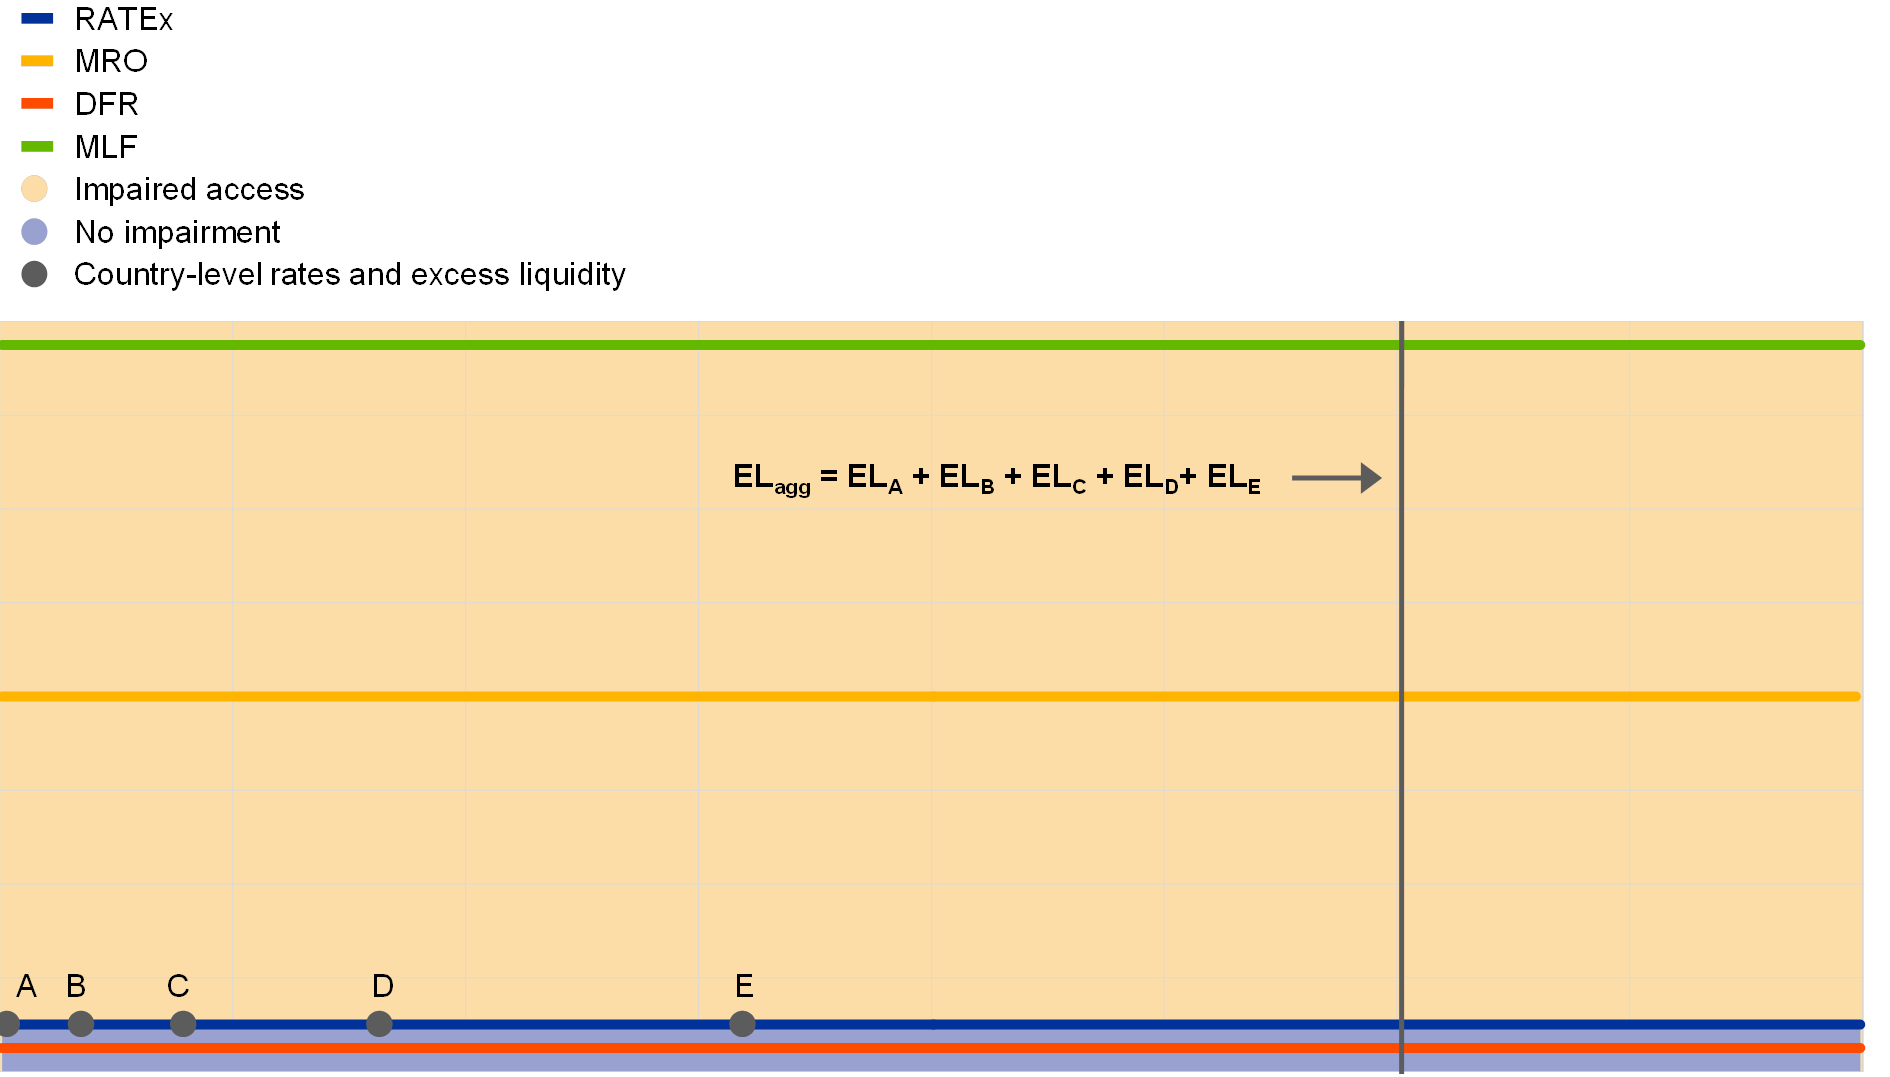
Notes: See Chart 5.
In order to translate the monetary policy transmission-based definition of fragmentation into an indicator, it is necessary to establish the aggregate interest rate spreads against the DFR that would be expected to prevail in a non-fragmented market for every level of aggregate excess liquidity (i.e. threshold spreads). This exercise should be based on transactions of entities that have access to the Eurosystem’s standing facilities (i.e. euro area banks) and on rates that are adjusted for counterparty credit risk in order to isolate rate differentials attributable to fragmentation from those owing to technical and fundamental factors. The relationship between excess liquidity and money market rates is in itself a function of the state of fragmentation.[23] Therefore, the thresholds should ideally be derived from pre-crisis data, when money markets were perceived as being completely non-fragmented. This is not possible for two reasons: first, transaction-level data for the interbank overnight money market are not available for the period prior to the go-live date of TARGET2 in May 2008; and second, levels of excess liquidity were minimal prior to the crisis.[24]
Historical risk-adjusted unsecured overnight interbank transaction data for euro area banks during periods of relatively low market stress since 2008 are used to derive threshold spreads against which the current level of fragmentation can be benchmarked. First, unsecured overnight interbank borrowing rates derived from TARGET2 payment system data[25] are adjusted for counterparty credit risk.[26] Second, the sampling period is chosen by finding a compromise between having sufficient variation in the level of excess liquidity on the one hand and ensuring that the period represents relatively benign money market conditions on the other.[27] Third, a regression spline is fitted to the relationship between aggregate risk-adjusted rate spreads against the DFR and aggregate excess liquidity over these time periods. Finally, the threshold spreads are obtained by using the 95% tolerance interval corresponding to the estimated regression spline (see Chart 7).
Chart 7
Euro area volume-weighted risk-adjusted average borrowing rate spreads against the DFR and aggregate excess liquidity during periods of relatively low financial market stress since 2008
(x-axis: aggregate excess liquidity in EUR billions; y-axis: spread between euro area volume-weighted risk-adjusted average borrowing rate and the DFR in basis points)

Sources: TARGET2, ECB and ECB calculations.
Notes: The scatter plot shows the spread of euro area volume-weighted average unsecured overnight borrowing rates corrected for risk to the DFR. Risk-adjusted rates are calculated by regressing the volume-weighted average TARGET2 borrowing rates for each country on the median CDS spread across banks located in the respective country. Pooled OLS is used to estimate the risk-adjusted rates for vulnerable countries and other countries. The regressions are based on daily data from June 2008 to September 2017. The risk-adjusted rate is computed as the difference between the actual rate on day t and the coefficient estimate multiplied by the country’s median bank-level CDS spread on day t. The scatter plot shows daily rates during the following periods: 1 June-27 August 2008; 1 July 2009-30 June 2011; 1 January-30 August 2013. The fitted line is derived from a B-spline regression.
A fragmentation indicator is constructed by comparing rates observed at the country level with the estimated threshold rates. Country-level monthly averages of volume-weighted unsecured overnight interbank rates adjusted for counterparty risk are compared with the estimated threshold levels. From July 2016 onwards, data collected under the Money Market and Statistical Reporting (MMSR) regulation can be used to complement the rates derived from TARGET2 payment system data. If a country’s volume-weighted risk-adjusted average rate exceeds the threshold level corresponding to the aggregate level of excess liquidity prevailing in a given month, the country’s banking sector is classified as having impaired market access in that month. Countries are then weighted by their share of the sum of banking sector assets across the sample of countries. Hence, countries with larger banking sectors are given more weight. The resulting fragmentation indicator estimates the share of euro area banking sectors with impaired access to the unsecured overnight interbank market at country level (see Chart 8).
Chart 8
Share of euro area banking sectors with impaired access to the unsecured overnight interbank money market at country level
(x-axis: month; y-axis: share of banking sector assets at country level)
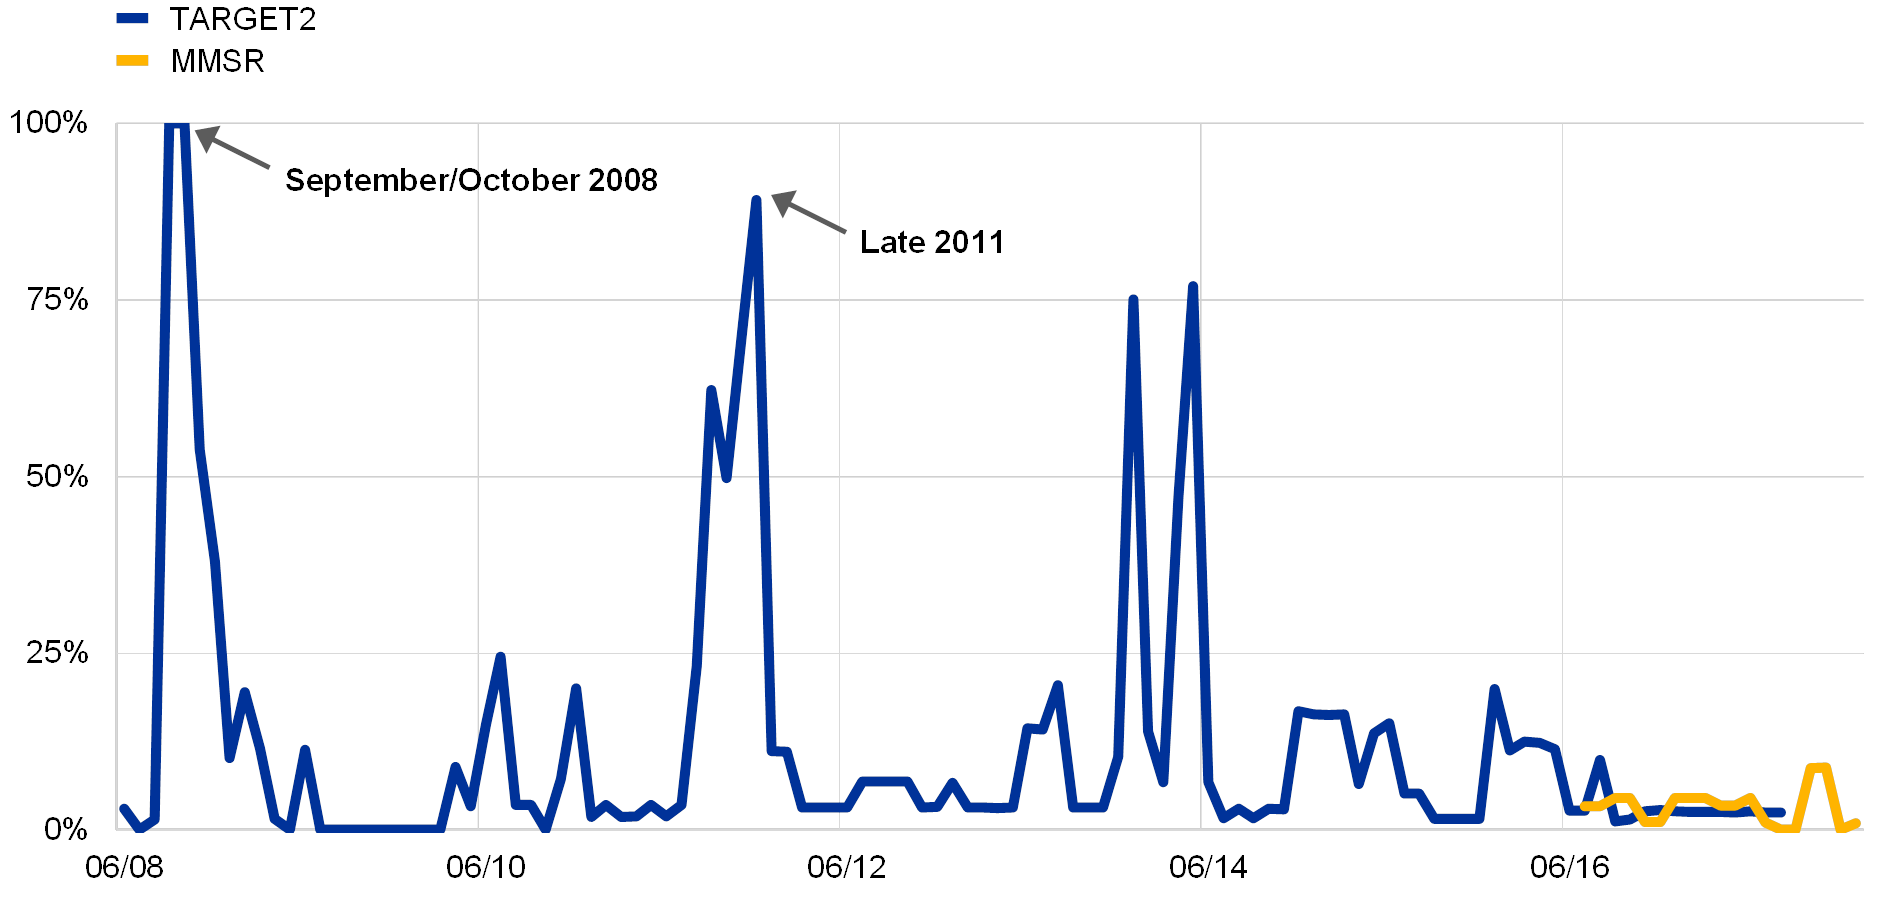
Sources: TARGET2, MMSR, ECB and ECB calculations.
Notes: Impaired access is determined by comparing risk-adjusted rate spreads against the DFR at country level with a threshold spread level implied by the historical relationship between aggregate excess liquidity and risk-adjusted rates during low stress periods. The sample of banks is adjusted so that both series cover the same range of countries. The latest observations are for August 2017 for TARGET2 data and December 2017 for MMSR data.
4 Development and properties of the new indicator
Compared to the periods of relatively low financial market stress from mid-2008 to mid-2013, fragmentation seen through the lens of reserve tradability is estimated to also have been low at the end of 2017. Fragmentation peaked in late 2008 following the bankruptcy of Lehman Brothers, when banks in all euro area countries were estimated to have had impaired market access (see Chart 8). By around mid-2009, however, banks in all those countries appeared to have regained full access to market funding based on the interest rates prevailing in domestic money markets at that time. Fragmentation rose again in the spring of 2010 as the sovereign debt crisis began, and increased sharply by late 2011 as the crisis intensified. As aggregate excess liquidity increased following the allotment of the three-year longer-term refinancing operations (LTROs) in December 2011 and February 2012, unsecured overnight interbank rates across countries declined. However, the fragmentation measure increased through mid-2014 due to a reduction in excess liquidity and growing uncertainty about its path from late 2013 onwards owing to early repayments in the three-year LTROs, as well as some repricing in the money market against the background of the comprehensive assessment. It also remained somewhat elevated in the months following the introduction of negative rates on the DFR, as banks were initially reluctant to trade at negative interest rates, resulting in higher money market rates; the full pass-through of negative policy rates only materialised in early 2015. A decline in the level of fragmentation followed the cessation in June 2014 of the liquidity-absorbing fine-tuning operations related to the Securities Markets Programme and the announcement of the package of measures aimed at expanding the Eurosystem balance sheet. Some fragmentation remained in 2017, albeit at relatively low levels.
The new fragmentation indicator complements existing measures by better controlling for the degree of prevailing monetary policy support and generally offering a more nuanced view of fragmentation. The indicator is benchmarked against the observed relationship between unsecured overnight rates and excess liquidity during periods of low money market stress. This exercise helps to control for the endogeneity between the level of fragmentation and monetary policy accommodation as higher fragmentation has typically coincided with higher levels of excess liquidity, but also with a change in the relationship between overnight rates and excess liquidity. Furthermore, the indicator is based on all money market transactions in a given period rather than on market quotes or a subset of trades. It is also constructed from data on rates and volumes, thus reflecting price and quantity dimensions of fragmentation.
As with any other indicator, however, the new fragmentation measure has its limitations and should be considered alongside a range of fragmentation measures. Ideally, the indicator would control for the width of the interest rate corridor as, all else being equal, rate spreads against the DFR should be lower for a given level of fragmentation the narrower the corridor. However, there is not enough variation over time in the width of the corridor at different levels of excess liquidity to reliably estimate adjustment coefficients. In any case, with high levels of excess liquidity, the analysis indicates that the elasticity of market rates to changes in the corridor width is minimal. Hence, it is only necessary to take into account the corridor width when interpreting the indicator when the aggregate level of excess liquidity is much lower than at the end of 2017.
Another caveat of the indicator is that it is based on a panel of banks that changes over time and cannot capture trades that did not take place because of fragmentation. The changing panel implies that an observed increase in measured fragmentation could be caused by (a) deteriorated trading conditions for the same banks or (b) changes in the composition of the panel. Furthermore, changes in the composition of the panel could be due to new banks joining the panel or existing banks leaving the panel, or both. The potentially changing composition of the panel highlights the risk of a sampling bias because the indicator does not take into account money market trading that is not observed. At the extreme, the indicator will substantially underestimate the true level of fragmentation when the panel of trading banks is exclusively made up of banks with good market access because the stressed banks, with counterfactually impaired market access, are not active any more. When banks regain market access, probably at higher rates, the indicator will overestimate fragmentation. If, intentionally or not, certain monetary policy measures work through disintermediation, this problem could become larger. To overcome this limitation, it is necessary to model banks’ participation in the market. This would facilitate an adjustment in the indicator based exclusively on observed rates.[28]
The new indicator sends a message that is broadly comparable to the EURIBOR-OIS spread but is more precise in tracking times of market adjustment, like the period leading up to the comprehensive assessment of euro area banks (see Chart 9). The indicator does a good job of tracking the periods of high stress during the Lehman Brothers episode and the euro area sovereign debt crisis. Remarkably, in contrast to the EURIBOR-OIS spread, it puts the stress levels at the end of 2011 on a par with those experienced after the collapse of Lehman Brothers. This difference could be attributable to the prevailing degree of policy support that arguably affects the EURIBOR-OIS spread more than the new indicator. The episode around the comprehensive assessment (late 2013 to late 2014) is signalled as a period of money market fragmentation, which is a plausible finding although the underlying reason for the fragmentation is largely unrelated to financial market stress. Finally, the indicator points to low levels of fragmentation in 2017, in line with the signal given by the EURIBOR-OIS spread.
Chart 9
Fragmentation indicator based on TARGET2 data and three-month EURIBOR-OIS spread
(the start of each series is indexed to a value of 1.0)
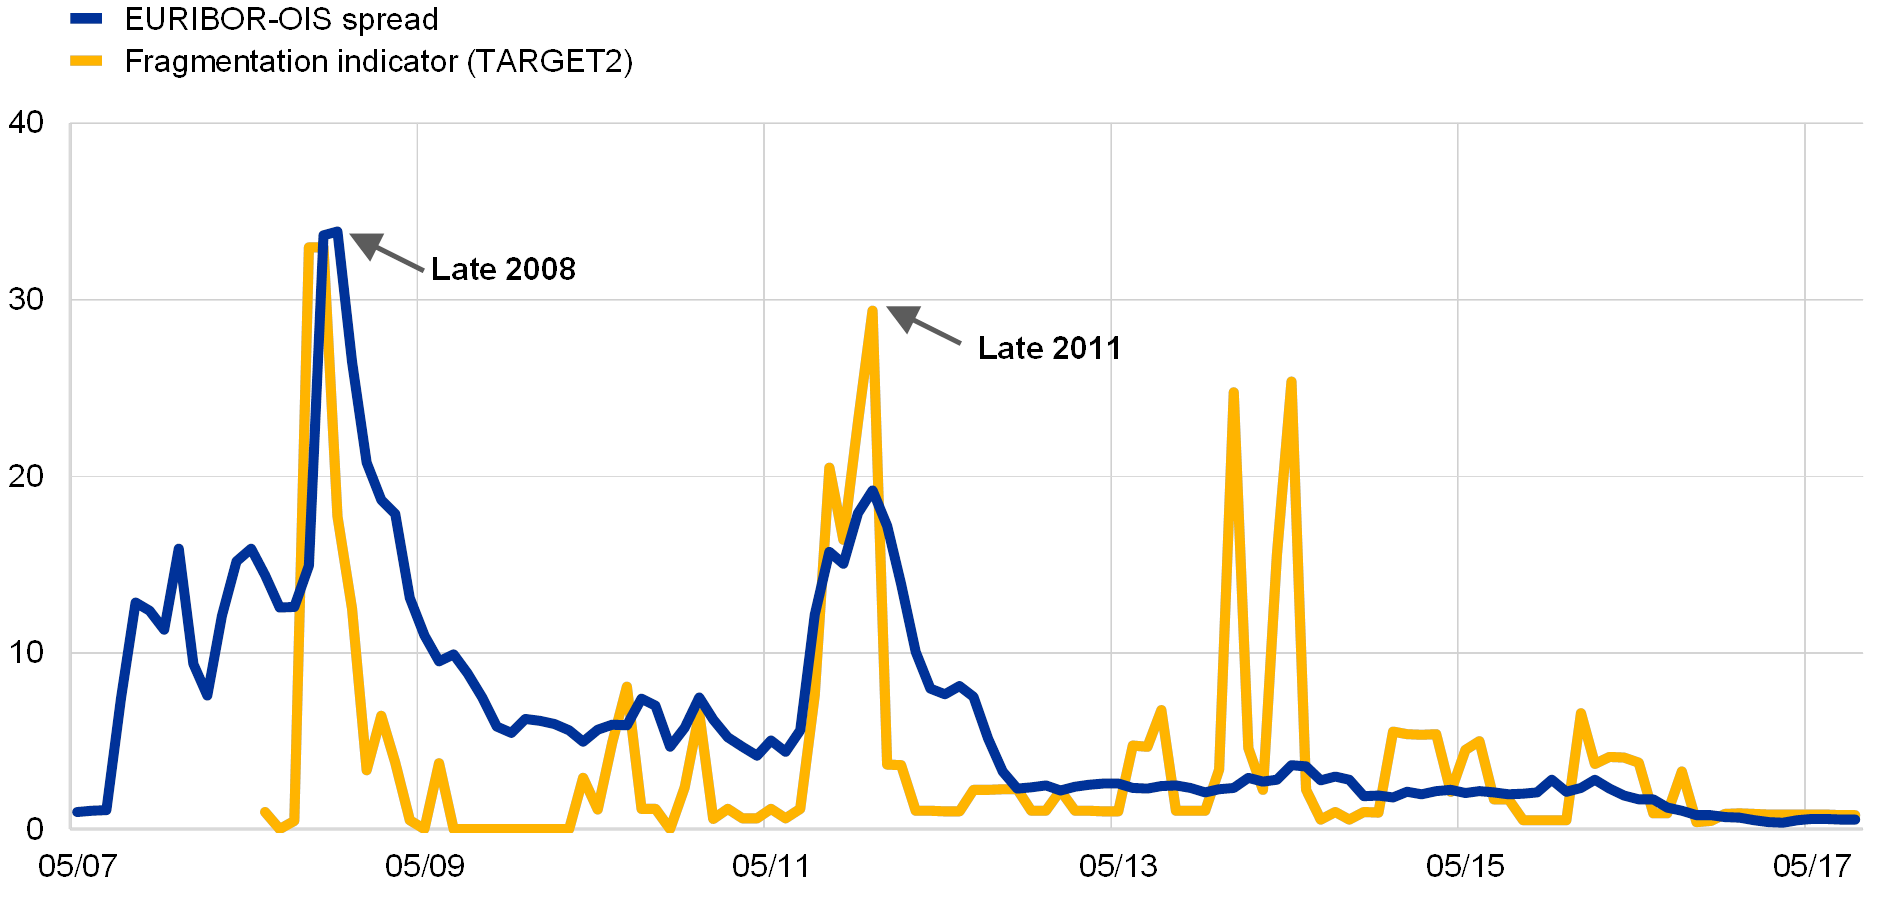
Sources: Bloomberg, TARGET2, ECB and ECB calculations.
Notes: The EURIBOR-OIS spread starts in May 2007 while the fragmentation indicator (based on TARGET2 data) starts in June 2008. The latest observations are for August 2017.
- For further discussion of the decline in unsecured money market activity, see “Euro money market study 2014”, ECB, April 2014 and “Financial integration in Europe”, ECB, May 2018, p. 135.
- This can happen both indirectly (e.g. via the central bank’s collateral framework) and directly (e.g. via central bank asset purchase programmes).
- For further discussion of the potential effects of regulation on secured money markets, see Grill, M., Jakovicka, J., Lambert, C., Nicoloso, P., Steininger, L. and Wedow, M., “Recent developments in euro repo markets, regulatory reforms and their impact on repo market functioning”, Financial Stability Review, ECB, November 2017, pp. 158-171.
- See, for example, “The implications of the money market tensions for the pass-through of MFI interest rates”, Monthly Bulletin, Box 5, ECB, December 2008, pp. 47-62; “Restarting a Market: The Case of the Interbank Market”, speech by Lorenzo Bini Smaghi, 1 December 2008; Jackson, C. and Sim, M., “Recent Developments in the Sterling Overnight Money Market”, Quarterly Bulletin, Bank of England, 2013 Q3, pp. 223-232; “Stress in Bank Funding Markets and Implications for Monetary Policy”, Global Financial Stability Report, Chapter 2, IMF, October 2008.
- Heider, F., Hoerova, M. and Holthausen, C., “Liquidity hoarding and interbank market rates: The role of counterparty risk”, Journal of Financial Economics, Vol. 118, Issue 2, 2015, pp. 336-354.
- Eisenschmidt, J. and Tapking, J., “Liquidity risk premia in unsecured interbank money markets”, Working Paper Series, No 1025, ECB, March 2009.
- Cocco, J.F., Gomes, F.J. and Martins, N.C., “Lending relationships in the interbank market”, Journal of Financial Intermediation, Vol. 18, Issue 1, 2009, pp. 24-48 and Bräuning, F. and Fecht, F., “Relationship Lending in the Interbank Market and the Price of Liquidity”, Review of Finance, Vol. 21, Issue 1, 2017, pp. 33-75.
- Frutos, J.C., Garcia-de-Andoain, C., Heider, F. and Papsdorf, P., “Stressed interbank markets: evidence from the European financial and sovereign debt crisis”, Working Paper Series, No 1925, ECB, June 2016.
- Garcia-de-Andoain, C., Hoffman, P. and Manganelli, S., “Fragmentation in the euro overnight unsecured money market”, Economic Letters, Vol. 125, Issue 2, 2014, pp. 298-302 and Mayordomo, S., Abascal, M., Alonso, T. and Rodriguez-Moreno, M., “Fragmentation in the European interbank market: Measures, determinants, and policy solutions”, Journal of Financial Stability, Vol. 16, 2015, pp. 1-12.
- Counterparty access to the Eurosystem’s balance sheet is one technical factor that can affect pricing in the money market. Only banks located in the euro area are eligible to participate in Eurosystem refinancing operations and have access to the standing facilities. As a result, the ECB’s key interest rates are not the relevant opportunity costs for all participants in the interbank market. Banks without access to the standing facilities must deposit euro reserves with another bank that does have access. The ensuing asymmetry in bargaining power can exert downward pressure on interbank rates when there is high excess liquidity. In the current environment, the rates at which non-euro area banks lend to (or place deposits with) euro area banks are below the deposit facility rate. Hence, market rates can deviate more from key policy rates when non-euro area banks account for a larger share of activity in the interbank money market. Such deviations arise from the technical issue of counterparty access to the Eurosystem’s balance sheet, however, and do not necessarily signal impairment in the monetary policy transmission mechanism.
- In the German banking system, for example, there are institutional lending relationships between savings banks and Landesbanks, which can reduce the need to participate in the interbank market. See Bräuning, F. and Fecht, F., “Relationship Lending in the Interbank Market and the Price of Liquidity”, Review of Finance, Vol. 21, Issue 1, 2017, pp. 33-75.
- See, for example, the annual ECB reports entitled “Financial integration in Europe” and Frutos, J.C., Garcia-de-Andoain, C., Heider, F. and Papsdorf, P., “Stressed interbank markets: evidence from the European financial and sovereign debt crisis”, Working Paper Series, No 1925, ECB, June 2016.
- See, for example, Rϋnstler, G., “Network Dependence in the Euro Area Money Market”, Working Paper Series, No 1887, ECB, 2016.
- See, for example, the annual ECB reports entitled “Financial integration in Europe”; Holló, D., Kremer, M. and Lo Duca, M., “CISS – A composite indicator of systemic stress in the financial system”, Working Paper Series, No 1426, ECB, 2012; Frutos, J.C., Garcia-de-Andoain, C., Heider, F. and Papsdorf, P., “Stressed interbank markets: evidence from the European financial and sovereign debt crisis”, Working Paper Series, No 1925, ECB, June 2016.
- The spread between the euro interbank offered rate (EURIBOR) and the overnight indexed swap (OIS) rate of the same maturity is an example of a measure widely used to gauge fragmentation in the unsecured interbank market. EURIBOR is a quoted rate for unsecured interbank term deposits, involving term, liquidity and credit risk premia. OIS rates are a proxy for risk-free rates, reflecting the expected path of monetary policy rates. The spread between these rates therefore measures various risk premia and is considered a proxy indicator for risk in the banking sector.
- The EURIBOR-OIS spread reflects the perceived credit risk of prime banks. Hence, it may only signal stress when tensions in the money market are severe enough to affect prime banks as well.
- Increasing levels of excess liquidity reduce banks’ funding needs and dampen trading volumes generally. Cross-border trading volumes in particular may decline as such transactions entail greater monitoring costs. At the same time, however, with substantial amounts of excess liquidity distributed to entities without access to the ECB’s deposit facility, the share of cross-border volumes can increase (e.g. in 2017) as these entities deposit euro reserves with banks located in the euro area.
- Under variable rate tender procedures, the MRO rate is a minimum bid rate for participation in Eurosystem liquidity-providing repurchase operations. Under fixed rate tender procedures with full allotment, the MRO rate is the actual rate at which banks participate in these operations.
- The standing facilities corridor can reduce transaction volumes by curtailing the range of rates that can prevail in the market. If credit risk premia rise substantially so as to push market rates outside of the corridor, banks will use the standing facilities rather than trade in the interbank market (assuming they have sufficient collateral and are not concerned about possible stigma effects of using central bank facilities). For further discussion of rate formation in a corridor system, see Bindseil, U., Monetary Policy Operations and the Financial System, Oxford University Press, Oxford, 2014.
- See Eisenschmidt, J., Kedan, D., Schmitz, M., Adalid, R. and Papsdorf, P., “The Eurosystem’s asset purchase programme and TARGET balances”, Occasional Paper Series, No 196, ECB, 2017.
- The implication of full fungibility does not stop at borders. In principle, full fungibility (or no fragmentation) implies that interbank rates should be correlated with aggregate excess liquidity levels and not with excess liquidity levels pertaining to smaller subsets of banks, like those located in the same country. Data availability and the nature of fragmentation, which often affects cross-border trades, have driven the focus of this analysis on the country dimension of fragmentation by comparing rates implied by country-level excess liquidity with rates implied by aggregate excess liquidity.
- As explained in Section 3.1 and shown in Chart 3, the shape of the blue line reflects the probability of having to take recourse to one of the standing facilities, which in turn is related to the amount of excess liquidity in the system.
- See “Recent developments in excess liquidity and money market rates”, Monthly Bulletin, ECB, January 2014, pp. 69-82.
- Excess reserves, which are the part of banks’ current accounts not needed to fulfil reserve requirements, averaged €1.2 billion between 2004 and July 2007, while recourse to the deposit facility averaged around €190 million over the same period.
- These rates are identified from TARGET2 transaction data using the method described by Frutos, J.C., Garcia-de-Andoain, C., Heider, F. and Papsdorf, P. in “Stressed interbank markets: evidence from the European financial and sovereign debt crisis”, Working Paper Series, No 1925, ECB, 2016.
- Risk-adjusted rates are calculated by regressing the volume-weighted average TARGET2 borrowing rates for each country on the median CDS spread across banks located in the respective country. Pooled OLS is used to estimate the risk-adjusted rates for vulnerable countries and other countries. The regressions are based on daily data from June 2008 to September 2017. The risk-adjusted rate is computed as the difference between the actual rate on day t and the coefficient estimate multiplied by the country’s median bank-level CDS spread on day t.
- A variety of indicators are used to identify periods of varying length between June 2008 and August 2013 during which money market conditions were relatively calm. In order to assess the state of market fragmentation since the June 2014 package of policy measures was announced, August 2013 is used as a cut-off point for the identification of relatively benign money market conditions. The periods of relatively low overall stress are 1 June-27 August 2008, 1 July 2009-30 June 2011 and 1 January-30 August 2013.
- Looking at interbank volumes would be a simple way to check the driving forces of “renewed” fragmentation due to banks joining the market at higher rates that had previously been excluded due to their risk profile. If the indicator increases because of banks joining, overall volumes should increase and central bank intermediation should decrease.


