- THE ECB BLOG
Stop carbon leakage at the border
Can EU companies be both green and globally competitive?
1 June 2023
Tradeable allowances for carbon emissions set important price incentives for companies to become greener. Unfortunately, evidence shows that many companies move carbon intensive production to other regions, meaning their emissions leak abroad. This ECB Blog post investigates how the EU can strike a balance between green goals and competitiveness.
One of the EU’s most powerful tools to fight climate change is the Emissions Trading System (ETS). It sets a cap on greenhouse gas emissions for a number of industries and provides tradeable emissions allowances to companies. As the EU progressively reduces this cap over time, this pushes up prices for the allowances and strengthens the incentives to avoid emissions. There is both good news and bad news about the ETS. It has contributed to reducing emissions in the EU. But we also find evidence that this came at the cost of a reduced competitiveness in Europe and higher emissions elsewhere in the world. We look at the benefits and costs of the trading system and discuss how to avoid the export of carbon intensive production – what the experts call “carbon leakage”.
The ETS does curb emissions
The trading system is helping to cut greenhouse gas (GHG) emissions in the EU. Our analysis shows that its contribution totals an emissions reduction of 2-2.5 percentage points per year.[1] The system is effective in two distinct ways. First, stricter emissions regulations to make production greener reduce emissions faster. As we cannot measure this stringency directly, we use a proxy: the ratio of traded allowances to the total amount of emissions allowances used by industry. In other words, we assume that a stricter ETS regulation that forces companies to emit fewer GHGs leads to more active trading. Emissions from regulated industries fell by about 2 percentage points for each 1 percentage point increase in our proxy before 2013, and somewhat more after the ETS was reformed in that year. The price mechanism was also effective as higher stringency and higher allowance prices led to faster reductions of emissions.
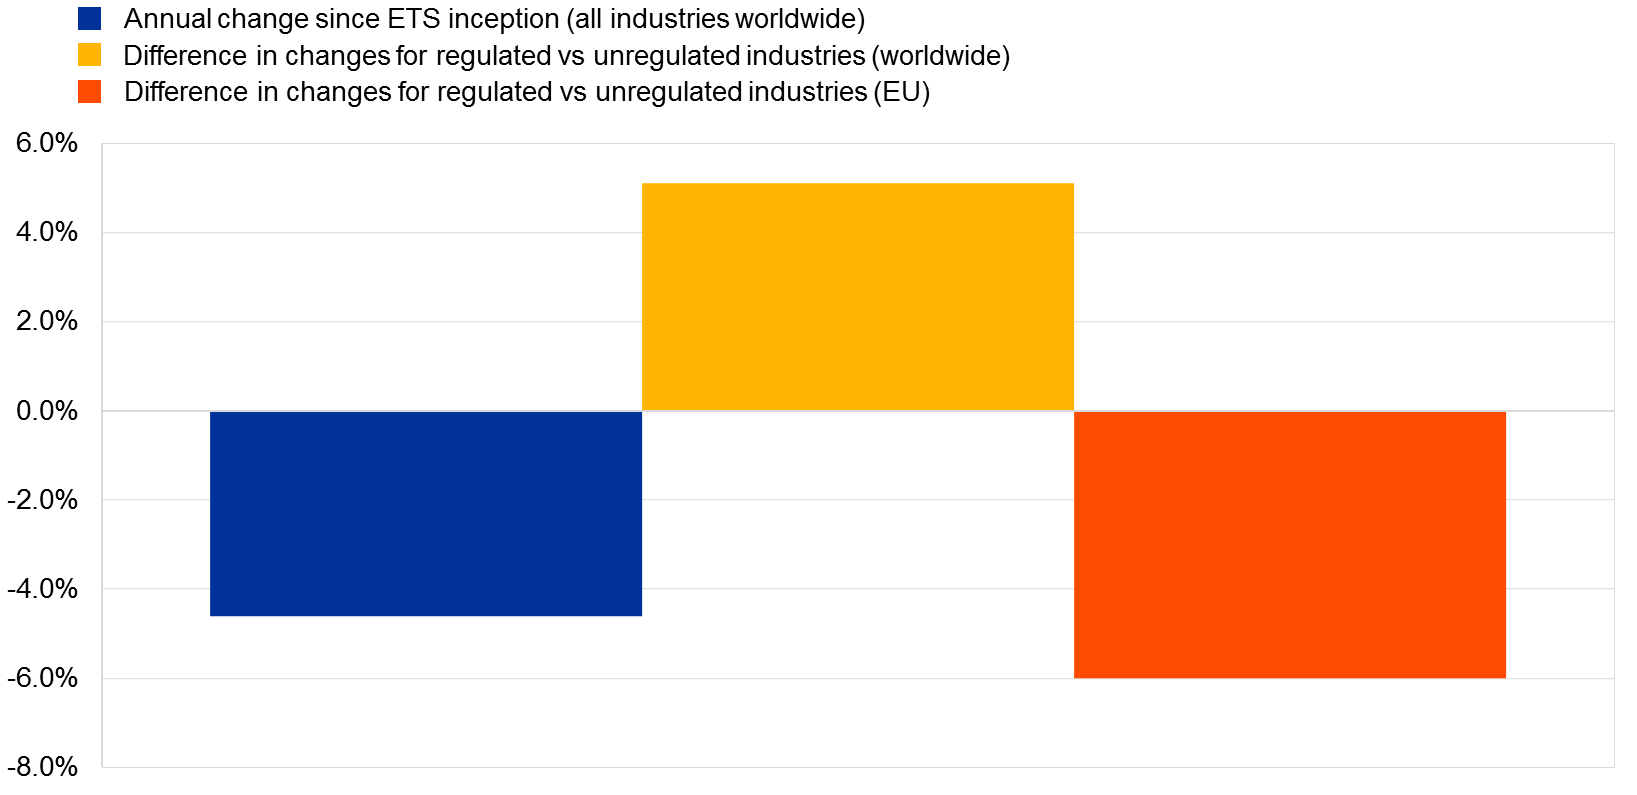
Second, the ETS has a powerful steering role for companies: regulated EU industries have reduced their greenhouse gas emissions more than those industries in the EU that are not subject to the ETS (Chart 1).
Chart 1
Changes in greenhouse gas emissions – ETS-regulated industries vs non-regulated industries in the EU and in other regions

Sources: Tonnes of CO2 equivalent greenhouse gas emissions are from the WIOD environmental account providing it for 56 industries and 43 countries plus the rest of the world for the period 2000-2016.
Notes: The blue bar is the average decline in emissions since ETS inception across all countries and sectors (-4.6 percentage points). The red bar depicts the difference in GHG emissions in ETS sectors globally relative to the average decline. The yellow bar shows the difference in emissions in ETS sectors within the EU relative to average change in emissions of ETS industries.
However, these achievements came at a cost. Contrary to earlier research showing limited empirical evidence of carbon leakages[2], we have found substantial evidence that companies shift carbon-intensive activities with heavy emissions from inside Europe to outside the EU. This runs counter to the EU’s efforts to also help reduce emissions globally. Although global emissions by all industries in all regions have declined since 2005 (blue bar), the global emissions by regulated industries rose above their level until 2005 (yellow bar), and this despite the fact that emissions in the very same industries fell markedly within the EU.
Obviously, such carbon leakages are detrimental to the fight against climate change. One way to address this problem is a carbon border adjustment mechanism (CBAM) on imports.[3] This tool is designed to find the best possible trade-off between reducing carbon emissions and keeping Europe’s producers competitive. It aims to avoid businesses transferring production from countries with strict climate policies to ones with laxer policies, and to thereby minimise carbon leakage.[4]
The current revisions to the ETS include a CBAM on imports of carbon-intensive products that are heavily traded with non-EU Member States. These include cement, iron, steel, aluminium, fertilisers and electricity. This border regime will be phased in to protect EU producers from foreign competition operating in unregulated regions. It will force importers to buy emissions allowances in proportion to the emissions embedded in their imports, at the ETS market price. This means that products will face the same carbon pricing regardless of where they come from and where the relevant greenhouse gasses were emitted. By treating all companies equally when supplying the EU market, the CBAM mitigates possible competitiveness losses.
The effects of the trading system on competition vary depending on the location (inside or outside the EU) and ownership (domestic or multinational companies).[5] We found that companies in the EU which source carbon intensive inputs from within the EU face a competitive disadvantage. This disadvantage grows as the share of carbon intensive inputs sourced within the EU increases. In contrast, those companies which manage to source these inputs from elsewhere perform better, arguably owing to cheaper inputs. This improvement is proportional to the amount of outsourced emission-intensive inputs. In other words: the more those companies source carbon-intensive inputs abroad, the more they can produce as they gain market share.[6]
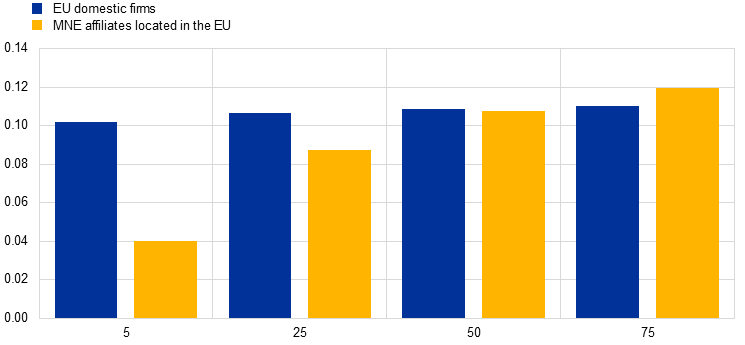
EU companies which are subject to the ETS regulations produce less when they source high-carbon inputs from within the EU, but their production increases when they source them from outside the region. For multinational companies, we see a similar correlation, but the impact of the shift to outside the EU increases rapidly as the price of emissions allowances rises and has topped that of EU domestic companies at current ETS prices (Chart 2).
Chart 2
The effect of shifting purchases of high-emissions inputs from inside to outside the EU

Sources: OECD-AMNE and authors’ estimates.
Notes: The chart depicts the effect on companies’ production of a one percentage point shift of high carbon footprint inputs, across sourcing regions, from inside to outside the EU. For a 10 percentage point shift across regions of high carbon footprint inputs, EU companies expand production by 1 percentage point, compared to a no-shift strategy. This is based on regression analysis (for details see “Benefits and costs of the ETS in the EU, a lesson learned for the CBAM design”). The log value of sectoral production is regressed on country-sector-ownership fixed effects, emission intensity (emissions per euro worth of production), log value of inputs and the four shares of high carbon footprint inputs sourced from Domestic and MNE companies. The coefficients on these four regressors capture the elasticity of sectoral production to emission-intensive inputs depending on the regions in which they originated, e.g. from inside or outside the EU, as well as company ownership. The specification also includes the interaction of these shares with the price paid on allowances in t-1, to capture nonlinearity of the price for allowances. Finally, the specification encompasses deterministic country and industry trends and control for unobserved time heterogeneity. Matching the AMNE and WIOD databases eventually yields 34 sectors and 44 countries (including RoW) spanning the period 2000-16. Regulated (ETS) industries are Coke and refined petroleum products (C19), Basic metals (C24), Other non-metallic mineral products (C23), Electricity, gas, water, waste and remediation (DTE), and Transport and storage (H).
The effectiveness of the ETS in curbing EU greenhouse gas emissions is undeniable. But it comes at the significant cost of making EU companies less competitive, especially those that are domestically owned, as well as triggering carbon leakages. The degree to which EU production is affected depends on a company’s ownership and where it sources emission-intensive inputs. This suggests that some business models with multinational production chains may have more leeway in reorganising and sourcing “dirtier” inputs from outside the EU. The details of the CBAM must be carefully considered to make sure that the new EU environmental legislation prevents this. Based on our analysis we advise that the CBAM be extended to all regulated productions. Our evidence is a call for regulators to carefully establish the terms for the tariff equivalent charged on emissions embedded in imports and for the CBAM industry’s coverage.
Subscribe to the ECB blogSee Boning J., Di Nino v., Folger T., 2023, “Benefits and costs of the ETS in the EU, a lesson learned for the CBAM design”, ECB Working Paper No 2764.
See Chan, H. S. R., S. Li, and F. Zhang (2013): “Firm competitiveness and the European Union emissions trading scheme”, Energy Policy, 63, 1056-1064; Jaraite, J. and C. Di Maria (2016): “Did the EU ETS Make a Difference? An Empirical Assessment Using Lithuanian Firm-Level Data", The Energy Journal, 37, 1-23; Koch, N. and H. Basse Mama (2016): “European climate policy and industrial relocation: Evidence from German multinational firms”; Dechezleprétre, A., Gennaioli, R. Martin, M. Muûls, and T. Stoerk (2019):”Searching for Carbon Leaks in Multinational Companies," CGR Working Paper Series; aus dem Moore, N., P. Grosskurth, and M. Themann (2019): “Multinational corporations and the EU Emissions Trading System: The specter of asset erosion and creeping deindustrialization", Journal of Environmental Economics and Management, 94, 1-26.
See the relevant press release.
For a definition of carbon leakage see Climate EU trading emissions “Carbon leakage refers to the situation that may occur if, for reasons of costs related to climate policies, businesses were to transfer production to other countries with laxer emission constraints. This could lead to an increase in their total emissions. The risk of carbon leakage may be higher in certain energy-intensive industries”.
Data on gross output by country and sector, the share of emission-intensive inputs and imports in total were obtained from the OECD AMNE database, which categorises companies according to domestic and foreign ownership (see Cadestin, De Backer, Desnoyers-James, Miroudot, Rigo and Ye (2018)).
See Boning J., Di Nino v., Folger T., 2023.


