
Update on economic and monetary developments
Summary
While the recovery in global demand and the sizeable fiscal stimulus are supporting global and euro area activity, the near-term economic outlook remains clouded by uncertainty about the resurgence of the pandemic and the roll-out of vaccination campaigns. Persistently high rates of coronavirus (COVID-19) infection and the associated extension and tightening of containment measures continue to constrain economic activity in the short term. Looking ahead, progress with vaccination campaigns and the envisaged gradual relaxation of containment measures reinforce the expectation of a firm rebound in economic activity in the course of 2021. Inflation has picked up over recent months on account of some idiosyncratic and temporary factors and an increase in energy price inflation. At the same time, underlying price pressures remain subdued in the context of significant economic slack and still weak demand.
Preserving favourable financing conditions over the pandemic period remains essential to reduce uncertainty and bolster confidence, thereby underpinning economic activity and safeguarding medium-term price stability. Euro area financing conditions have remained broadly stable recently after the increase in market interest rates earlier in the year, but risks to wider financing conditions remain. Against this background, the Governing Council decided to reconfirm its very accommodative monetary policy stance.
Global economic activity remained on a solid recovery path at the turn of 2020-21, despite the re-intensification of the pandemic. Supplier delivery times have lengthened on the back of strong global demand. The recovery in trade also continued, with merchandise trade remaining the main driving factor, and services trade showing signs of improvement. Global financial conditions continued to be highly accommodative, with equity markets underpinned by optimism about global growth prospects and continued monetary policy support.
Over the review period (11 March to 21 April 2021) the forward curve of the euro overnight index average (EONIA) was broadly unchanged, suggesting no market expectations of an imminent policy rate change in either direction. Long-term sovereign bond yields in the euro area increased somewhat, but have remained relatively stable overall since March. Non-financial corporations’ equity prices increased on both sides of the Atlantic and reached new post-financial crisis highs. In foreign exchange markets, the nominal effective exchange rate of the euro appreciated slightly.
Euro area real GDP declined by 0.7% in the fourth quarter of 2020 to stand 4.9% below its pre-pandemic level one year earlier. Incoming economic data, surveys and high-frequency indicators suggest that economic activity may have contracted again in the first quarter of this year, but point to a resumption of growth in the second quarter. Business surveys indicate that the manufacturing sector continues to recover, supported by solid global demand. At the same time, restrictions on mobility and social interaction still limit activity in the services sector, although there are signs of a bottoming-out. Fiscal policy measures continue to support households and firms, but consumers remain cautious in view of the pandemic and its impact on employment and earnings. Despite weaker corporate balance sheets and elevated uncertainty about the economic outlook, business investment has shown resilience. Looking ahead, the progress with vaccination campaigns, which should allow for a gradual relaxation of containment measures, should pave the way for a firm rebound in economic activity in the course of 2021. Over the medium term the recovery of the euro area economy is expected to be driven by a recovery in domestic and global demand, supported by favourable financing conditions and fiscal stimulus.
Euro area annual inflation increased to 1.3% in March 2021, from 0.9% in February, on account of a strong increase in energy price inflation that reflected both a sizeable upward base effect and a month-on-month increase. This increase more than offset decreases in food price inflation and in HICP inflation excluding energy and food. Headline inflation is likely to increase further in the coming months, but some volatility is expected throughout the year reflecting the changing dynamics of idiosyncratic and temporary factors. These factors can be expected to fade out of annual inflation rates early next year. Underlying price pressures are expected to increase somewhat this year, owing to short-term supply constraints and the recovery in domestic demand, although they remain subdued overall, in part reflecting low wage pressures, in the context of economic slack, and the appreciation of the euro exchange rate. Once the impact of the pandemic fades, the unwinding of the high level of slack, supported by accommodative fiscal and monetary policies, will contribute to a gradual increase in inflation over the medium term. Survey-based measures and market-based indicators of longer-term inflation expectations remain at subdued levels, although market-based indicators have continued their gradual increase.
In February 2021, money growth was robust, driven by domestic credit expansion, especially via Eurosystem asset purchases. While growth in lending to firms has been broadly unchanged since June 2020, loan flows point to a moderation in loan dynamics in recent months as demand for loans has abated, while some signs of a tightening in credit supply have also emerged. The euro area bank lending survey for the first quarter of 2021 reports a moderate tightening of credit standards for loans to firms, following more significant tightening in the previous two quarters. Bank lending rates have continued to hover close to their historical lows.
Against this background, the Governing Council decided to reconfirm its very accommodative monetary policy stance.
First, the Governing Council decided to keep the key ECB interest rates unchanged. They are expected to remain at their present or lower levels until the inflation outlook robustly converges to a level sufficiently close to, but below, 2% within the projection horizon, and such convergence has been consistently reflected in underlying inflation dynamics.
Second, the Governing Council will continue the purchases under the pandemic emergency purchase programme (PEPP) with a total envelope of €1,850 billion until at least the end of March 2022 and, in any case, until the Governing Council judges that the coronavirus crisis phase is over. Since the incoming information confirmed the joint assessment of financing conditions and the inflation outlook carried out at the March monetary policy meeting, the Governing Council expects purchases under the PEPP over the current quarter to continue to be conducted at a significantly higher pace than during the first months of the year.
The Governing Council will purchase flexibly according to market conditions and with a view to preventing a tightening of financing conditions that is inconsistent with countering the downward impact of the pandemic on the projected path of inflation. In addition, the flexibility of purchases over time, across asset classes and among jurisdictions will continue to support the smooth transmission of monetary policy. If favourable financing conditions can be maintained with asset purchase flows that do not exhaust the envelope over the net purchase horizon of the PEPP, the envelope need not be used in full. Equally, the envelope can be recalibrated if required to maintain favourable financing conditions to help counter the negative pandemic shock to the path of inflation.
The Governing Council will continue to reinvest the principal payments from maturing securities purchased under the PEPP until at least the end of 2023. In any case, the future roll-off of the PEPP portfolio will be managed to avoid interference with the appropriate monetary policy stance.
Third, net purchases under the asset purchase programme (APP) will continue at a monthly pace of €20 billion. The Governing Council continues to expect monthly net asset purchases under the APP to run for as long as necessary to reinforce the accommodative impact of its policy rates, and to end shortly before it starts raising the key ECB interest rates.
The Governing Council also intends to continue reinvesting, in full, the principal payments from maturing securities purchased under the APP for an extended period of time past the date when it starts raising the key ECB interest rates, and in any case for as long as necessary to maintain favourable liquidity conditions and an ample degree of monetary accommodation.
Finally, the Governing Council will continue to provide ample liquidity through its refinancing operations. In particular, the latest operation in the third series of targeted longer-term refinancing operations (TLTRO III) has registered a high take-up of funds. The funding obtained through TLTRO III plays a crucial role in supporting bank lending to firms and households.
The Governing Council stands ready to adjust all of its instruments, as appropriate, to ensure that inflation moves towards its aim in a sustained manner, in line with its commitment to symmetry.
1 External environment
Global economic activity continued to expand at a solid pace at the start of 2021, after reaching pre-pandemic levels at the end of 2020. National accounts data confirm a full recovery of global activity (excluding the euro area) in the last quarter of 2020 to its pre-pandemic levels, the resurgence of the pandemic intensity notwithstanding. Moreover, the global composite output Purchasing Managers’ Index (PMI) – excluding the euro area – remained above its long-term average levels in the first quarter of 2021. The latest PMI figures also suggest a further broadening in the recovery of global activity as service sector growth momentum outpaced the solid expansion in manufacturing (Chart 1).
Chart 1
Global output PMI (excluding the euro area)
(diffusion indices)

Sources: Markit and ECB staff calculations.
Note: The latest observations are for March 2021.
Persistent supply bottlenecks represent short-term risks to global activity. As the global economy recovers from the shock caused by the ongoing coronavirus (COVID-19) pandemic, supplier delivery times have lengthened and are now as high as during the peak of the pandemic last spring, particularly for advanced economies, although this time these signal also rising global demand. At the same time, the global PMI input price index has risen sharply, which mainly reflects the demand-driven surge in commodity prices in early 2021.
Further improvements in the global growth outlook and continued policy support underpinned optimism in global financial markets, with financial conditions remaining highly accommodative. Following the Governing Council meeting in mid-March 2021, global equity markets moderately increased, corporate spreads declined and the Cboe Volatility Index (VIX) continued to approach its pre-pandemic levels on the back of further improvements in the global growth outlook. Much of the optimism in global financial markets related to developments in the United States, where a recovery is expected on the basis of strong incoming data and plans for additional fiscal spending. At the same time, monetary policy remained very accommodative across advanced economies. As a result, global financial conditions remained highly accommodative and even loosened slightly further in advanced economies on aggregate.
Incoming data indicate a continued recovery in global trade. Merchandise trade surprised on the upside in January and continued to drive the global trade recovery (Chart 2). Services trade showed signs of improvement but remained subdued at the end of 2020 owing to lockdowns and travel restrictions. The ECB internal trade tracker, based on weekly and monthly short-term trade indicators, points to a continued recovery of global trade in the first quarter of 2021.
Chart 2
Surveys and global trade in goods (excluding the euro area)
(left-hand scale: three-month-on-three-month percentage changes; right-hand scale: diffusion indices)

Sources: Markit, CPB Netherlands Bureau for Economic Policy Analysis and ECB calculations.
Note: The latest observations are for January 2021 for global merchandise imports and March 2021 for PMIs.
Global inflation increased in January. Annual consumer price inflation in the countries of the Organisation for Economic Co-operation and Development (OECD) increased to 1.5% in January, while inflation excluding energy and food rose to 1.7%. Transitory positive base effects are expected in the short term, owing to the initial reaction of prices to the pandemic shock in spring 2020, in particular global commodity prices. Looking ahead, global wage and price pressures are expected to remain relatively contained given that most economies still have ample spare capacity.
Commodity prices have been largely stable since the Governing Council meeting in mid-March after sustained price increases in previous months. With renewed lockdown measures in Europe weighing on short-term demand prospects and new coronavirus variants creating fresh uncertainties, oil prices and non-energy prices have remained broadly stable since mid-March. With demand prospects for 2021 remaining buoyant, however, pressure mounted on OPEC+ to adjust its production targets and to release more barrels onto the markets. The alliance reacted in early April by announcing supply increases for the coming months, including the phasing-out of the voluntary production cuts of 1 million barrels per day by Saudi Arabia.
The recovery in the United States is accelerating amid the fast pace of vaccinations and large fiscal stimulus. A continued strong recovery is expected in the first quarter of 2021, following strong quarter-on-quarter annualised growth of 4.3% in the fourth quarter of 2020. The acceleration of vaccination efforts, fiscal and monetary policy support and a progressive reopening of the economy have all supported activity. The Federal Reserve Bank of New York Weekly Economic Index, which tracks GDP growth using high-frequency indicators, suggests that growth momentum has significantly accelerated since the beginning of March. In particular, disposable income and consumer spending increased substantially in January, boosted by the one-off government stimulus cheques dispensed through the December 2020 fiscal support package, before moderating in February. Additional stimulus cheques sent out since mid-March as part of the American Rescue Plan are expected to stimulate consumption further in the months ahead.
In Japan, economic activity remains resilient amid rising supply constraints. Available high-frequency data signal that the second declaration of a state of emergency weighed on mobility and activity at the turn of the year, particularly in the services sector. After bottoming out in early 2021, economic activity appears to be gradually strengthening, benefiting also from a relatively resilient manufacturing sector. On the external side, the recovery in real exports of goods remained broadly stable at the start of the year, helped by resilient tech exports. Real imports of goods have risen at a fairly robust pace, likely reflecting a solid recovery in domestic demand.
In the United Kingdom, the economy shows signs of a modest recovery despite hard lockdown measures. Monthly GDP increased in February, suggesting that households and businesses have been adapting better to COVID-19-related restrictions than in earlier lockdowns. Against the backdrop of rapid progress in vaccinations, which has allowed mobility restrictions to be gradually eased, business surveys, consumer confidence and mobility trackers have all improved, even before the reopening of non-essential retail stores and hospitality establishments on 12 April.
In China, real GDP grew by 18.3% year on year in the first quarter of 2021. The extraordinary rise in GDP in year-on-year terms is largely due to base effects but confirms the solid recovery of the economy in the aftermath of the COVID-19 pandemic. Applying a crude measure to filter out base effects results in an implied annualised growth rate of over 5% between the first quarter of 2019 and the first quarter of 2021, close to the pre-pandemic trend. At the industry level, the secondary sector outperformed the rest of the economy amid strong export demand, while retail sales figures for March, released together with GDP, point to a strengthening in the recovery of consumption.
2 Financial developments
The EONIA and the new benchmark euro short-term rate (€STR) averaged -48 and -57 basis points respectively over the review period (11 March to 21 April 2021).[1] Excess liquidity increased by approximately €339 billion to around €4,030 billion, mainly reflecting asset purchases under the pandemic emergency purchase programme (PEPP) and the asset purchase programme (APP), as well as the TLTRO III.7 operation take-up of €330.5 billion. The latter was partially offset by autonomous factors and expiring TLTRO II operations.
The EONIA forward curve remained broadly unchanged over the review period. The trough of the curve, which is 2 basis points below the current (21 April) EONIA level of -48 basis points, is reached in May 2022. The forward curve does not currently suggest market expectations of an imminent policy rate change in either direction, and EONIA forward rates remain below zero for horizons up to mid-2026. This reflects continued market expectations of a prolonged period of negative interest rates.[2]
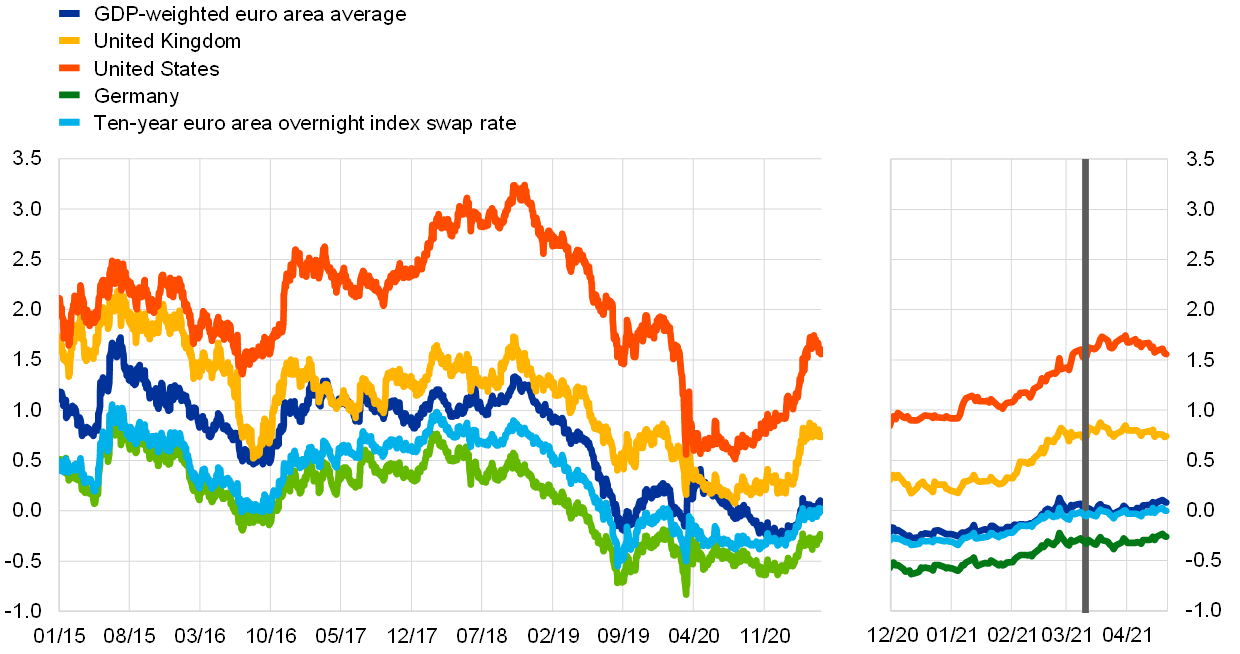
At the long end, sovereign bond yields in the euro area increased slightly, but remained at low levels overall (Chart 3). The GDP-weighted euro area and the German ten-year sovereign bond yields increased by 9 and 7 basis points to 0.08% and -0.26% respectively, showing little reaction to the March meeting of the Governing Council or to adverse pandemic-related news such as resurgent COVID-19 case numbers, renewed lockdowns in many euro area countries and temporary setbacks in national vaccination campaigns. Ten-year sovereign bond yields in the United Kingdom remained unchanged at 0.74% while those in the United States increased only marginally, by 2 basis points to 1.56%, after having reached a value of 1.74% earlier in April.
Chart 3
Ten-year sovereign bond yields
(percentages per annum)
Sources: Refinitiv and ECB calculations.
Notes: Daily data. The vertical grey line denotes the start of the review period on 11 March 2021. The zoom window shows developments in sovereign yields since 1 December 2020. The latest observations are for 21 April 2021.
Euro area sovereign bond spreads relative to risk-free rates remained relatively stable. Specifically, ten-year German, French and Spanish spreads moved by 1, 3 and 3 basis points respectively to reach -0.26, -0.01 and 0.40 percentage points, while the Italian spread increased by 9 basis points to stand at 0.76 percentage points. Consequently, the GDP-weighted euro area ten-year sovereign spread increased by 3 basis points to 0.08 percentage points, which is still below its pre-pandemic level of February 2020. In general, all euro area spreads experienced a slight decline in the weeks immediately after the March Governing Council meeting before increasing again towards the end of the review period.
Equity prices of non-financial corporations reached new post-financial crisis highs on both sides of the Atlantic, while euro area bank equity prices saw prior gains reverse towards the end of the review period. Despite adverse pandemic-related news coming from several euro area countries, euro area NFC stock market indices rose by 3.8% to now stand slightly above their pre-pandemic levels and at post-financial crisis highs. By contrast, euro area bank equity prices decreased by 1.5% after reaching new highs during the review period. US equities, which have repeatedly posted record highs since mid-2020, continued to rise, with NFC and bank equity prices increasing by 5.3% and 0.6% respectively.
Euro area corporate bond spreads edged down further to pre-pandemic levels in all sectors. Spreads on both investment-grade NFC bonds and financial sector bonds (relative to the risk-free rate) decreased by about 10 basis points to stand at 50 and 60 basis points.
In foreign exchange markets, the euro appreciated slightly in trade-weighted terms (see Chart 4). Over the review period, the nominal effective exchange rate of the euro, as measured against the currencies of 42 of the euro area’s most important trading partners, appreciated by 0.6%. This development reflected a moderate appreciation against several major currencies, including the pound sterling (by 0.7%), the Chinese renminbi (by 0.5%) and the US dollar (by 0.3%). Over the review period, the euro first depreciated against the US dollar on the back of the broad-based strength of the dollar, but later recovered as the dollar declined alongside US Treasury yields. The euro appreciated strongly against the Turkish lira (by 10.3%) and the Russian rouble (by 4.6%) amid their recent broad-based volatility. The euro depreciated slightly against the Swiss franc (by 0.4%) and the currencies of several non-euro area EU Member States, including the Hungarian forint, the Czech koruna and the Polish zloty.
Chart 4
Changes in the exchange rate of the euro vis-à-vis selected currencies
(percentage changes)

Source: ECB.
Notes: EER-42 is the nominal effective exchange rate of the euro against the currencies of 42 of the euro area’s most important trading partners. A positive (negative) change corresponds to an appreciation (depreciation) of the euro. All changes have been calculated using the foreign exchange rates prevailing on 21 April 2021.
3 Economic activity
Following the strong rebound in euro area output in the third quarter of 2020, economic growth turned negative again in the fourth quarter, with continued weak prospects for the first quarter of 2021. Total economic activity contracted by 0.7%, quarter on quarter, in the final quarter of 2020, following the strong rebound of 12.5% in the third quarter (Chart 5). The expenditure breakdown shows that the decline in output was concentrated mainly in the domestic demand components, particularly consumption, with domestic demand (excluding inventories) subtracting 1.3 percentage points from quarterly GDP growth, while net trade made a neutral contribution. Changes to inventories made a positive contribution of 0.6 percentage points, largely reflecting a faster than expected recovery in demand for manufactured goods in the third quarter, leading to re-stocking in the fourth quarter. Hard data, survey results and high-frequency indicators point, on balance, to a possible renewed decline in GDP in the first quarter of this year, which would be broadly in line with expectations, reflecting the intensification of containment measures as a result of the renewed rise in infection rates.[3] The relative strength of output compared with the first wave of the pandemic probably reflects less stringent containment measures in combination with increased learning and adaptation by households and firms. Growth dynamics in the euro area are expected to remain uneven across sectors, with the services sector continuing to be more affected by the pandemic, in part as a result of its sensitivity to social distancing measures. The same is true across countries, with developments in output being dependent on infection rates and efforts to contain the pandemic as well as the sectoral composition of the respective economy.
Chart 5
Euro area real GDP, the composite output PMI and the ESI
(left-hand scale: quarter-on-quarter percentage changes; right-hand scale: diffusion index)

Sources: Eurostat, European Commission, Markit and ECB calculations.
Notes: The two lines indicate monthly developments; the bars show quarterly data. The Economic Sentiment Indicator (ESI) has been standardised and rescaled so that it has the same mean and standard deviation as the Purchasing Managers’ Index (PMI). Dotted lines show quarterly averages of monthly PMI observations. The latest observations relate to the fourth quarter of 2020 for real GDP and March 2021 for the ESI and the PMI.
The unemployment rate in the euro area remained unchanged in February, as high numbers of workers covered by job retention schemes contributed to keeping unemployment contained. The unemployment rate stood at 8.3% in February, unchanged from the previous month (Chart 6), and still around 1 percentage point higher than the rate seen in February 2020. Job retention schemes continued to cushion developments in the labour market, covering an estimated 5.6% of the labour force in February, up from around 5% in October in response to the latest lockdown measures.[4] Employment increased by 0.3% in the fourth quarter of 2020 following a decline of 1.0% in the third quarter. Despite that improvement, employment was still 1.9% lower than in the fourth quarter of 2019. Total hours worked declined again by 1.7% in the fourth quarter. This follows a rebound of 14.5% in the third quarter after having declined by 13.6% and 3.9% in the second and first quarter respectively. The large declines in total hours worked in the first half and the fourth quarter of 2020 reflect the impacts of lockdown measures in these periods. The level of total hours worked remained 6.5% below the level recorded in the fourth quarter of 2019.
Chart 6
Euro area employment, the PMI employment indicator and the unemployment rate
(left-hand scale: quarter-on-quarter percentage changes, diffusion index; right-hand scale: percentages of the labour force)

Sources: Eurostat, Markit and ECB calculations.
Notes: The two lines indicate monthly developments; the bars show quarterly data. The Purchasing Managers’ Index (PMI) is expressed as a deviation from 50 divided by 10. The latest observations relate to the fourth quarter of 2020 for employment, March 2021 for the PMI and February 2021 for the unemployment rate.
Short-term labour market indicators have continued to improve. The monthly PMI employment indicator increased to 52.0 in March from 50.5 in February (Chart 6), remaining above the threshold level of 50 – indicating an expansion in employment – for two consecutive months. The last recording above this threshold dates to February 2020. The PMI for employment has recovered significantly since recording an all-time low in April 2020.
After a weak start, consumer spending remained tepid at the end of the first quarter. In February 2021 the volume of retail trade increased by 3%, month on month, while car registrations continued to decline by 1.1%, month on month, remaining at their lowest point since June 2020. Consumer confidence improved in March, to stand at -10.8 compared with -14.8 in February, largely on account of the forward-looking survey questions. For example, households’ spending plans on major items increased in March but remained well below their pre-crisis level. The tightening of containment measures again around Easter foreshadows a renewed decline in consumer spending at the start of the second quarter, delaying the expected recovery. While labour income has been severely affected by the coronavirus crisis, fiscal transfers have absorbed most of the impact on euro area households’ disposable income. The fall in consumption in the fourth quarter of 2020 was reflected in an increase in the household saving rate, which rose to 20% in that quarter, up from 17% in the third quarter. Looking ahead, the saving rate is likely to remain above its pre‑pandemic level in the short term before gradually normalising thereafter, as is also suggested by households’ subdued expectations for making major purchases in the next 12 months.
Corporate investment is likely to have grown modestly in the first quarter of 2021, but elevated uncertainty and weakened balance sheets may weigh on investment decisions later this year. Following a robust quarterly growth rate of 3.1% in the fourth quarter of 2020, mostly driven by intellectual property products, non-construction investment appears to have remained resilient in the first quarter of 2021. While industrial production of capital goods fell back in February, its average value in January and February was 2.0% higher than the level seen in the fourth quarter. Moreover, both the PMI and the European Commission’s survey indicators for the capital goods sector tended to improve in the first quarter relative to the fourth quarter. Survey indicators by asset type suggest that investment in tangibles, such as machinery, equipment and transport, has recovered strongly following the sharp fall observed in the second quarter of 2020. However, the rebound remains incomplete when compared with pre-pandemic levels. Intangible investment fared comparably better during the crisis and reached in the fourth quarter of 2020 almost the same level as in the fourth quarter of 2019 (if one looks through the quarterly volatility related to the accounting of intellectual property activities of a few global firms, which particularly affects some countries such as Ireland and the Netherlands). This confirms evidence, from corporate contacts, of an ongoing digitalisation trend. Meanwhile, uncertainty is still high and corporate balance sheets remain strained, which could weigh on investment later this year. National accounts data for the fourth quarter of 2020 indicate that the euro area corporate gross operating surplus fell by 2.7% year on year and indebtedness increased.
Housing investment is expected to remain resilient in the first quarter of 2021, amid significant uncertainty induced by renewed tightening of pandemic-related restrictions. After a strong rebound in the third quarter of 2020, housing investment continued to increase in the fourth quarter, although its momentum slowed down markedly. Recent short-term indicators and survey results suggest a pattern of continued growth moderation for the first quarter of 2021. The index for construction production fell in February, with its average value in January and February standing 0.4% below the level seen in the fourth quarter of 2020. At the same time, the PMI for construction output, especially in the residential segment, improved in the first quarter of 2021, although remaining in contractionary territory. The European Commission’s construction confidence indicator also rose above its level in the previous quarter, standing well above its long-run average in the first quarter of the year. According to the European Commission’s survey data on factors limiting production, supply-side factors, such as weather conditions and the availability of labour and materials, hindered construction activity at the start of the year. Demand-side constraints, however, were less relevant, which is also in line with the further improvement in firms’ assessments of order book levels. Nevertheless, according to the Bank Lending Survey, demand for housing loans moderated in the first quarter of 2021, albeit with expectations of a further increase in the second quarter.
The recovery in euro area trade has slowed, partly owing to Brexit. Nominal trade in goods reflect a divergence of extra and intra-euro area goods trade at the beginning of 2021, as repercussions from the United Kingdom leaving the European Union negatively affected extra-euro area trade. Bilateral trade between the euro area and the United Kingdom contracted significantly in January reflecting a reversal of stockpiling in December and additional administrative burdens for exports and imports. Despite a partial rebound in trade with the United Kingdom extra-euro area exports remained weak in February. By contrast, intra-euro area exports expanded robustly in the first two months of 2021. The recovery towards pre-pandemic levels of trade with major export markets is continuing, while the rest of the world has remained a drag on overall exports. Euro area exports to China kept their strong momentum, mainly driven by car exports but also extending to other goods categories, while exports to the United States have returned to the pre-pandemic level on the back of car and consumer goods exports. The latest readings of leading indicators point to a resumption of the dynamics in goods trade while the recovery in services trade remains protracted. Tourism, which has been the sector in services trade most affected by the pandemic, shows early signs of recovery from lows reached at the end of 2020. While cross-border flights remained depressed in March, forward bookings and confidence in the accommodation sector have started to improve again.
Mirroring the prevailing containment measures, economic indicators point to weak, possibly falling, output in the first quarter of 2021 followed by a resumption of growth in the second quarter. Industrial production (excluding construction) fell by 1.0%, month on month, in February, although the average level of production in the first two months of the first quarter was still 1.0% above the average for the fourth quarter of 2020. More recent survey data show a gradual strengthening in economic activity across sectors in the period ahead. For instance, the composite output PMI rose to 49.9 in the first quarter of 2021, up from 48.1 in the fourth quarter of 2020. This improvement was explained by developments in both manufacturing and services. Economic indicators covering the first quarter point to continued weak growth – possibly negative ‒ reflecting the intensification of containment measures in some countries towards the end of the quarter. High‑frequency indicators also point, on balance, to continued weak, albeit slightly improving, growth going forward.
Looking ahead, amid elevated uncertainty, the ongoing progress in vaccination campaigns should set the ground for a recovery in economic activity over the course of 2021, even if a full recovery remains some way off. The implementation timeline for relaxing containment measures is not yet clear and further adverse developments relating to the pandemic cannot be ruled out. While this uncertainty surrounding COVID‑19 is likely to dampen the recovery in the labour market and weigh on consumption and investment, the economic recovery in the euro area should be supported by favourable financing conditions, an expansionary fiscal stance and a recovery in domestic and global demand as containment measures are lifted and uncertainty recedes. The results of the latest round of the Survey of Professional Forecasters (which was conducted in early April) show that private sector GDP growth forecasts have been revised downwards for 2021 and upwards for 2022, relative to the previous round (which was conducted in early January). Forecasters foresee a 0.6% decline in GDP in the first quarter of 2021, followed by a rebound of 1.4% in the second quarter. This is broadly in line with the short-term outlook foreseen by the March 2021 ECB staff macroeconomic projections, which envisaged a 0.4% decline in the first quarter of 2021 followed by a 1.3% increase in the second quarter. This short-term growth profile is consistent with the current situation in terms of containment measures alongside improving momentum in ongoing vaccination campaigns. Over the medium term, the euro area recovery is expected to be driven by a recovery in global and domestic demand, supported by favourable financing conditions and fiscal stimulus.
4 Prices and costs
HICP inflation increased sharply at the start of 2021 compared with the end of last year (Chart 7). After standing for four consecutive months at -0.3% towards the end of last year, HICP inflation increased at the beginning of this year to 1.3% in March, following rises of 0.9% in January and February. The increase in headline inflation in March reflected a further strong increase in energy inflation, which more than offset decreases in food inflation and HICP inflation excluding energy and food (HICPX). HICPX inflation fell to 0.9% in March from 1.1% in February and 1.4% in January but remained substantially higher than the figure of 0.2% recorded in the last four months of 2020 (Chart 9).
Chart 7
Headline inflation and components
(annual percentage changes and percentage point contributions)

Sources: Eurostat and ECB staff calculations.
Note: The latest observation is for March 2021.
The upswing in headline inflation in recent months reflected several factors which can be considered mostly temporary and are partly of a statistical nature. The strongest upward impact was associated with the successively less negative and then strongly positive energy inflation. This development reflected both a sizeable upward base effect and relatively large month-on-month increases in energy prices. If current futures prices hold, this upward impact can be expected to stay in the data for most of 2021 and then diminish early next year (Box 4). Another upward impact was associated with the reversal in January of the temporary VAT rate cut in Germany, which will continue to have an impact on inflation rates throughout 2021. Finally, there were two other factors that were particularly prominent in January, but which had receded by March. The first regards the changes in the timing and magnitude of seasonal sales in some euro area countries, which led to a substantial rise in non-energy industrial goods (NEIG) inflation. The second is the impact of stronger than usual changes in HICP weights for 2021 associated with changes in household consumption patterns during the pandemic. In particular, this led to increases in some parts of services inflation in January and February, which then lessened substantially in March (Chart 8).
Chart 8
Weight change impact decomposition
(percentage point contributions)

Sources: Eurostat and ECB staff calculations.
Notes: The impact of the changes in weights is based on ECB estimates. The latest observation is for March 2021.
Uncertainty surrounding the signal for price pressures remained relatively elevated given that price imputations also continued to prevail in February and March. The share of price imputations for HICP items decreased slightly in March to 10% for headline HICP and 15% for HICPX, with this decline mainly reflecting lower imputations for NEIG items, while imputations for services increased slightly. In particular, the share of imputations for non-energy industrial goods declined substantially (standing at just 4% in March compared with 15% in February), whereas that for services remained elevated (21% in March and 20% in February).
Measures of underlying inflation increased in January before weakening somewhat in February and March (Chart 9). Most measures were affected by the temporary factors discussed above and are therefore subject to some uncertainty in terms of signalling. In February and March the exclusion-based measures of inflation, HICPX and HICPXX (also excluding clothing and travel-related items), declined from the uptick observed in January, returning to the levels seen in spring 2020 before the impact of the VAT rate cut in Germany took effect. Other measures of underlying inflation have shown a more continuous pick-up since the end of 2020, but this started from relatively low levels and, overall, the available measures of underlying inflation do not provide a broad-based signal of a sustained rise in underlying inflationary pressures.
Chart 9
Measures of underlying inflation
(annual percentage changes)

Sources: Eurostat and ECB calculations.
Note: The latest observations are for March 2021.
Price pressures remained stable at the later stages of the supply chain for non-energy industrial goods, despite a further build-up of global cost pressures. For non-food consumer goods, domestic producer price inflation was 0.6% in February, slightly down from January, but continuing to hover close to its long-term average. Import price inflation for non-food consumer goods remained at low levels in February and broadly unchanged from the previous two months. It is likely that this also reflects the stability of the nominal effective exchange rate. At the earlier input stages, both producer and import price inflation for intermediate goods continued to increase in February. It is likely that this reflected the sharp increase in the year-on-year growth rates of oil prices and industrial raw material prices and, to some extent, costs associated with frictions in supply chains. However, business expectations for selling prices in coming months do not point to a broad-based surge in prices across the supply and pricing chain going forward.
Wage pressures appear to be weak and continue to be blurred by the impact of government support schemes. This is reflected, for instance, in the divergence between growth in compensation per employee and growth in compensation per hour. The gap between the two again widened in the fourth quarter of 2020, as the take-up of short-time work and temporary lay-off schemes increased owing to the renewed lockdown measures at the end of the year. On the one hand, annual growth in compensation per employee increased slightly to 0.7% in the fourth quarter, up from 0.6% in the third quarter, following a very negative rate of -4.5% in the second quarter. On the other hand, annual growth in compensation per hour rebounded to 5.1% in the fourth quarter, up from 3.4% in the third quarter of 2020 (Chart 10).
Chart 10
Breakdown of compensation per employee by compensation per hour and hours worked
(annual percentage changes; percentage point contributions)

Sources: Eurostat and ECB calculations.
Note: The latest observations are for the fourth quarter of 2020.
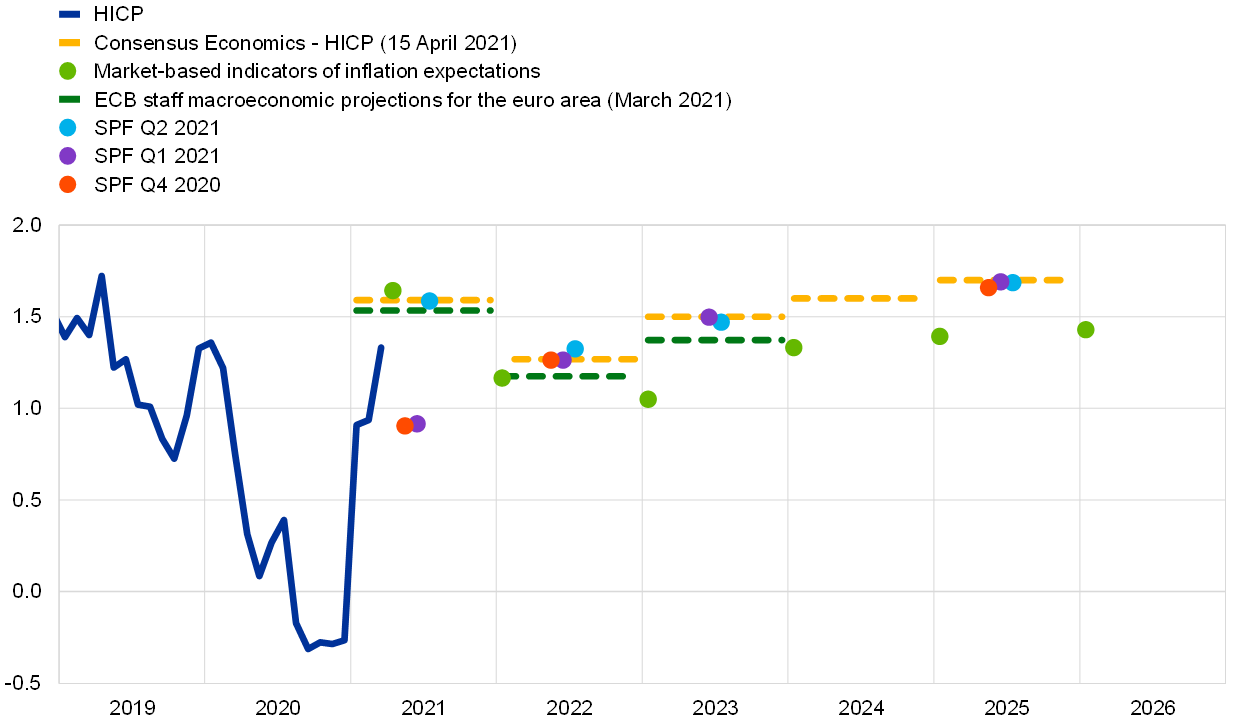
Survey-based indicators of long-term inflation expectations remained stable, while market-based indicators of inflation expectations continued to rise. The increase in both shorter and longer-term euro area market-based indicators of inflation expectations that started in early 2021 continued following the March meeting of the Governing Council, despite the increase in COVID-19 cases in Europe and temporary setbacks in the vaccination process. The most prominent forward inflation-linked swap rate, the 5-year inflation linked forward swap in 5 years, currently stands at 1.53%, 8 basis points higher compared with the beginning of the review period. With regard to survey-based measures, according to the ECB Survey of Professional Forecasters, average longer-term inflation expectations for 2025 remained unchanged in April at 1.7%. Longer-term expectations reported in the April 2021 forecast by Consensus Economics were also unchanged at 1.7% for 2025 (Chart 11).
Chart 11
Survey and market-based indicators of inflation expectations
(annual percentage changes)
Sources: Eurostat, Thomson Reuters, Consensus Economics, ECB staff macroeconomic projections for the euro area (March 2021), ECB SPF and ECB calculations.
Notes: The SPF for the second quarter of 2021 was conducted between 31 March and 12 April 2021. The market-implied curve is based on the one-year spot inflation rate and the one-year forward rate one year ahead, the one-year forward rate two years ahead, the one-year forward rate three years ahead and the one-year forward rate four years ahead. The latest observations for market-based indicators of inflation expectations are for 21 April 2021.
5 Money and credit
Broad money growth remained stable in February 2021. The annual growth rate of M3 decreased somewhat to 12.3% in February, after 12.5% in January (Chart 12), thus remaining elevated as it still incorporates the impact of the exceptional monetary expansion in the early phases of the coronavirus (COVID-19) pandemic. Shorter-run dynamics of broad money, such as monthly flows, have moderated, but still imply a robust pace of money creation on the back of the support provided by monetary, fiscal and prudential policies. The main driver of M3 growth was the narrow aggregate M1, which includes the most liquid components of M3. The annual growth rate of M1 remained broadly unchanged at 16.4% in February. This development was mainly attributable to firms and households, which increased deposits at a strong pace, similar to the second half of 2020. The contribution of other short-term deposits and marketable instruments to annual M3 growth was small, reflecting the low level of interest rates and the search-for-yield behaviour of investors.
Money creation continued to be driven by domestic credit expansion, mainly via Eurosystem asset purchases. In February 2021, the largest contribution to M3 growth again came from the Eurosystem’s net purchases of government securities under the asset purchase programme (APP) and the pandemic emergency purchase programme (PEPP) (red portion of the bars in Chart 12). Further support for M3 growth came from credit to the private sector (blue portion of the bars in Chart 12) and, to a lesser and declining extent, from credit to general government from banks (light green portion of the bars in Chart 12). Net external monetary flows continued to have a small impact on money creation (yellow portion of the bars in Chart 12). Longer-term financial liabilities and other counterparts continued to dampen broad money growth. This effect has diminished compared to the second half of 2020, as the net issuance of long-term bank bonds, which depresses M3 growth, was contained by banks’ recourse to targeted longer-term refinancing operations (TLTROs) in view of their attractive conditions.
Chart 12
M3 and its counterparts
(annual percentage changes; contributions in percentage points; adjusted for seasonal and calendar effects)

Source: ECB.
Notes: Credit to the private sector includes monetary financial institution (MFI) loans to the private sector and MFI holdings of securities issued by the euro area private non-MFI sector. As such, it also covers the Eurosystem’s purchases of non-MFI debt securities under the corporate sector purchase programme and the PEPP. The latest observations are for February 2021.
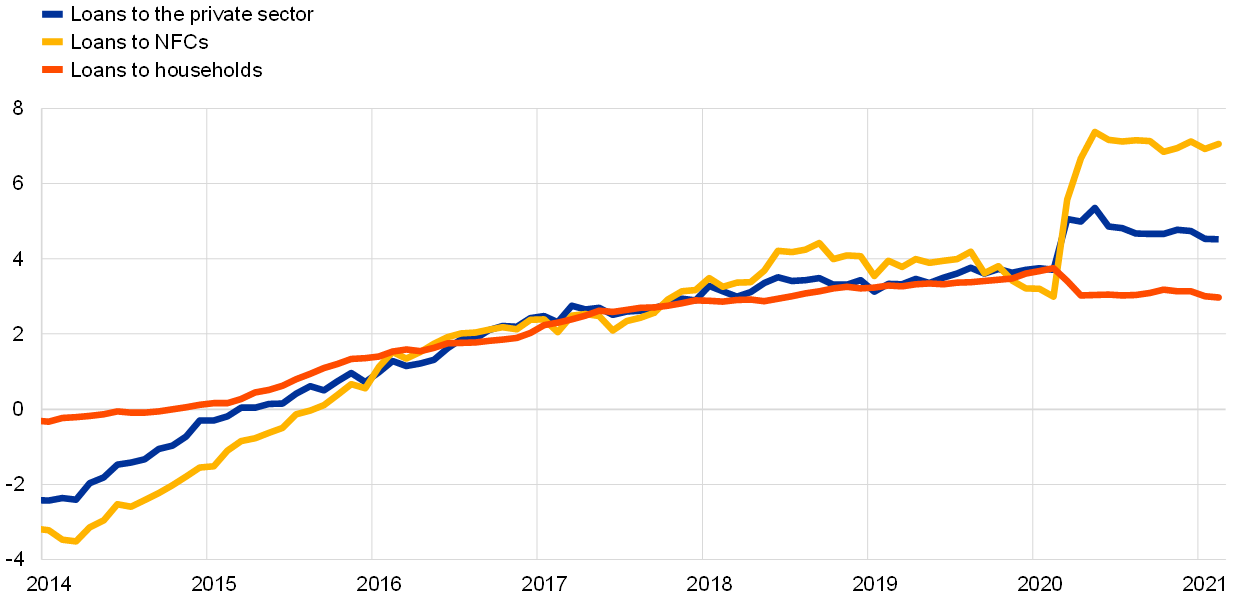
Loan growth to the private sector remained broadly unchanged in February 2021. The annual growth rate of bank loans to the private sector stood at 4.5% in February, broadly unchanged since the summer and well above its pre-pandemic level (Chart 13). The annual growth rate of loans to firms stood at 7.1% in February, after 6.9% in January, while growth in loans to households was unchanged at 3.0%. While these growth rates have been broadly stable since June 2020, data on flows point to a moderation in loan dynamics as firms’ demand for loans has abated, while some signs of a tightening in credit supply have also emerged. Firms’ reliance on longer-term loans has continued to increase at the expense of shorter-term loans. At the same time, mortgage lending continued to drive household borrowing in February, while consumer credit growth remained weak, with tighter COVID-19-related restrictions limiting consumption opportunities.
Chart 13
Loans to the private sector
(annual percentage changes)
Source: ECB.
Notes: Loans are adjusted for loan sales, securitisation and notional cash pooling. The latest observations are for February 2021.
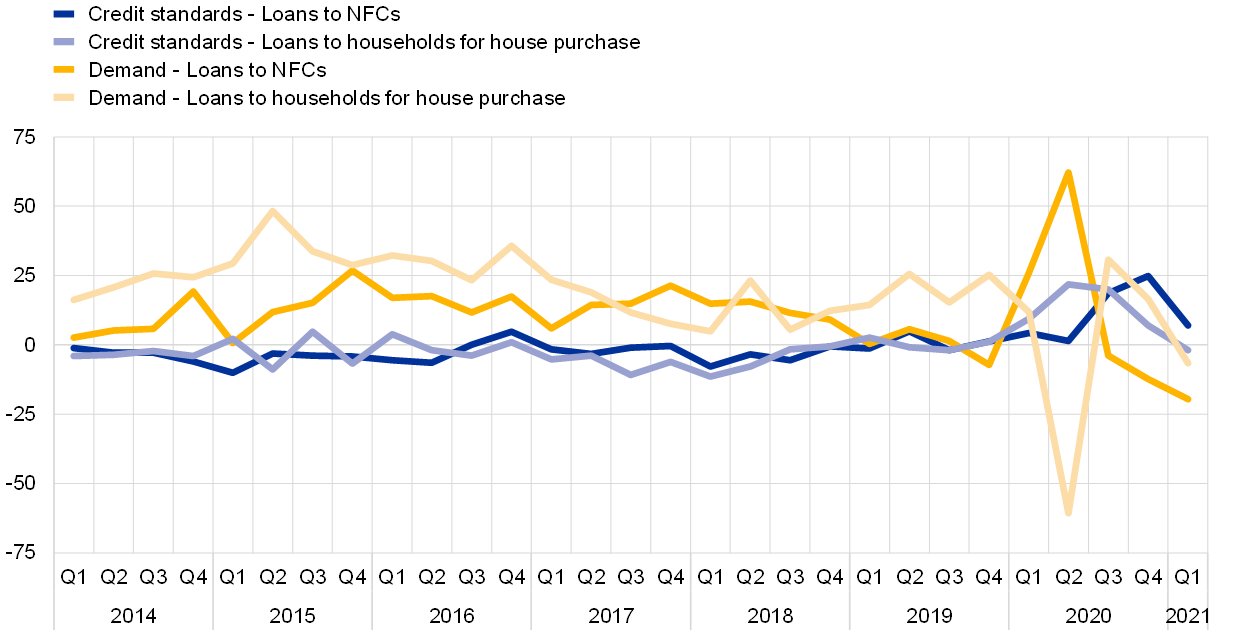
The April 2021 euro area bank lending survey showed a moderate net tightening of credit standards on loans to firms in the first quarter of 2021 (Chart 14). This followed a significant tightening in the previous two quarters and was driven by higher risk perceptions and lower risk tolerance among banks, albeit less so than during the previous two quarters. The lower net tightening may be related to the prolongation of fiscal support measures, the continued support from monetary policy and supervisory measures, and the broader improvement in risk sentiment in the first quarter of 2021. Firms’ demand for loans or drawing of credit lines declined again in the first quarter of 2021, mainly driven by a continued dampening impact of firms’ demand for financing fixed investment, as firms, especially in sectors more affected by the pandemic, tended to postpone investment. For the second quarter of 2021, banks expect a rebound in loan demand from firms and a further modest tightening of credit standards for firms. Banks reported a very modest easing of credit standards for housing loans and a moderate tightening of credit standards for consumer credit in the first quarter of 2021. The net easing for housing loans was supported by competition from other lenders, while risk perceptions related to borrowers’ creditworthiness and banks’ risk tolerance continued to have a tightening impact on all lending to households. Net demand for housing loans declined in the first quarter. Weak consumer confidence and low spending on durables contributed negatively to net demand, while the low general level of interest rates and solid housing market prospects contributed positively. Banks expect a net tightening of credit standards and an increase in demand for loans to households in the second quarter of 2021. In addition, banks reported that the APP, the PEPP and the third series of TLTROs (TLTRO III) continued to have a positive impact on their liquidity position and market financing conditions. Together with the negative deposit facility rate (DFR), these measures had an easing impact on bank lending conditions and a positive impact on lending volumes. At the same time, banks suggested that the ECB’s asset purchases and the negative DFR continued to have a negative impact on their net interest income, while the ECB’s two-tier system for remunerating excess liquidity holdings supported bank profitability.
Chart 14
Changes in credit standards and net demand for loans (or credit lines) to enterprises and households for house purchase
(net percentages of banks reporting a tightening of credit standards or an increase in loan demand)
Source: ECB (euro area bank lending survey).
Notes: For the bank lending survey questions on credit standards, ”net percentages” are defined as the difference between the sum of the percentages of banks responding “tightened considerably” or “tightened somewhat” and the sum of the percentages of banks responding “eased somewhat” or “eased considerably”. For the survey questions on demand for loans, “net percentages” are defined as the difference between the sum of the percentages of banks responding “increased considerably” or “increased somewhat” and the sum of the percentages of banks responding “decreased somewhat” or “decreased considerably”. The latest observations are for the first quarter of 2021.
Bank lending rates continued to hover close to their historical lows. In February 2021 the composite bank lending rate for loans to non-financial corporations (NFCs) remained broadly unchanged at 1.48%, and for loans to households it reached a new historical low of 1.31% (Chart 15). This development reflects the continued impact of the policy measures taken by the ECB, supervisors and national governments to support credit supply conditions and was widespread across euro area countries. Firms’ real cost of bank financing converged back towards its early 2020 level, supported by the recent rebound in inflation expectations. Moreover, the spread between bank lending rates on very small loans and those on large loans stabilised at pre-pandemic levels. At the same time, uncertainty regarding the lasting impact of the pandemic on the economy, and thus also on borrowers’ creditworthiness and bank balance sheets, remains high. In order to avoid this uncertainty precipitating a broad-based tightening of financing conditions, amplifying the economic impact of the pandemic, all current policy support measures remain essential.
Chart 15
Composite bank lending rates for NFCs and households
(percentages per annum)

Source: ECB.
Notes: Composite bank lending rates are calculated by aggregating short and long-term rates using a 24-month moving average of new business volumes. The latest observations are for February 2021.
Boxes
1 What is driving the recent surge in shipping costs?
In the second half of 2020 global economic activity and trade staged a sharp rebound driven mainly by the manufacturing sector, while services sector activity was and has remained subdued. In the third quarter of 2020 global economic activity recovered swiftly as a result of the easing of the pandemic and associated containment measures as well as the significant policy support deployed at the peak of the crisis. Despite a slowdown in the last quarter of the year, reflecting a worsening of the pandemic, the pace of the global economic recovery in the second half of 2020 was overall stronger than initially estimated (ECB 2021, IMF 2021).[5] It was driven to a significant extent by the manufacturing sector (Chart A, upper panel), as production activities restarted and the demand for goods recovered. At the same time the services sector, and especially the most contact-intensive activities, lagged behind owing to continued social distancing and some remaining limitations. These also hit the travel and tourism sectors particularly hard. Following the collapse in global trade in the first half of 2020 (ECB 2020), global merchandise imports recovered, and by November 2020 they had reached their pre-crisis level again. [6] However, the recovery has progressed at different speeds across countries, with China – the first country to bring the virus under control – already returning to its pre-crisis level in June 2020 (Chart A, lower panel). It was only towards the end of the year that the recovery in trade started to spread to other key global economies.
More2 Main findings from the ECB’s recent contacts with non-financial companies
This box summarises the results of contacts between ECB staff and representatives of 66 leading non-financial companies operating in the euro area. The exchanges took place between 23 March and 1 April 2021.[7]
More3 Macroeconomic implications of heterogeneous long-term inflation expectations: illustrative simulations through the ECB-BASE
This box explores how heterogeneous expectations across agents can change the macroeconomic outcomes of an increase in long-term inflation expectations. Over the recent period, long-term inflation expectations of financial market participants, which can be measured either from financial market instruments like inflation-linked swaps (ILS) or from surveys of professional forecasters, have been rising. As shown in Chart A, between the fourth quarter of 2020 and the first quarter of 2021, inflation expectations increased only slightly according to the ECB Survey of Professional Forecasters (SPF), while this pattern was more pronounced for market-based measures.[9] In assessing the macroeconomic implications of a rise in long-term inflation expectations, a critical factor with regard to the propagation mechanism is whether other sectors of the economy (notably households and firms) share the same expectations as priced by financial markets. This issue is explored through the lens of the ECB-BASE[10] model, conducting illustrative simulations where the agents modelled have different perceptions of a shift in long-term inflation expectations.
More4 Recent dynamics in energy inflation: the role of base effects and taxes
Energy price developments have caused a pronounced pick-up in euro area headline HICP inflation over recent months. This box reviews the factors behind the 11-percentage point swing in energy inflation between December 2020 and March 2021 (which accounted for 1.1 percentage points of the corresponding swing in headline HICP inflation), with a particular focus on oil prices, base effects and the impact of indirect taxation, and discusses their implications for the outlook.
MoreArticles
1 Understanding post-referendum weakness in UK import demand and UK balance of payments risks for the euro area
The UK referendum on EU membership in 2016 has set the course for the most significant change to the relationship between the United Kingdom and its closest trading partners for decades. The primary interest from the ECB’s perspective is to understand the likely impact on trade of the departure of the United Kingdom from the European Union, as the United Kingdom has long been one of the euro area’s major export markets.
More2 The role of households in financing government debt in the euro area
The coronavirus (COVID-19) pandemic has reinvigorated interest in how governments finance their spending to an extent not seen since the global financial and euro area sovereign debt crises of 2008-12. Economic crises of such depth require governments to take decisions on how far the crisis-related costs should be financed by spending cuts elsewhere in the budget, by revenue increases and/or by incurring additional debt. At the same time increases in government debt raise questions as to the optimal financing strategy in terms of instruments and maturities, but also the investor base.
More3 Liquidity usage in TARGET2
Real-time gross settlement (RTGS) systems typically require large amounts of liquidity to support the settlement of payments on a gross basis.[13] At the same time, settling on a gross basis[14] benefits the payment system by reducing credit risk[15] and, more generally, systemic risk. For these reasons, TARGET2[16], the Eurosystem’s RTGS system that processes euro-denominated payments in central bank money, also settles payments on a gross basis. To enable participants to optimise the use of liquidity and reduce their liquidity needs, TARGET2 offers a number of features, called liquidity-saving mechanisms.[17] In addition, when liquidity on their accounts is not sufficient, TARGET2 participants can make use of the intraday credit line (ICL) facility, which is offered by the Eurosystem against eligible collateral and is interest free.
MoreStatistics
Statistical annex© European Central Bank, 2021
Postal address 60640 Frankfurt am Main, Germany
Telephone +49 69 1344 0
Website www.ecb.europa.eu
All rights reserved. Reproduction for educational and non-commercial purposes is permitted provided that the source is acknowledged.
This Bulletin was produced under the responsibility of the Executive Board of the ECB. Translations are prepared and published by the national central banks.
The cut-off date for the statistics included in this issue was 21 April 2021.
For specific terminology please refer to the ECB glossary (available in English only).
PDF ISSN 2363-3417, QB-BP-21-003-EN-N
HTML ISSN 2363-3417, QB-BP-21-003-EN-Q
- The methodology for computing the EONIA changed on 2 October 2019; it is now calculated as the €STR plus a fixed spread of 8.5 basis points. See the box entitled “Goodbye EONIA, welcome €STR!”, Economic Bulletin, Issue 7, ECB, 2019.
- This assessment reflects information from the latest survey results and empirical estimates of “genuine” rate expectations, i.e. forward rates net of term premia.
- Real GDP declined further by 0.6%, quarter on quarter, in the first quarter of 2021 according to Eurostat’s preliminary flash estimate, which was released on 30 April 2021, i.e. after the cut-off date for data included in this issue of the Economic Bulletin.
- See the article entitled “The impact of the COVID-19 pandemic on the euro area labour market”, Economic Bulletin, Issue 8, ECB, 2020.
- See Box 2 in “ECB Macroeconomic Staff Projections for the Euro area”, March 2021, and “World Economic Outlook Update”, January 2021.
- See Box 2 “The great trade collapse of 2020 and the amplification role of global value chains”, Economic Bulletin, Issue 5, ECB, July 2020.
- For further information on the nature and purpose of these contacts, see the article entitled “The ECB’s dialogue with non-financial companies”, Economic Bulletin, Issue 1, ECB, 2021.
- The authors would like to thank Alice Carroy for her valuable research assistance and contribution to this box.
- Inflation expectations may also be measured through business and household surveys: on the latter, see the article entitled “Making sense of consumers’ inflation perceptions and expectations – the role of (un)certainty”, Economic Bulletin, Issue 2, ECB, 2021.
- See Angelini, E., Bokan, N., Christoffel, K., Ciccarelli, M. and Zimic, S., “Introducing ECB-BASE: The blueprint of the new ECB semi-structural model for the euro area”, Working Paper Series, No 2315, ECB, September 2019.
- We would like to thank Florian Forsthuber for data assistance and Andrejs Semjonovs (now Latvijas Banka) for earlier input.
- The authors of this article are members of one of the user groups with access to TARGET2 data in accordance with Article 1(2) of Decision ECB/2010/9 of the European Central Bank of 29 July 2010 on access to and use of certain TARGET2 data. The ECB, the Market Infrastructure Board and the Market Infrastructure and Payments Committee have checked this article against the rules for guaranteeing the confidentiality of transaction-level data established by the Market Infrastructure Board pursuant to Article 1(4) of the above-mentioned Decision.
- An additional characteristic of RTGS systems is that payments are settled on a continuous basis, i.e. in real time. As soon as a payment is settled, it becomes final and irrevocable, hence liquidity can immediately be reused by the recipient.
- For a payment to be settled on a gross basis, i.e. one by one, sufficient liquidity needs to be on the debited account, i.e. the account of the sender of the payment.
- Credit risk is the risk that a counterparty, whether a participant or other entity, will be unable to fully meet its financial obligations when they fall due or at any time in the future.
- For more details about TARGET2, how it works and its relevance for credit institutions in the euro area, see the article entitled “Liquidity distribution and settlement in TARGET2”, Economic Bulletin, Issue 5, ECB, 2020.
- For example, a well-known liquidity-saving mechanism is the multilateral offsetting algorithm that matches and offsets payments between multiple participants, thus reducing their liquidity needs.