The mechanical impact of changes in oil price assumptions on projections for euro area HICP energy inflation
Published as part of the ECB Economic Bulletin, Issue 1/2019.
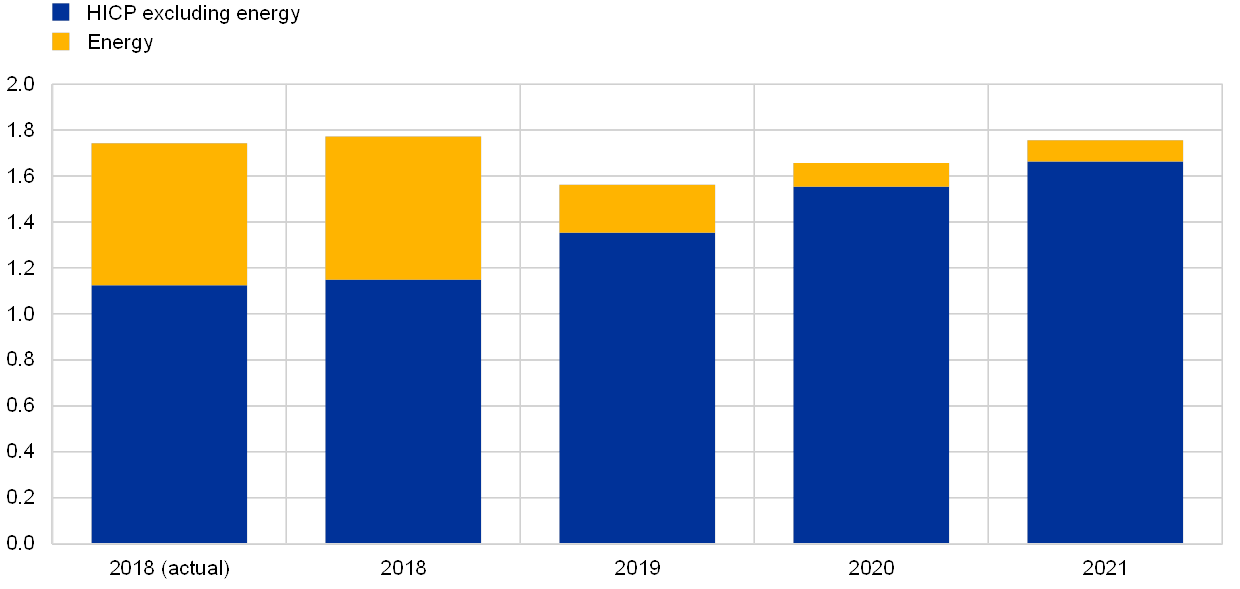
Inflation projections are based on models, assumptions and expert judgement. These include assumptions regarding the future evolution of oil prices. In the case of the Eurosystem/ECB projection exercises, the inflation projections are based on the assumption that oil prices will evolve in line with the average futures prices observed over a two-week period prior to the projection cut-off date. Using the oil price futures has an important bearing on the projections for HICP energy inflation. For instance, the pattern of HICP inflation in the December 2018 Eurosystem staff projections entailed, among other things, a strong decline in the contribution of energy inflation, from 0.6 percentage point in 2018 to 0.2 percentage point in 2019 and 0.1 percentage point in 2020 and 2021 (see Chart A).[1] However, the cut-off date for the assumptions underlying these projections was 21 November 2018, and oil prices and their corresponding futures paths fell significantly after this date. While they have recovered somewhat lately compared with the end of 2018, they remain on balance substantially below the levels on the cut-off date. This box documents the mechanical implications of a shift in the oil price assumptions for the projections of the energy component of HICP inflation.
Chart A
Contribution of energy inflation to headline inflation in the December 2018 Eurosystem staff projections
(percentage points)

Sources: Eurostat, Eurosystem and ECB calculations.
Note: The first bar refers to actual Eurostat data for 2018. The other bars refer to the December 2018 Eurosystem projections.
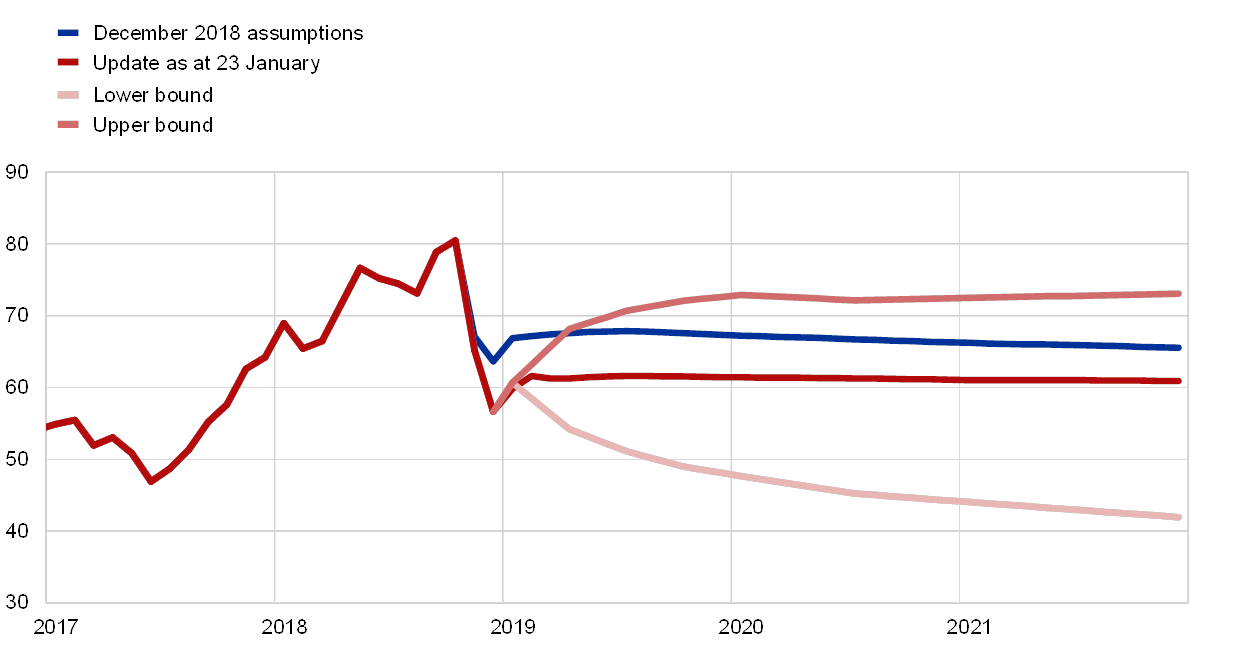
Oil prices and oil futures have moved down significantly since autumn 2018. Energy inflation declined from 10.7% in October 2018 (the latest available data in the December 2018 Eurosystem staff projections) to 5.4% in December 2018. Latest oil futures[2] data see oil prices hovering around USD 61 per barrel in 2019, which is 9% below the December 2018 projection assumptions for the average for that year (see Chart B). For the latter part of the projection horizon, the updated oil futures curve has a slightly upward-sloping shape, as compared with the slightly downward-sloping one seen at the time of the latest projection exercise, but in terms of annual growth rates this makes little difference beyond 2019.
Chart B
Oil price futures
(USD per barrel)

Sources: Morningstar Global Market Data and ECB calculations.
Note: The lower (upper) bound is the 25th (75th) percentile of the distribution provided by the option-implied densities for the oil price on 23 January 2019.
Energy prices mirror oil price developments closely, but there is some deviation between the two. This is because energy items such as gas and electricity have a looser relationship with oil prices than do fuels (for which the relationship is very close). Moreover, the impact of taxes and margins also plays an important role in shaping energy price developments.[3] Nevertheless, developments in the annual rate of change in oil prices are typically a fairly reliable gauge for developments in the annual rate of change in energy prices (see Chart C).
Chart C
Oil prices and energy prices
(annual percentage changes)

Sources: Eurostat, Bloomberg and ECB calculations.
Notes: The annual rates of change in oil prices were calculated on spot prices and on futures prices as at 21 November 2018, the cut-off date for the assumptions for the December 2018 Eurosystem staff macroeconomic projections for the euro area, and updated with futures prices as at 23 January 2019. The updated assumption for the EUR/USD exchange rate for 2019 corresponds to the average over the two-week period ending on 23 January (1.14 USD per euro), which is 0.5% above the December 2018 hypothesis. This means that almost all of the change in oil prices in euro corresponds to the downward shift of the oil price futures curve in USD.
The implications of the recent oil price developments are a reminder of the uncertainty regarding energy inflation projections. The option-implied density distribution of oil prices is wide (see the bands in Chart B), corresponding to an interquartile range of between around USD 53 per barrel and USD 69 per barrel on average in 2019 (22% below and 2% above the assumptions underlying the December 2018 Eurosystem staff projections). Cross-sectional distributions of future oil prices in expectation surveys offer another way to look at the uncertainty surrounding the projections for energy inflation. For instance, on average, the participants in the ECB’s Survey of Professional Forecasters for the first quarter of 2019[4] expected oil prices to stand at around USD 64 per barrel in 2019 (implying a steeper upward path than the oil futures curve), with a one standard deviation range in individual expectations of around USD 5 per barrel.
Overall, changes in oil prices also have a notable impact beyond energy prices. It is important to bear in mind that changes in oil prices not only have direct effects on energy prices, they also have indirect effects on other consumer prices via cost and demand channels. While the cost advantage of lower oil prices may to some extent be passed on to consumer prices, the increase in purchasing power can be expected to support consumption and economic activity more generally, thereby exerting – with some delay – upward pressure on consumer prices. In addition, it is important to monitor to what extent oil price changes may influence inflation expectations. The full impact of changes in oil prices therefore needs to be assessed in the context of a fully-fledged projection exercise.
- See the article entitled “December 2018 Eurosystem staff macroeconomic projections for the euro area”, published on the ECB’s website on 13 December 2018.
- As at the cut-off date of 23 January.
- For more details see the box entitled “The role of energy prices in recent inflation outcomes: a cross-country perspective”, Economic Bulletin, Issue 7, ECB, 2018.
- The survey was conducted between 7 and 11 January 2019.


