Supply chain bottlenecks in the euro area and the United States: where do we stand?
Published as part of the ECB Economic Bulletin, Issue 2/2022.
Strains in global supply chains of goods have been weighing on the global business cycle since late 2020. Supply chain bottlenecks stem from the interplay of several factors. First, the strong rebound in global demand for manufacturing goods, in part induced by the rotation of consumption away from services in the context of the pandemic-related containment measures, was not matched by an equal increase in the supply of goods. Second, some sectors have been hit by severe supply shortages, particularly of semiconductors, with supply struggling to accommodate the surge in demand for electronic products and equipment, and in the automotive sector, which is gradually recovering after a sharp drop in output in 2020. Finally, disruptions in the logistics industry – resulting primarily from container vessel activity, port congestion and strict lockdown measures in some key Asian countries that produce intermediate inputs – further exacerbated supply bottlenecks.[1]
Given the multifaceted nature of supply bottlenecks, monitoring a relatively large set of indicators is useful for tracking their causes. This can make it easier to identify any signs of improvement or deterioration in specific economic sectors at an earlier stage. To this end, this box assesses the severity of supply bottlenecks by looking at a comprehensive set of indicators covering the manufacturing and services sectors, as well as transportation and commodity prices.[2]
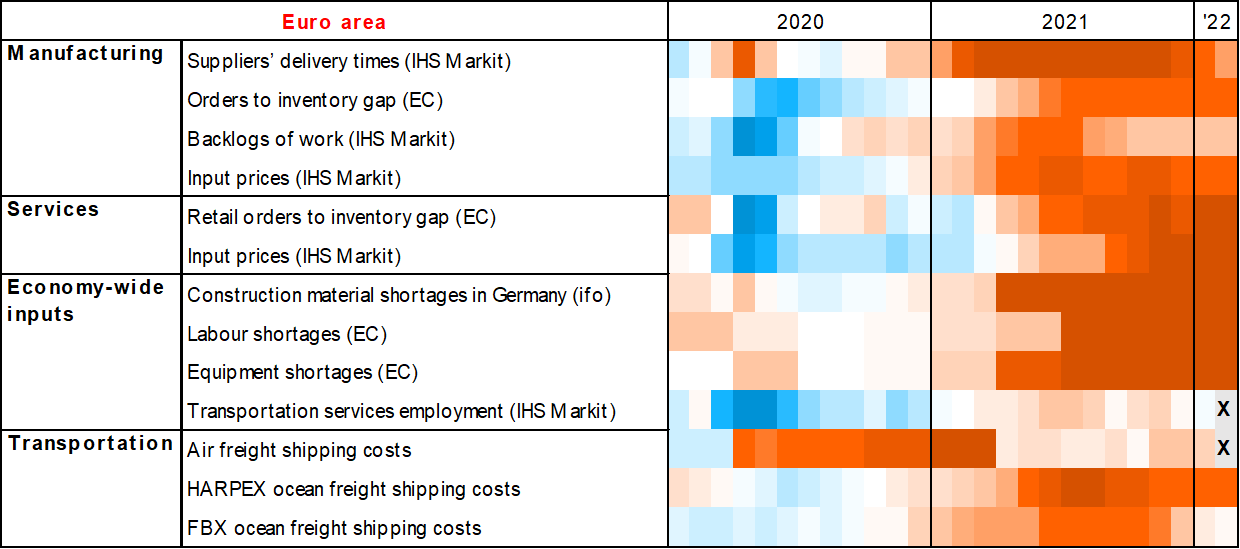
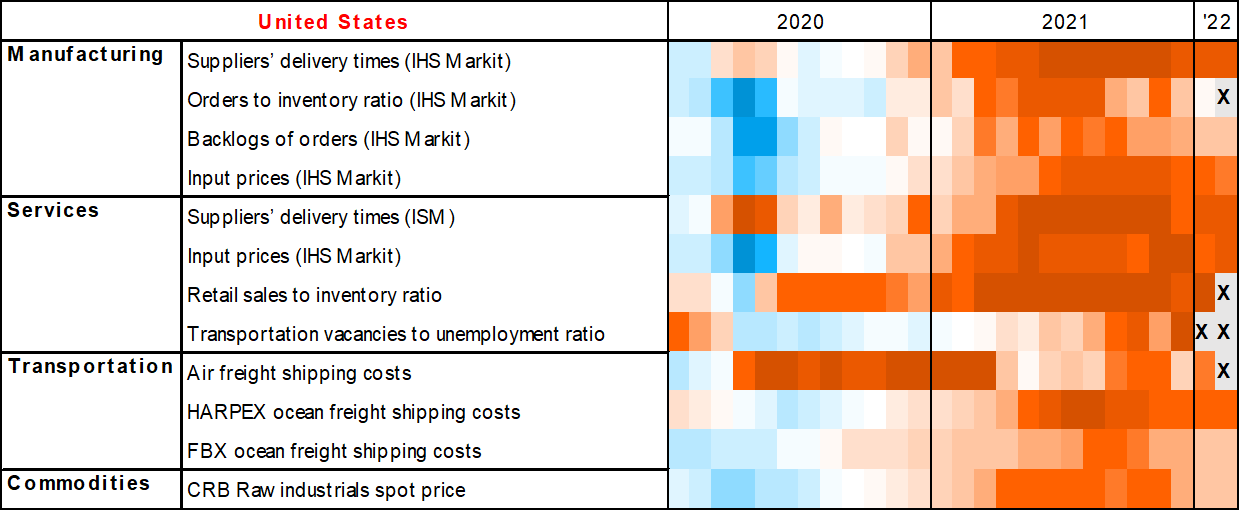
In what follows, sectoral indicators of supply bottlenecks for the euro area and the United States are represented in the form of heatmaps. While the selection of indicators is subject to data availability, for both regions the heatmaps include the Purchasing Managers’ Indices (PMIs) for suppliers’ delivery times (SDT), backlogs of work, the orders-to-inventories ratio and intermediate input prices. Where the information is available, the corresponding PMIs for the services sector are also included. In addition, the heatmaps cover transportation costs, which are represented by the freight rates associated with air freight and ocean freight. In the case of ocean freight, a distinction needs to be made between the costs associated with containers and with dry bulk shipping. While dry bulk shipping is used for transporting commodities, container ships are commonly employed to transport intermediate and finished goods. Therefore, the cost of container shipping is more relevant for assessing the severity of current supply bottlenecks, since the constraints appear to have been mostly affecting intermediate and finished goods. For this reason, the heatmaps rely on the Harper Petersen (HARPEX) shipping cost index, which tracks global changes in charter rates for container ships, and the Freightos Baltic Index (FBX), which measures “directional” container freight rates from China to the EU and the United States.[3] The euro area heatmap also measures economy-wide shortages of inputs (e.g. labour, equipment and construction materials, with the latter being available for Germany only) from surveys, in order to capture the ongoing supply chain disruptions from the viewpoint of affected firms. For the United States, the ratio of vacancies to unemployment in the transportation sector is included to capture labour shortages in the logistics sector. In order to allow for comparisons between different indicators, the Z-scores are computed by subtracting the sample mean from each time series and dividing the difference by the sample standard deviation. Positive values of each indicator represent how many standard deviations each index is above the average, whereas negative values represent how many standard deviations each index is below the average. Negative Z-scores, which indicate a supply-demand deficit, would point to supply bottlenecks and are highlighted in red. Broadly speaking, Z-scores below -1.5 would suggest that supply bottlenecks are tight.
Recent data suggest that supply bottlenecks in the euro area and the United States remain at historically high levels. The heatmaps (Chart A), which range from dark blue (abundant supply relative to demand) to dark red (supply shortages), show that all indicators moved to a shade of red over the course of 2021 and mostly remained in the red in both economies in January/February 2022. In general, the situation remains difficult, particularly in the euro area. This was recently corroborated by our regular survey of contacts in the corporate sector, who indicated that supply issues have generally not eased over recent months and are expected to continue throughout 2022.[4] In particular, supply constraints caused by disruptions to transportation and logistics are more pervasive and are likely to be more persistent in the absence of any softening of global demand.
Chart A
Supply chain pressures – heatmaps for the euro area and the United States
(Z-scores)


Sources: U.S. Bureau of Labor Statistics, European Commission (EC), ISM, IHS Markit, ifo Institute, Bloomberg and ECB staff calculations.
Notes: The heatmaps show Z-scores, which are computed by subtracting the mean from the observation at time t and dividing the difference by the standard deviation. The mean and the standard deviation are computed over the available sample from January 1999. For transportation costs and commodity prices, Z-scores based on year-on-year growth rates are shown. Soft indicators are shown together with their sources. Observations marked with an X are not yet available.
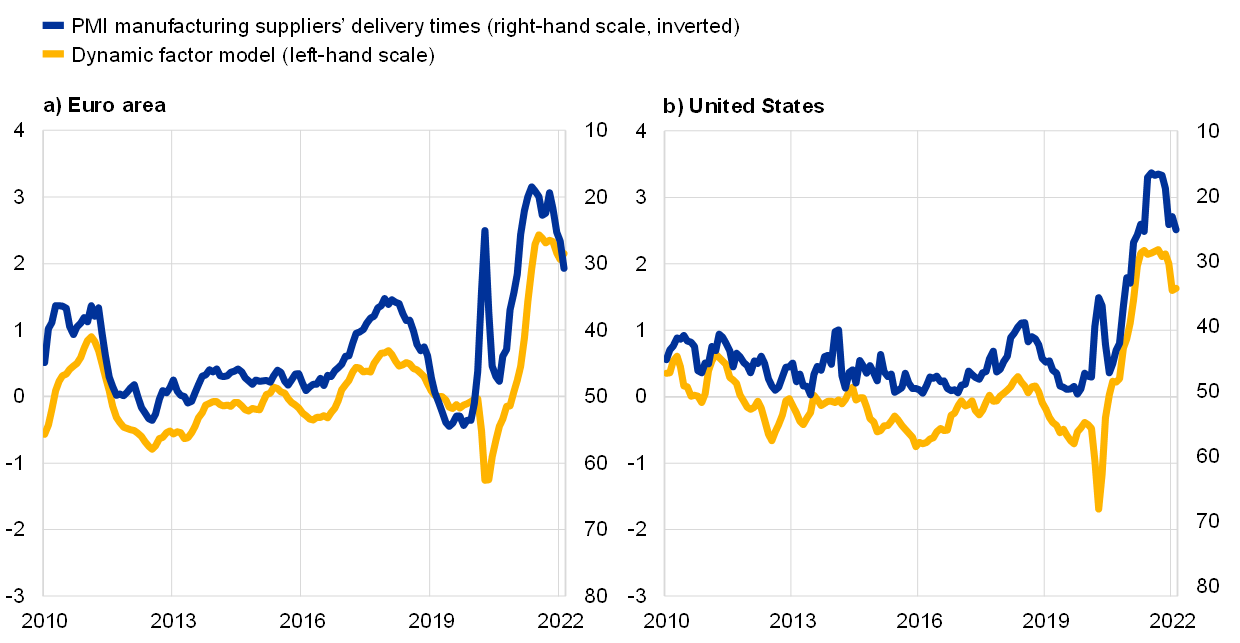
The summary indicators derived from the heatmap confirm that there are continuing pressures resulting from supply chain disruptions, although these pressures may be easing in some sectors. The PMI SDT is a useful indicator for monitoring supply disruptions in the logistics sector.[5] To summarise the evidence from the other measures, a single summary indicator is constructed using a dynamic factor model (DFM).[6] The first factor of the DFM, which accounts for over 50% of the total variance in the underlying indicators, is highly correlated with the PMI SDT in both the euro area and the United States (Chart B), thus capturing a similar pattern in supply bottlenecks. The January/February 2022 data for the PMI SDT and the DFM suggest that supply chain pressures, while still historically high, have peaked and started to ease in both economies (Chart B). Particularly in the United States, the PMI orders-to-inventories ratio is improving, which suggests that firms are starting to rebuild inventories and that bottlenecks may be easing. However, the spread of the Omicron variant of COVID-19, and the potential closure of factories and ports as a result of this, casts further uncertainty, especially in the near term. In particular, there might be setbacks to supply chains if China continues to adhere to a strict zero-COVID strategy. The war in Ukraine may also lead to a reintensification of supply bottlenecks.
Chart B
Supply chain pressures in the euro area and the United States
(left-hand scale: standard deviations from the long-term mean, right-hand scale: diffusion index)

Sources: U.S. Bureau of Labor Statistics, European Commission, ISM, IHS Markit, ifo Institute, Haver Analytics, Bloomberg and ECB staff calculations.
Notes: The DFM includes only monthly indicators (euro area labour and equipment shortages, at quarterly frequency, are not included). Appropriate transformations have been applied to the series to ensure stationarity. The latest observations are for February 2022.
- For a detailed analysis of these factors and their economic impact, see Lane, P.R., “Bottlenecks and monetary policy”, The ECB Blog, ECB, 10 February 2022, and the following boxes entitled: “What is driving the recent surge in shipping costs?”, Economic Bulletin, Issue 3, ECB, 2021; “The semiconductor shortage and its implication for euro area trade, production and prices”, Economic Bulletin, Issue 4, ECB, 2021; “The impact of supply bottlenecks on trade”, Economic Bulletin, Issue 6, ECB, 2021; and “Sources of supply chain disruptions and their impact on euro area manufacturing”, Economic Bulletin, Issue 8, ECB, 2021.
- A similar approach was proposed by Van Roye, B., Murray, B. and Orlik, T., “Supply chain crisis risks taking the global economy down with it”, Bloomberg, November 2021; and Benigno, G., di Giovanni, J., Groen, J.J.J. and Noble, A.I., “A new barometer of global supply chain pressures”, New Liberty Street Economics, Federal Reserve Bank of New York, January 2022.
- It is not unusual to monitor the Baltic Dry Index. However, this index is constructed to track only the cost of shipping commodities (such as coal, ore and grain), which seem to have been less affected by supply bottlenecks.
- With regard to firms’ views on the persistence of supply constraints, see the box entitled “Main findings from the ECB’s recent contacts with non-financial companies”, Economic Bulletin, Issue 1, ECB, 2022.
- The PMI SDT provides the percentage of companies reporting an improvement, deterioration or no change in the delivery times for intermediate and finished goods. An index below 50 implies that delivery times have deteriorated relative to the previous month.
- To test the reliability of the data, a summary statistic – based on a principal component model – has also been computed, and this provides very similar results. The advantage of a DFM over a principal component model is that it makes it possible to deal with data gaps using the estimated common component (see Stock, J.H. and Watson, M.W., “Macroeconomic Forecasting Using Diffusion Indexes”, Journal of Business & Economic Statistics, Vol. 20, Issue 2, 2002, pp. 147-162; and Doz, C., Giannone, D. and Reichlin, L., “A two-step estimator for large approximate dynamic factor models based on Kalman filtering”, Journal of Econometrics, Vol. 164, Issue 1, 2011, pp. 188-205). Therefore, the DFM also includes the FBX shipping cost indices, which have only been available since 2016.


