New pension fund statistics
Published as part of the ECB Economic Bulletin, Issue 7/2020.
1 Introduction and relevance of pension funds
Pension funds play an important role in the euro area economy. They provide an opportunity for households to save for retirement and, at the same time, help the efficient allocation of long-term capital. Pension-related assets are typically one of the main assets of households (representing around 20% of euro area households’ net financial wealth), particularly in countries where occupational pensions are prevalent.
The new pension fund[1] statistics combine data on the different pension schemes in euro area countries in one harmonised set of statistics. They offer a much enhanced set of information, essential for monitoring the development of pension funds from the perspective of monetary policy, financial stability and financial structures. Pension schemes that are provided through governments (e.g. social security schemes[2]) and pension plans offered by insurance corporations are excluded from the scope of the Regulation. The first reporting of pension fund statistics from national central banks to the ECB in line with the Regulation began with quarterly data on assets and liabilities for the third quarter of 2019 and with annual data on number of pension scheme members for 2019. The first public release of the pension funds dataset took place on 31 July 2020 on the ECB’s Statistical Data Warehouse (SDW)[3] platform.
Pension funds have grown substantially in the euro area over the past two decades in terms of their financial assets and as a percentage of GDP. Euro area pension fund assets have almost doubled in size since 2008, with total assets currently amounting to approximately €3 trillion and almost doubling their percentage relative to euro area GDP from 13% in 2008 to 25% in 2019 (see Chart 1). By comparison, according to OECD data, the value of US private pension fund assets was equivalent to around 140% of GDP in 2018.[4]
Chart 1
Total assets of euro area pension funds
(left-hand scale: total assets, EUR billions; right-hand scale: percentage of euro area GDP)

Source: ECB calculations.
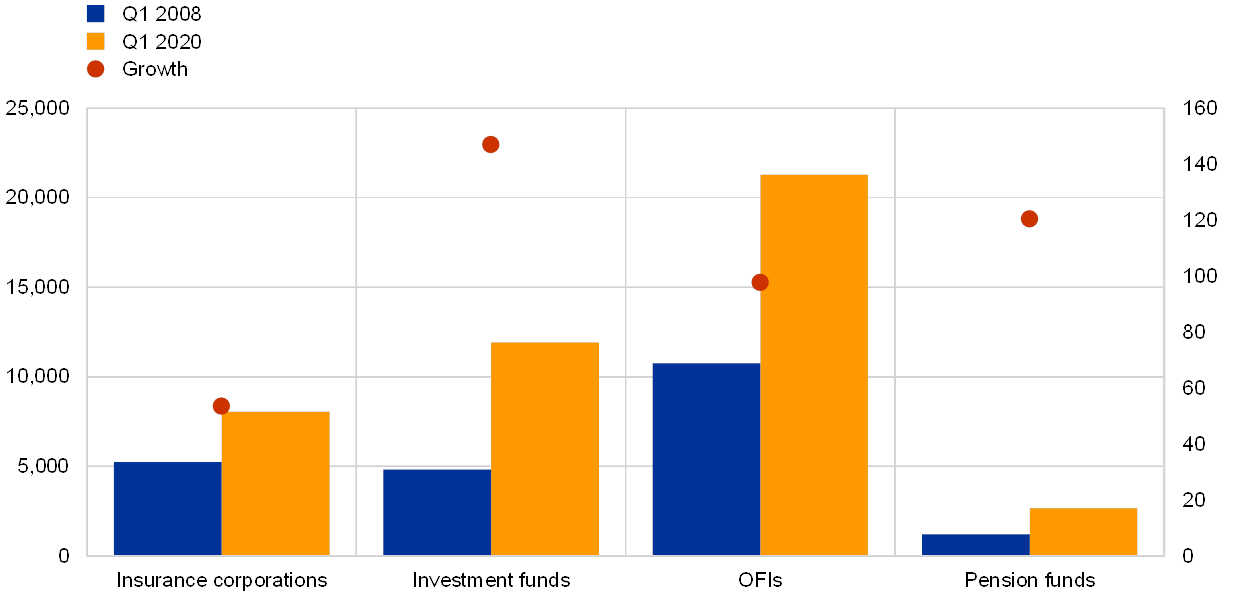
Since the financial crisis pension funds[5] have represented a dynamically growing financial sector in the euro area. Chart 2 shows how fast pension funds grew as a financial sector between the 2008 financial crisis and the first quarter of 2020, when euro area pension funds had around 75 million members.
Chart 2
Total assets and growth of selected non-MFI financial sectors
(left-hand scale: total assets, log of EUR billions; right-hand scale: percentage growth between Q1 2008 and Q1 2020)
Source: ECB calculations.
Note: OFIs stands for other financial institutions.
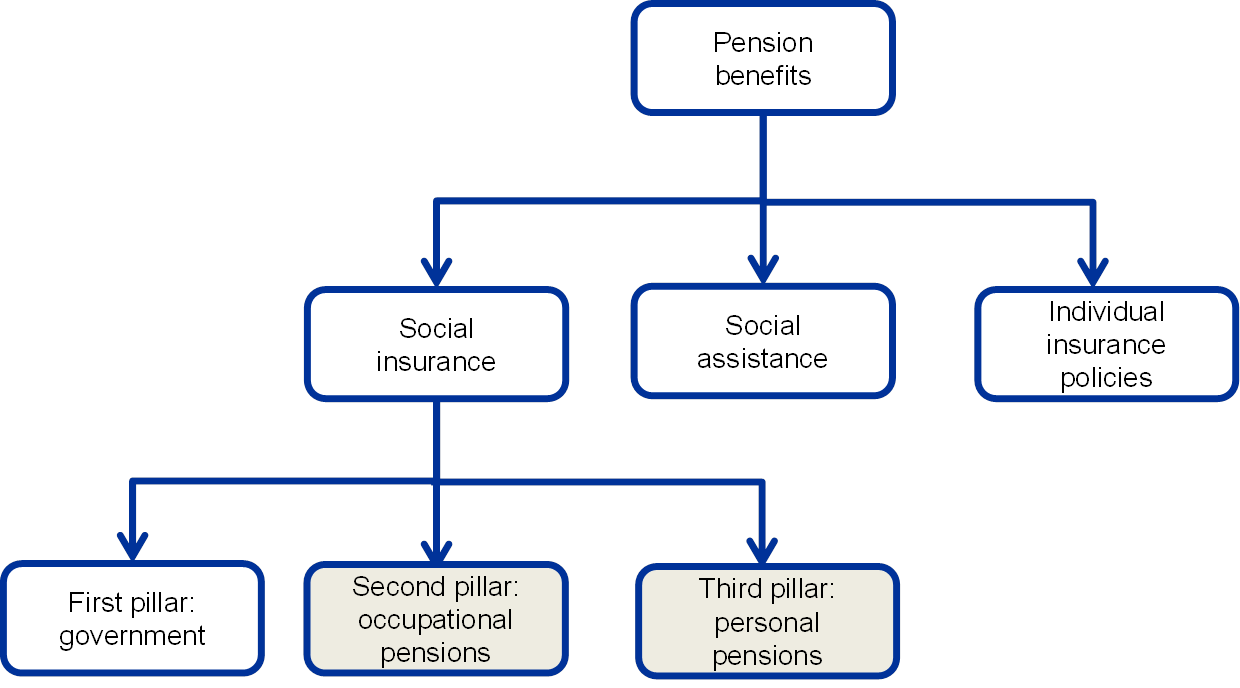
In the euro area, pension funds are highly diverse in terms of their legal and regulatory set-ups, corresponding to their different roles in social protection systems from country to country. Depending on the nature of the contributor, pension schemes are usually classified into three pillars (World Bank, 2008[6]) (see Figure 1). First-pillar pensions are organised by the government. Second-pillar pensions are occupational pension arrangements linked to employment, most of which are associated with a specific employer, group of employers, economic sector or social partner. Third-pillar pensions are personal pension products or savings.
Figure 1
Pillars of pension schemes
Sources: World Bank, Eurostat.
Notes: Social insurance and social assistance are defined in Eurostat’s Pension Guide[7]. The ECB Regulation covers the pension schemes in the shadowed cells in the figure, namely social insurance schemes under the second and third pillars.
Euro area countries often provide first-pillar pension plans under a pay-as-you-go (PAYG[8]) approach. Such pension benefits differ considerably in terms of their level and nature, ranging from “poverty protection” in some Member States to replacement of up to 80% of final salaries in others.[9]
The roles, size and nature of private pensions are also highly diverse across euro area countries. It is worth noting that there are a few Member States with very low levels of first-pillar pensions, but significant private pension savings (particularly in the occupational pension sector) and high asset values relative to the Member State’s GDP.[10] Occupational pension funds in the Netherlands make up around two-thirds of all such pensions in the euro area. Occupational pension plans are often negotiated by employers and social partners and are frequently subject to national social and labour law, which has an impact on the pension funds’ governance structures.
The euro area pension fund sector is highly concentrated in a few countries. In the euro area, the Netherlands stands out for its exceptionally large share, followed by Germany. Another characteristic of the pension fund sector in the euro area is the disparity in the number of reporting institutions, as in some countries there are large reporting populations made up of small pension funds (for instance Ireland and Cyprus[11]) while in other countries there are just a few pension funds.
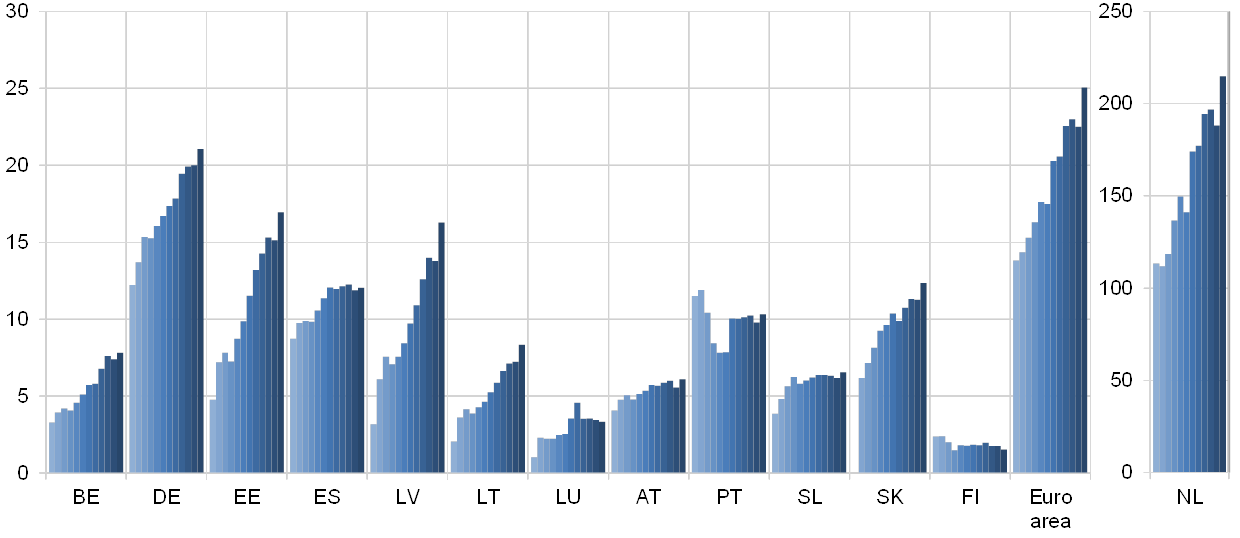
Pension funds’ assets have grown in most euro area countries since 2008. Although this growth as a percentage equivalent of a country’s GDP has varied across countries, in most the upward trend has been continuous in spite of the financial crisis (see Chart 3).
Chart 3
Total assets as percentage of country GDP
(annual data, 2008 to 2019; right-hand scale applies to NL)
Source: ECB calculations.
Notes: GR, IE, IT and CY are excluded owing to missing data. FR and MT are excluded as they lacked a pension fund sector as defined by ESA 2010 in the period covered by the chart.
The type of assets most commonly held by euro area pension funds are investment fund shares followed by debt securities (see Chart 4). Other investments, on a smaller scale, comprise equity, financial derivatives, currency and loans.
Chart 4
Assets held by euro area pension funds
(EUR billions; Q2 2020)

Source: ECB calculations
Note: “Other assets” include pension fund reserves, non-financial assets and remaining assets.
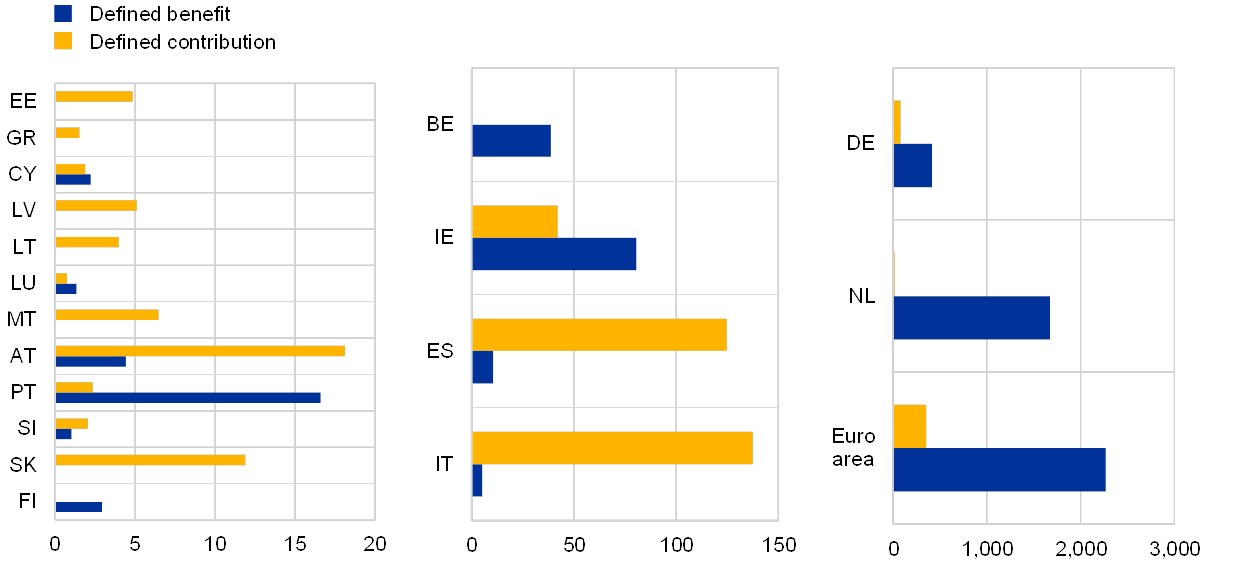
The main liabilities for pension funds (making up more than 95% of the total for the euro area) are insurance technical reserves/pension entitlements. In the euro area, defined benefit[12] schemes represent more than 85% of total pension entitlements. However, in most euro area countries there has been a shift in recent years from defined benefit to defined contribution contracts,[13] although the impact on the outstanding amounts will not be seen until after a few years of accumulation (see Chart 5).
Chart 5
Pension entitlements by country and type of scheme
(EUR billions; Q2 2020)
Source: ECB calculations.
2 ECB Regulation on pension fund statistics
The legal requirements for the harmonised pension fund statistics are laid down in Regulation ECB/2018/2.[14] The Regulation defines the statistical standards to be met by pension funds when reporting information on their assets and liabilities. Prior to the introduction of the harmonised statistics, data were collected on a best effort basis by the national central banks, which used sources other than direct collection to compute those data. The Regulation is complemented by Guideline ECB/2019/18[15], which sets out the procedures national central banks must follow when reporting pension fund statistics to the ECB.
The ECB Regulation aims to improve the availability and quality of data reported by pension funds and to increase harmonisation and data comparability across countries. The new pension fund statistics provide a larger, more harmonised set of data, resulting in a stronger information base for monetary policy decision-making, for financial stability purposes (including from a macroprudential perspective[16]) and for a better derivation of euro area accounts statistics. More data means more transparency on pension funds’ activities. This is vital, as pension sector reforms are taking place across the European Union and there is also a shift from defined benefit to defined contribution schemes. Another advantage of the additional data reported under the ECB Regulation is that it is opening up new avenues for research on topics such as the impact of pension funds on the economy and the financial sector. A few examples of the use of the new pension fund statistics are detailed in Section 3.
The Regulation covers autonomous pension funds, as defined by the European System of National and Regional Accounts (ESA 2010)[17]. Pension funds are financial corporations that are mainly engaged in financial intermediation as a consequence of the pooling of the social risks and needs of their members and beneficiaries. About 76% of total pension entitlements are pension fund liabilities[18] according to the euro area accounts (see Chart 6). Insurance corporations may also offer saving schemes, which are recorded as pensions, in particular if participation in such a scheme is part of an employment contract. The liabilities of insurance corporations make up 9% of total pension entitlements.[19]
Chart 6
Pension entitlements by sector
(share of total euro area pension entitlements; Q1 2020)

Sources: Euro area accounts and ECB calculations.
Note: “Non-autonomous pension funds” cover non-financial corporations, monetary financial institutions, other financial institutions, general government and households and non-profit institutions serving households.
Only those pension funds that are institutional units separate from the units that create them are included in pension fund statistics. In some countries employers can create pensions schemes for their employees without involving a pension fund or insurance corporation. These non-autonomous schemes are not included in pension fund statistics. Where pension commitments are recognised on the balance sheet of the employers, they are covered in the euro area accounts. Non-autonomous schemes account for about 14% of total pension entitlements. Social security schemes are not included in the core definition of pensions[20] (the first pillar in Figure 1).
Pension fund statistics are an important source for the euro area accounts, not only for data on the pension fund sub-sector, which is presented separately in the financial accounts[21], but also for information on households’ financial investments with pension funds. The pension funds Regulation provides a stable basis for outstanding amounts and the breakdown of flows into financial transactions, revaluations and other changes in volume.[22] This significantly improves the compilation of data on pension funds and households’ financial investments in the financial accounts.
Co-operation with the European Insurance and Occupational Pensions Authority (EIOPA) has been a key factor in minimising the reporting burden for the pension funds and ensuring consistency between supervisory and statistical data. The relevant EIOPA and ECB bodies have cooperated closely in setting up the definitions, methodological framework and transmission format for both ESCB statistics and supervisory reporting.[23] A very high level of convergence between reporting requirements, data content, timeliness and coverage has been achieved. This gives national authorities the option of implementing a single reporting flow for pension funds in order to reduce the reporting burden and maximise consistency between data used in supervision and data used in macroeconomic statistics.[24]
In 2017 the ECB launched a public consultation[25]on the draft regulation on statistical reporting requirements for pension funds. Key documents – comprising the draft regulation, a summary of the related merits and costs procedure run in 2016, and frequently asked questions – were made available on the ECB’s website as background information. The public consultation was instrumental in terms of finding an appropriate balance between user needs and reporting agents’ costs, and also formed the basis for some technical fine-tuning.
In line with the pension funds reporting scheme, national central banks report to the ECB end-of-quarter stock data[26] and quarterly reclassification and revaluation adjustments. In addition, annual data on pension scheme members, broken down into active, deferred and retired members, are also reported. Stocks refer to the value of the asset or liability at the end of the reference quarter or year. Revaluation adjustments refer to changes in stocks due to changes in prices or exchange rates. Transactions refer to the sum of all net acquisitions (minus sales) of a given type of asset during the period, and the net incurrence (inflows minus outflows) of liabilities. In addition, the split between defined benefit and defined contribution schemes can be complemented with the information reported security-by-security (s-b-s)[27] and with the list of pension funds.[28] Growth rates will be calculated from an index obtained by dividing transactions by the stocks at the beginning of the period to which they refer.
3 New euro area data on pension fund statistics
Euro area pension funds obtain capital from resident members. More than 99% of pension entitlements, the main liability item, are from the Member State where the pension fund is located, showing a strong domestic bias and also pointing to the low level of cross-border business carried out by pension funds (see Chart 7).
Chart 7
Geographical distribution of euro area pension entitlements by scheme – residency of beneficiaries
(percentages; Q2 2020)

Source: ECB calculations.
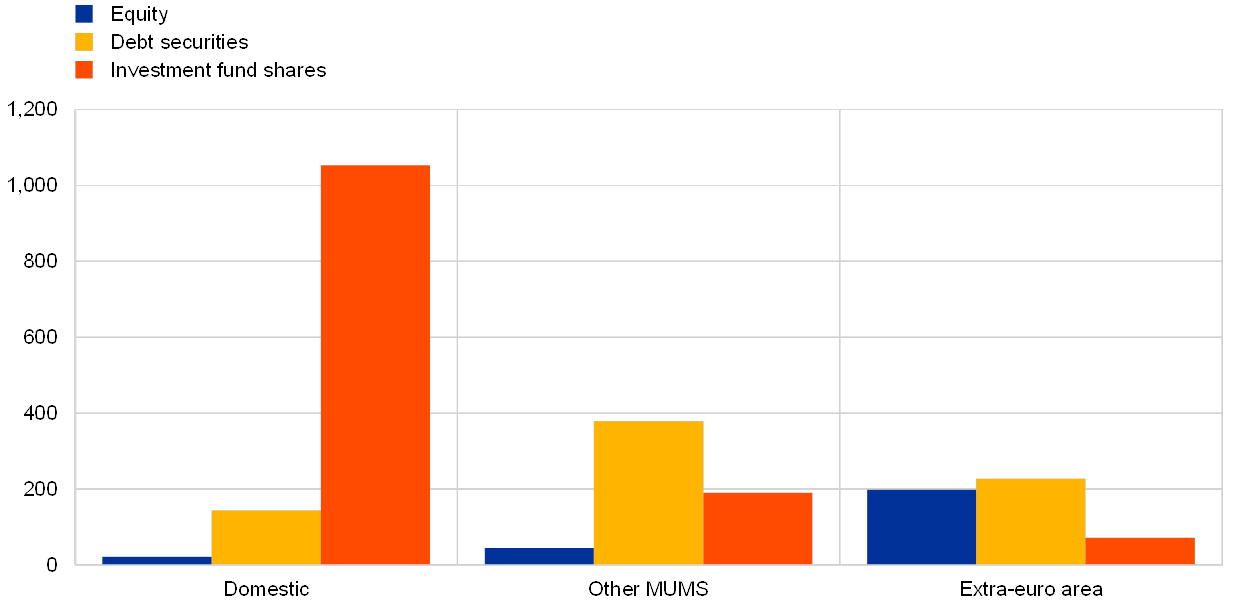
Pension funds invest in a geographically broader area. Euro area pension funds’ assets are more widely geographically distributed than their liabilities, with only about 55% of assets invested domestically. Investment fund shares are invested mainly in domestic investment funds, while debt securities, for example, tend to be invested in issuers in other euro area countries (i.e. outside the country the pension fund is located in). In the case of equity, the largest holdings are from issuers resident outside the euro area (see Chart 8).
Chart 8
Geographical distribution of assets
(EUR billions; Q2 2020)
Source: ECB calculations.
Note: Other MUMS stands for other Monetary Union Member States.
The breakdown of types of investment fund now available is key to the analysis of the interconnectedness of the pension funds sector. In the previous pension fund data collection, only the absolute amount of all investment fund shares – the largest type of asset held – was reported. Therefore, data on the real exposure of pension funds to stock and debt market movements were not available. Under the Regulation, when pension funds report investment fund shares they must specify which type of fund they are investing in (namely equity, bond, mixed, hedge, real estate or other) (see Chart 9). The new reporting shows that the largest type of investment fund shares held by euro area pension funds is equity, followed by bond funds and mixed funds (which combine the previous two types).
Chart 9
Investment fund shares by type
(EUR billions; Q2 2020)

Source: ECB calculations.
Note: MMF stands for money market funds.
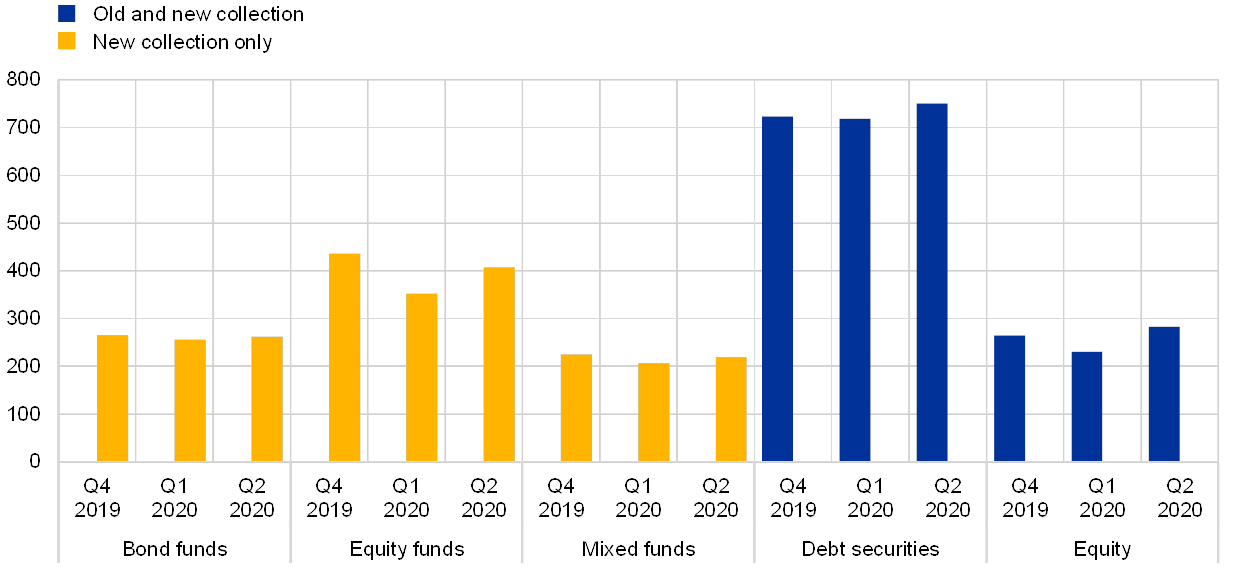
The exposure of euro area pension funds to stock and debt markets can be analysed in more detail with the new breakdowns. For instance, the effect of the Covid-19 crisis on pension funds in the first quarter of 2020 can now be analysed in detail: the pandemic affected the asset side of pension funds’ balance sheets mainly through their exposure on stock markets, measured not only by the equity they directly hold but also through their equity (and mixed) investment fund shares (see Chart 10). Holdings of equity fund shares fell by 15%, while those of bond funds were stable throughout the quarter, with revaluation losses mostly compensated by positive transactions. Without this new breakdown, all data on fund types would be merged, providing a less clear picture.
Chart 10
Holdings of debt and equity instruments
(EUR billions; Q2 2020)
Source: ECB calculations.
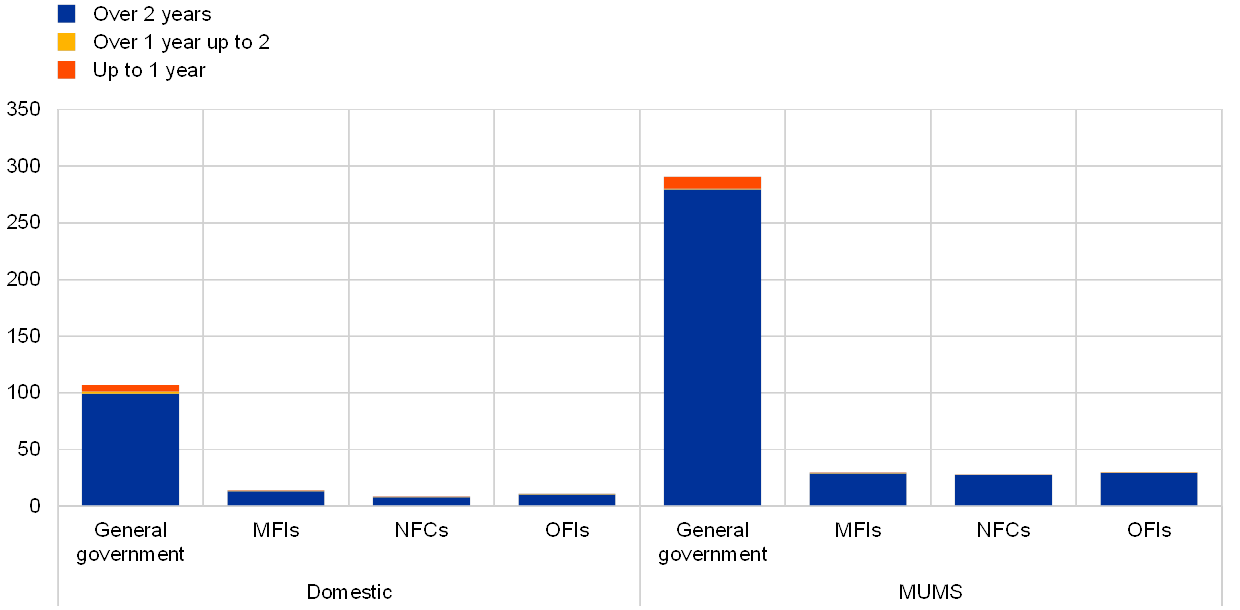
In debt markets, pension funds invest mostly long term and in government bonds. Of the debt securities held, 96% have original maturities of over one year. Both domestically and in other euro area countries, pension funds hold more general government debt than monetary and financial institution debt and non-financial corporation debt combined (see Chart 11).
Chart 11
Holdings of debt securities by main issuing sector, area and maturity
(EUR billions; Q2 2020)
Source: ECB calculations.
Note: MFIs stands for monetary and financial institutions, NFCs for non-financial corporations, OFIs for other financial institutions.
Investments in currency and deposits are also more long-term oriented. At the end of 2019, 60% of the holdings of cash and deposits of euro area pension funds had maturities of over two years (see Chart 12). Although the share of short-term deposits has grown over time, cash and deposits have slightly declined in importance on pension fund balance sheets in a general move towards longer-term investments.
Chart 12
Holdings of currency and deposits
(EUR billions)

Source: ECB calculations.
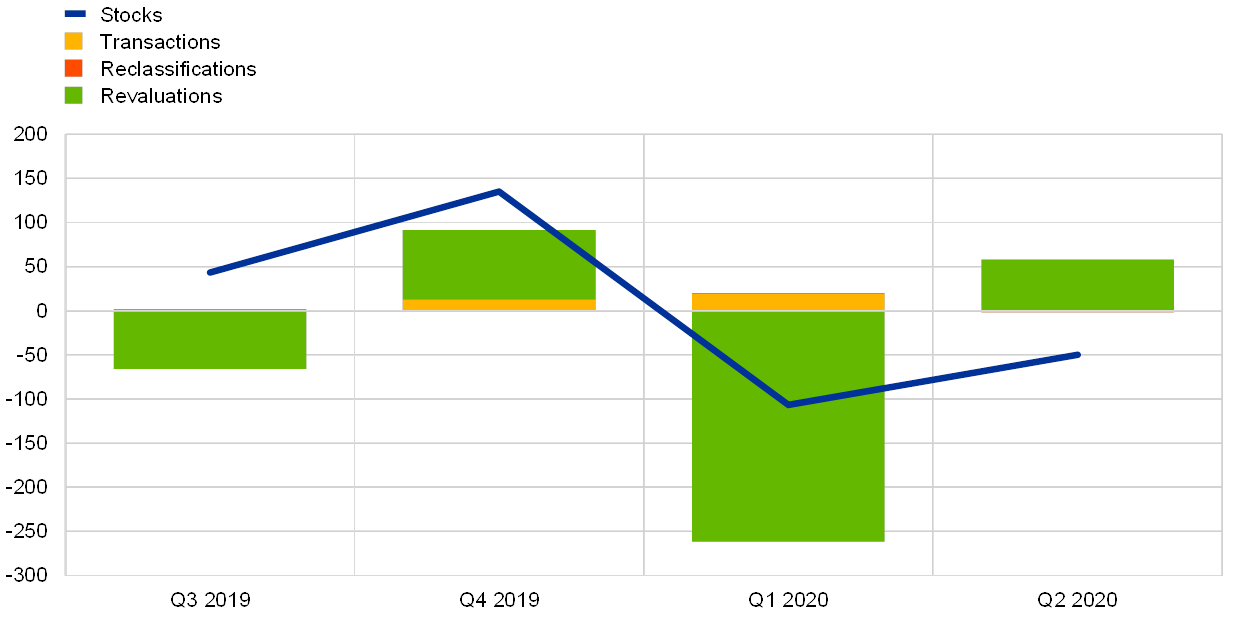
Net worth is the balancing item in the statistical balance sheet[29], and its evolution can be better understood with the new data on revaluation adjustments. In a defined benefit pension scheme, the level of pension benefits promised to participating employees is defined by a formula agreed in advance. Since assets are valued at market prices, their value might be higher or lower than the promised entitlements, leading to a positive or negative worth of the pension fund, respectively. When net worth turns negative, a pension fund can be said to be underfunded.[30] Another advantage of the new collection of data is the availability of revaluations and reclassifications, which can help explain why net worth grows or falls. The net worth of euro area pension funds fell from €124 billion in the fourth quarter of 2019 to €-122 billion in the first quarter of 2020. This drop can mostly be explained by the newly reported negative revaluations in the first quarter of 2020 (see Chart 13), mirroring exceptional market developments in this quarter due to the pandemic.
Chart 13
Evolution of net worth
(EUR billions; Q2 2020)
Source: ECB calculations.
4 Conclusions
Pension funds play a dual role, helping individuals save for old age and allocating long-term capital efficiently across firms, sectors and global markets. Pension funds are among the largest and fastest-growing investors in global capital markets. Their investments are diverse in terms of financial instruments, sectors and geographical location. Their role in the funding of euro area governments and non-financial corporations through investments in debt securities and equity is also increasing. The effects of the financial crisis and the pandemic, the low interest rate environment and Europe’s ageing population have all highlighted the need for better quality, more granular and comparable data on this sector. Previously, gaps in the data available and the lack of comparability across countries made it difficult to gain a comprehensive understanding of the role of the sector in the monetary policy transmission mechanism, of cash flows and of the risks associated with pension obligations, as well as the risks associated with pension funds’ investment behaviour and their interconnectedness with the rest of the financial system and the real economy. This is why it is crucial to have good, harmonised statistics on euro area pension funds.
The new euro area statistics on pension funds improve upon the previous dataset in several respects. The new dataset features (i) harmonised concepts that comply with international statistical standards and ensure the dataset is consistent with supervisory data; (ii) full coverage of institutions; (iii) detailed breakdowns of assets and liabilities, including by maturity, counterpart sector and geographical area; (iv) data on transactions and adjustments (e.g. revaluations and reclassifications); and (v) more timely releases of data. In addition, they are a vital building block for the compilation of data on pension funds and households’ financial investments in the financial accounts.
- Autonomous pension funds, as defined by the European System of National and Regional Accounts (ESA 2010). Pension funds consist only of those pension funds that are institutional units separate from the units that create them; non-autonomous pension funds set up, for example, by credit institutions or non-financial corporations are therefore not covered. Individual pension plans offered by insurance corporations or other institutions are also excluded from the scope of the Regulation, as are social security schemes.
- See the article entitled “Social spending, a euro area cross-country comparison”, Economic Bulletin, Issue 5, ECB, 2019.
- Pension fund statistics are available on the ECB’s website in the Statistical Data Warehouse (SDW).
- This reflects the higher share of private pensions in total pensions in the US and the fact that the role of public social security pensions is more relevant in nearly all euro area countries. See “Pension Markets in Focus”, OECD, 2019 and “OECD Pensions Outlook”, OECD, 2018.
- Including “second pillar” and (partly) “third pillar” pensions (see also Section 2).
- The World Bank Pension Conceptual Framework, World Bank Pension Reform Primer Series, Washington, DC, 2008.
- See Eurostat, “Technical compilation guide for pension data in national accounts – 2020 edition”: “Social insurance schemes are schemes in which participants are obliged, or encouraged, by a third party to take out insurance against certain social risks or circumstances that may adversely affect their welfare or that of their dependants. […] In contrast to social insurance benefits, social assistance benefits are payable without qualifying contributions having been made to a social insurance scheme.”
- PAYG schemes imply that pensions paid to current pensioners are funded from contributions paid by current workers. There is thus a key relationship between the number of workers and the number of pensioners in the scheme.
- See, for instance, European Commission, “Pension adequacy report 2018 – Current and future income adequacy in old age in the EU”, April 2018.
- In the Netherlands, for instance, around half of all pension income comes from second- and third-pillar pensions (with the first pillar acting as a safety net to prevent poverty). That is the main reason for the high ratio of pension assets to GDP (which has exceeded 200%).
- As part of the preparatory work carried out when drafting the Regulation, more than 75,000 pension funds were identified in Ireland and around 2,000 in Cyprus.
- In a defined benefit pension scheme, the benefit on retirement is predetermined by a formula based on the earnings history, working life and age of the individual. The benefit at retirement does not depend directly on investment returns, as it is fixed in advance. By contrast, in defined contribution schemes, individual accounts are set up for participants and benefits are based on the amounts credited to these accounts plus any investment earnings. In such plans, future benefits fluctuate on the basis of investment earnings, and sponsors (which are typically employers) do not have any obligation to make further contributions to the plan if it evolves unfavourably; this is explained in more detail by way of the new statistics available in Section 3. Hybrid plans include both defined benefit and defined contribution components.
- See European Insurance and Occupational Pensions Authority, Consumer Trends Report 2019, Luxembourg, Publications Office of the European Union, 2019.
- Regulation (EU) 2018/231 of the European Central Bank of 26 January 2018 on statistical reporting requirements for pension funds (ECB/2018/2) (OJ L 45, 17.2.2018, p. 3).
- Guideline (EU) 2019/1386 of the European Central Bank of 7 June 2019 amending Guideline ECB/2014/15 on monetary and financial statistics (ECB/2019/18) (OJ L 232, 6.9.2019, p.1).
- See Serrano, A.S. and Peltonen, T., “Pension schemes in the European Union: challenges and implications from macroeconomic and financial stability perspectives”, Occasional Paper Series, No 17, ESRB, July 2020.
- At the time of the implementation of the Regulation there were no pension funds in France that met the ESA 2010 definition.
- These pension entitlements are those covered under the second pillar (occupational pensions) and the third pillar (e.g. individual pension schemes offered by pension funds) in Figure 1.
- Pension schemes offered by insurance corporations are covered by the statistics on insurance corporations. Voluntary savings products, e.g. individual life insurance policies and annuities, are not considered pension schemes but are recorded under life insurance and annuities in insurance statistics and the euro area accounts.
- Pension entitlements as recognised financial assets and liabilities in the core of the national financial accounts and social security entitlements are presented together in Table 29 “Accrued-to-date pension entitlements in social insurance” of the ESA 2010 Transmission programme (see also the Box entitled “Accrued-to-date pension entitlements of households across euro area countries”, Economic Bulletin, Issue 5, ECB, 2019).
- In the non-financial sector accounts pension funds are covered as part of the financial sectors; non-financial transactions are not generally available by sub-sector.
- These are reclassifications under the ECB Regulation.
- See Decision of the Board of Supervisors on EIOPA's regular information requests towards NCAs regarding provision of occupational pensions information, EIOPA-BoS/18-114,10 April 2018.
- A common technical framework, based on the eXtensible Business Reporting Language (XBRL) taxonomy, has been set up by EIOPA to facilitate the integration.
- The documents related to the public consultation can be consulted here.
- If not reported by the industry, NCBs estimate quarterly liabilities. The main item to be estimated is pension entitlements. As established in the Regulation, where liabilities data are not reported directly on a quarterly basis, NCBs must derive quarterly estimates of the liabilities of pension funds on the basis of the annual data provided. To this effect, the ECB published a Compilation Guide, which includes the mapping of supervisory and statistical requirements with EIOPA and methodologies agreed on for the estimation of quarterly liabilities.
- The s-b-s reporting and the list of pension funds will also be key complementary data in the analysis of the shift from defined benefit to defined contribution schemes where the investment risks are borne by the policyholder or beneficiary. While this shift may reduce direct financial risks for pension funds, it necessitates increased monitoring of defined contribution schemes, which may have a significant economic impact on the net wealth of households.
- See Guideline (EU) 2019/1335 of the European Central Bank of 7 June 2019 amending Guideline (EU) 2018/876 on the Register of Institutions and Affiliates Data (ECB/2019/17) (OJ L 208, 8.8.2019, p.47).
- In a defined contribution scheme the benefits paid are dependent on the performance of the assets acquired by the pension scheme. The liability of a defined contribution scheme is the current market value of the fund’s assets. The fund’s net worth is always zero.
- The new pension fund statistics also cover possible financial positions between pension funds and “pension managers” as defined by ESA 2010. If the employer retains the responsibility for any deficit in funding, the fund may record a claim on the employer. In practice, funding shortfalls may be addressed by increased contributions from employers and employees and/or by adjustments to benefits, depending on national legal provisions.


