
Euro area balance of payments in July 2010
In July 2010 the seasonally adjusted current account of the euro area recorded a deficit of EUR 3.8 billion. In the financial account, combined direct and portfolio investment recorded net outflows of EUR 26 billion (non-seasonally adjusted).
Current account
The seasonally adjusted current account of the euro area recorded a deficit of EUR 3.8 billion in July 2010 (see Table 1). This reflected deficits in current transfers (EUR 8.0 billion) and income (EUR 1.4 billion), which were partly offset by surpluses in goods (EUR 3.4 billion) and services (EUR 2.2 billion).
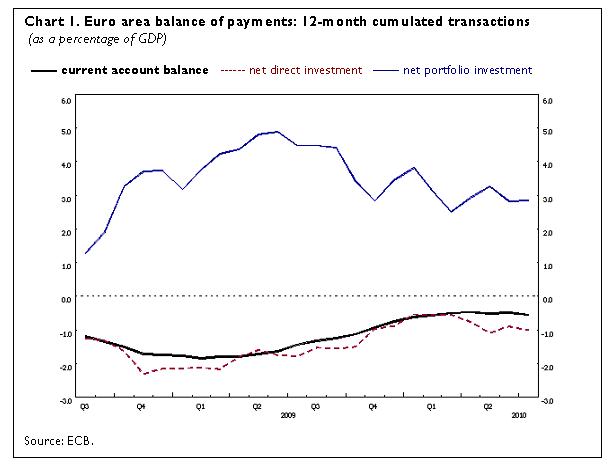
The 12-month cumulated seasonally adjusted current account recorded a deficit of EUR 49.8 billion in July 2010 (around 0.6% of euro area GDP – see Table 1), compared with a deficit of EUR 130.4 billion a year earlier. The reduction in the current account deficit was predominantly due to a decrease in the income deficit (from EUR 68.4 billion to EUR 31.3 billion) and to an increase in the goods surplus (from EUR 4.2 billion to EUR 38.5 billion), as well as, to a lesser extent, an increase in the surplus in services (from EUR 29.6 billion to EUR 35.6 billion) and a decrease in the deficit in current transfers (from EUR 95.9 billion to EUR 92.5 billion).
Financial account
In the financial account (see Table 2), combined direct and portfolio investment recorded net outflows of EUR 26 billion in July 2010, showing net outflows in both portfolio investment (EUR 24 billion) and direct investment (EUR 2 billion).
The net outflows in direct investment resulted from net outflows in equity capital and reinvested earnings as well as in other capital (mostly inter-company loans) (both EUR 1 billion).
Portfolio investment recorded net outflows in debt instruments (EUR 26 billion) which resulted mainly from gross sales of euro area bonds and notes by non-residents and gross purchases of foreign money market instruments by euro area residents.
The financial derivatives account was close to balance.
Other investment recorded net inflows of EUR 19 billion, mainly reflecting net inflows in MFIs (excluding the Eurosystem).
The Eurosystem’s stock of reserve assets decreased from EUR 583 billion to EUR 536 billion in July 2010, mainly owing to a decrease in the market price of gold. Transactions (excluding valuation effects) contributed to an increase of EUR 3 billion in the overall position.
In the 12-month period to July 2010, combined direct and portfolio investment recorded cumulated net inflows of EUR 170 billion, compared with net inflows of EUR 243 billion in the preceding 12-month period. This decrease was the result of lower net inflows in portfolio investment (down from EUR 405 billion to EUR 261 billion), which were partly offset by lower net outflows in direct investment (down from EUR 162 billion to EUR 90 billion). The decrease in net inflows in portfolio investment was due mainly to lower net inflows in money market instruments (down from EUR 289 billion to EUR 111 billion).
Data revisions
This press release incorporates revisions to the data for June 2010. These revisions have not significantly altered the figures published previously.
Additional information on the euro area balance of payments and international investment position
In this press release, the seasonally adjusted current account refers to working day and seasonally adjusted data. Data for the financial account are non-working day and non-seasonally adjusted.
In line with the agreed allocation of responsibilities, the European Central Bank compiles and disseminates monthly and quarterly balance of payments statistics for the euro area, whereas the European Commission (Eurostat; see “Euro-indicators” new releases) focuses on quarterly and annual aggregates for the European Union. These data comply with international standards, particularly those set out in the IMF’s Balance of Payments Manual (fifth edition). The aggregates for the euro area and the European Union are compiled consistently on the basis of transactions and positions with residents of countries outside the euro area and the European Union respectively.
A complete set of updated euro area balance of payments (including a quarterly geographical breakdown by main counterparts) and international investment position statistics is available in the “Statistics” section of the ECB’s website under the headings “Data services”/“Latest monetary, financial markets and balance of payments statistics”. These data, as well as historical euro area balance of payments time series, can be downloaded from the ECB’s Statistical Data Warehouse (SDW). Data up to July 2010 will also be published in the October 2010 issues of the ECB’s Monthly Bulletin and Statistics Pocket Book. Detailed methodological notes are available on the ECB’s website. The next press release on the euro area monthly balance of payments will be published on 19 October 2010, together with the quarterly international investment position.
Annexes
Table 1: Current account of the euro area
Table 2: Monthly balance of payments of the euro area
European Central Bank
Directorate General Communications
- Sonnemannstrasse 20
- 60314 Frankfurt am Main, Germany
- +49 69 1344 7455
- media@ecb.europa.eu
Reproduction is permitted provided that the source is acknowledged.
Media contacts