

Published as part of the ECB Economic Bulletin, Issue 5/2023.
In January 2023 the ECB published a set of climate-related statistical indicators on its website for the first time, covering sustainable finance, carbon emissions and physical risks. These climate-related indicators, which are still under different stages of development, aim to shed light on climate change risks facing the financial sector in the euro area and to support policymakers and investors in developing effective strategies to address these challenges. Climate change also has potential implications for central banks regarding their price stability mandates, financial stability aims and, in many cases, prudential supervision of banks. This box gives a brief overview of the climate-related indicators, including the rationale behind them and their caveats.
The ECB is firmly committed, within its mandate, to do its part in addressing climate change. In July 2021 the Governing Council set out an action plan for incorporating climate change considerations into its policy framework.[1] The increasing risks associated with climate change have highlighted the importance of better understanding the exposure of financial institutions to climate change-related developments as well as their role in channelling funds to the economy to better adapt to such risks. As part of the action plan, climate change indicators have been developed. These are intended to support the analysis of climate change issues in the financial sector. One area of interest is the carbon footprint of the financial portfolios of financial institutions: by tracking the greenhouse gas emissions of economic activities that have been directly or indirectly financed by financial institutions, it is possible to assess the progress made by those institutions in reducing the carbon footprints of the portfolios and in their role in the transition to a low-carbon economy. Furthermore, as the European climate agenda evolves and large polluters face increased regulation and restrictions, certain industries and assets may become obsolete or face significant devaluation, turning into so-called “stranded assets”. It is important to assess the physical risks to assets – including assets used for production, shelter or as collateral to loans – as these can affect the stability of the financial system and the economy as a whole. The indicators for sustainable finance instruments facilitate the tracking of data on the aggregate details of issuers and holders of green and other sustainable debt securities, thereby increasing market transparency.
The indicators have been developed by the European System of Central Banks (ESCB). Source data for the calculations are typically produced by various international organisations and use ESCB microdata sources such as the Register of Institutions and Affiliates Data (RIAD), the analytical credit dataset (AnaCredit), the Centralised Securities Database (CSDB) and the Securities Holdings Statistics by Sector (SHSS) datasets. A methodological manual, which provides full details of the calculation of these indicators, has been made available on the ECB’s website, but it is important to emphasise that there are still caveats associated with the statistics.[2] However, it is expected that many of these limitations will be dealt with as the data become more mature.
The sustainable finance dataset gives an overview of issuances and holdings of sustainable debt securities in the euro area. The indicators provide information on the proceeds raised to finance sustainable projects and, through this, on the progress of the transition to a net-zero economy.[3] In the context of sustainable finance, the definitions of what constitutes a “green” or “sustainable” investment may vary across market participants, as there is currently no universally accepted standard, even if some international standards are widely used, such as those of the International Capital Markets Association or the Climate Bonds Initiative. The lack of internationally accepted harmonised definitions of certain concepts may lead to limitations in the datasets, which have been designated as experimental by the ECB as a result.
Issuances of sustainable debt securities, which can be divided into four sustainability classifications (sustainability, sustainability-linked, green and social), have been significant in the last two years (Chart A), with the total outstanding amount more than doubling, albeit from a low base. This increase has been driven by the issuance of sustainable debt securities in the green and social classifications (Chart B), which account for the majority of the sustainable debt securities market. Nonetheless, it is still a nascent market, currently accounting for around 5% of the total euro area debt securities market. Government and monetary financial institutions are the leading sectors issuing green debt securities in the euro area and have very comparable market shares. Investment funds are the main investors in green debt securities, followed by euro area national central banks. Data from France and Germany show that they are the main issuers and holders of green debt securities in the euro area, while some euro area countries have only tentatively or not yet entered that market.
Chart A
Euro area issuance of sustainable debt securities
(left-hand scale: EUR billions, outstanding amounts at face value; right-hand scale: percentages)
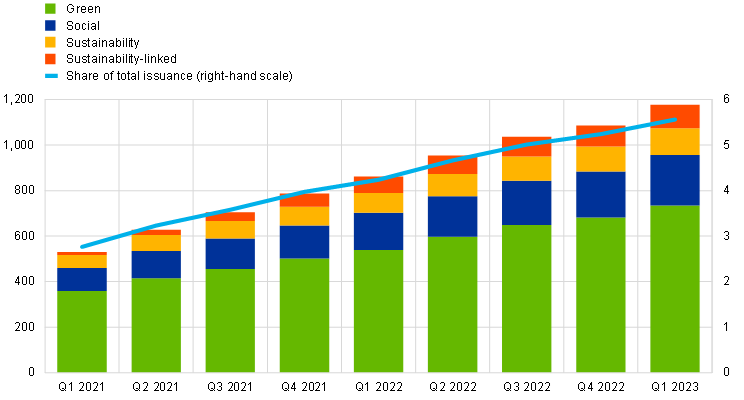
Source: CSDB.
Notes: The observed amounts are for the last day of the reference period. The share of total issuance represents the amount of all sustainable securities as a share of the outstanding amounts of all debt securities issued in the euro area.
Chart B
Euro area holdings of sustainable debt securities
(left-hand scale: EUR billions, outstanding amounts at face value; right-hand scale: percentages)
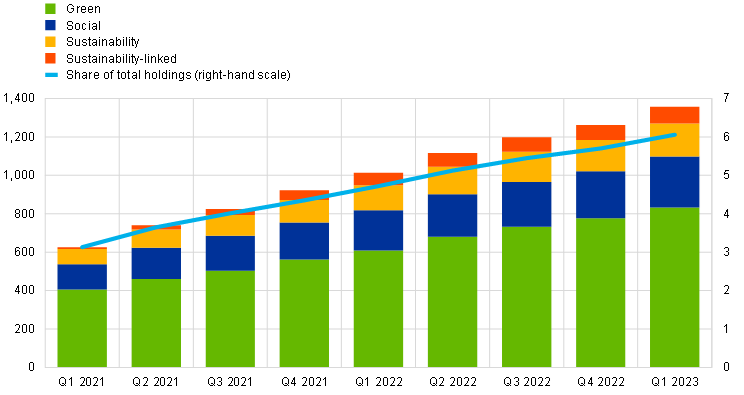
Sources: CSDB and SHSS.
Notes: The observed amounts are for the last day of the reference period. The share of total holdings represents the amount of all sustainable securities as a share of the holding amounts of all debt securities in the euro area.
The indicators published by the ESCB provide data on the carbon emissions of non-financial corporations that have been financed by the financial sector’s loan and securities portfolios. Carbon emissions, which are a major contributor to climate change, refer to the release of carbon dioxide and other greenhouse gases into the atmosphere, primarily from human activities such as burning fossil fuels.
In its current stage of development, the carbon emissions dataset is best suited to identifying high-level structural relationships across financial sectors, rather than looking at trends over time. The indicators suffer from time-varying coverage and are not adjusted for valuation effects. This is expected to change in the next data release. Chart C shows data on the direct and indirect emissions financed by the financial sector according to type of financial institution, using 2018-2021 averages to partially deal with the time variation. In absolute terms, investment funds are the largest group financing direct emissions, which mirrors their large portfolio size in the breakdown. Chart D, which standardises financed emissions by financed revenues to account for how efficiently emissions are used to produce goods and services, shows that deposit-taking corporations tend to have the largest exposure to the most carbon-intensive sectors. This is despite deposit-taking corporations financing a relatively small share of absolute direct emissions when compared with investment funds. Looking deeper into the underlying data, this relationship is driven primarily by their holdings of equities, as these account for the majority of the total Scope 1 emissions for the euro area.
Chart C
Direct and indirect emissions financed by the financial sector, broken down by type of financial institution
(euro area, million tonnes of CO2, 2018-2021 averages)
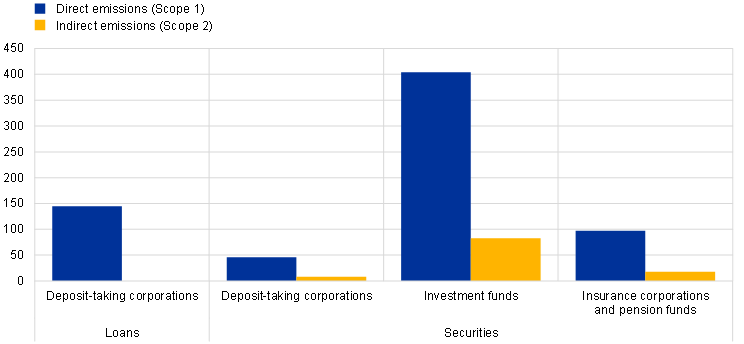
Sources: ESCB calculations based on data from AnaCredit, SHSS, Institutional Shareholder Services (ISS), Refinitiv, EU Emissions Trading System (EU ETS), Eurostat Air Emissions Accounts (AEA) and Orbis by Bureau van Dijk.
Notes: Loans are computed at the individual entity level. Securities include listed shares and debt securities and are computed at the group level. “Deposit-taking corporations” does not include central banks. “Direct emissions” and “Indirect emissions” refer to the covered financing volume only and will be higher once coverage is increased. Data accuracy is affected by composition, price and exchange rate effects.
Chart D
Intensity of direct and indirect emissions financed by the financial sector, broken down by type of financial institution
(euro area, tonnes of CO2 emissions per EUR million of revenue, 2018-2021 averages)
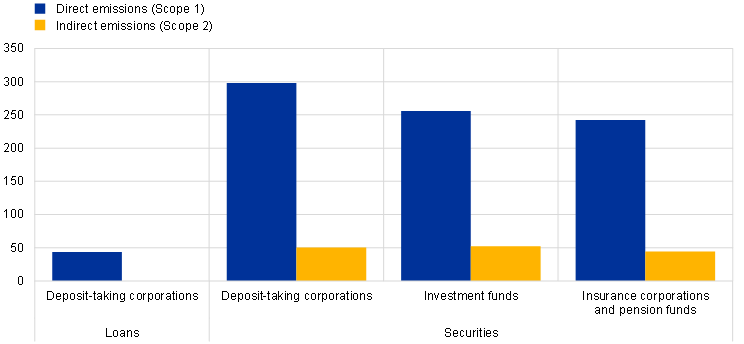
Sources: ESCB calculations based on data from AnaCredit, SHSS, ISS, Refinitiv, EU ETS, AEA and Orbis by Bureau van Dijk.
Notes: Loans are computed at the individual entity level. Securities include listed shares and debt securities and are computed at the group level. “Deposit-taking corporations” does not include central banks. Indirect emissions refer to the covered financing volume only and will be higher once coverage is increased. Data accuracy is affected by price and exchange rate effects.
Efforts are being made at the international level to harmonise definitions and establish common frameworks, such as the EU Taxonomy Regulation[4], which aims to provide a common language for sustainable activities. For the carbon emissions and physical risk indicators, issues relating to the availability and quality of data and variations in calculation methodologies are the main drivers of uncertainty. Issues such as future greenhouse gas emission pathways, natural climate variability and complex feedback mechanisms can also contribute to high uncertainty in climate projections. For these reasons, both sets of indicators are currently being classed as analytical.
Physical risk indicators measure the direct consequences of climate-related events such as extreme weather events, rising sea levels and changes in temperature patterns. The physical risk indicators that have been developed examine the susceptibility of various economic sectors financed by the financial sector to climate change impacts stemming from selected physical hazards. This currently covers coastal flooding, river flooding, wildfires, landslides, subsidence, windstorms and water stress. By analysing these indicators, the ECB aims to evaluate the vulnerability of economic activities to physical risks. In the first release of climate data, the ECB provided a set of indicators to measure and monitor these physical risks in the financial sector loan and securities portfolios.
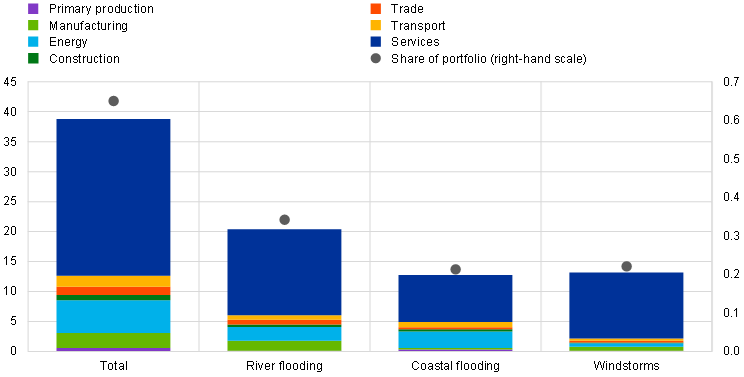
One of the published set of indicators for physical risks is the normalised exposure at risk (NEAR) indicator. NEAR combines expected annual losses and financial exposure that companies have with financial institutions and relates them to the company’s revenues or total assets. It is expressed as an annual amount of financial exposure at risk. As can be seen from Chart E, the distribution across sectors broadly reflects the share of each sector in terms of total financial assets, with services having the largest share, at around 67%. Compared with other sectors, the energy sector is proportionally more exposed to floods, which may be due to energy companies having relatively high levels of fixed assets that need to be located close to water sources. However, it should be emphasised that drawing conclusions of this nature requires caution, owing to the difficulty of obtaining accurate information as to the exact location of assets at risk.[5]
Chart E
Normalised exposure at risk (NEAR), broken down by sector
(euro area, left-hand scale: EUR billions; right-hand scale: percentage of loans and securities portfolios)
Sources: ESCB calculations based on data from AnaCredit, SHSS, Joint Research Centre, Copernicus and Orbis by Bureau van Dijk.
Notes: Information in this chart is based on expected annual damages caused to physical company assets by each hazard. Protection measures, insurance and collateral are not taken into account. AnaCredit and SHSS data are for December 2020.
The ECB’s climate change indicators represent a step towards providing high quality tools to measure and monitor climate-related risks to the euro area economy. These statistics cover sustainable finance, carbon emissions and physical risks, allowing policymakers to make informed decisions and formulate effective policy strategies. By promoting the understanding and consideration of these risks, the ECB is contributing to the development of a more sustainable and resilient financial system in the face of the challenges posed by climate change. The indicators remain under development and the ESCB is actively seeking feedback from stakeholders on their construction and plausibility. Making an encompassing set of indicators available to analysts, policymakers and the public is a complex endeavour, requiring close interaction with the appropriate stakeholders and a heavy reliance on the availability of suitable, good-quality input data. Provision of the latter is expected to improve as a result of many initiatives at the EU and international levels, including the G20 Data Gaps Initiative[6] and work being undertaken by the Central Banks and Supervisors Network for Greening the Financial System[7], among others. The availability of these data in line with intended deadlines and level of quality is an important element in the further enhancement of the climate-change indicators.
See “ECB presents action plan to include climate change considerations in its monetary policy strategy”, press release, ECB, 8 July 2021.
See “Towards climate-related statistical indicators”, Statistics Committee of the ESCB, ECB, January 2023.
Transition risks are associated with the transition to a low-carbon economy and may result from the phasing-in of carbon taxes, pricing of emissions rights, changing behaviours and consumption patterns, and environmental regulations. Physical risks tend to be both acute and chronic.
Regulation (EU) 2020/852 of the European Parliament and of the Council of 18 June 2020 on the establishment of a framework to facilitate sustainable investment, and amending Regulation (EU) 2019/2088 (OJ L 198, 22.6.2020, p. 13).
Available data tend to show where the parent company that took out the loan is located, rather than the location of the actual asset itself.
See the Network for Greening the Financial System’s website.