
Update on economic, financial and monetary developments
Summary
Economic activity
At the global level, the recovery momentum remains solid amid continued supply constraints. The Purchasing Managers’ Index data for June show historically high levels for the second quarter of 2021 as a whole. At the same time, the growth momentum slowed somewhat in June because activity normalised to some extent in several key economies. Trade in goods remains robust despite increasing headwinds from supply bottlenecks. With respect to global inflation developments, price pressures increased further, driven largely by transitory factors such as base effects and pandemic-related supply constraints. Looking ahead, pandemic developments continue to be a source of uncertainty for the global economic recovery and may lead to an increasingly uneven growth path across countries.
The euro area economy rebounded in the second quarter of the year and, as restrictions are eased, is on track for strong growth in the third quarter. More and more people are getting vaccinated, and lockdown restrictions have been eased in most euro area countries. Manufacturing is expected to perform strongly, even though supply bottlenecks are holding back production in the near term. The reopening of large parts of the economy is supporting a vigorous bounce-back in the services sector. But the Delta variant of the coronavirus (COVID-19) could dampen this recovery in services, especially in tourism and hospitality.
As people return to shops and restaurants and resume travelling, consumer spending is rising. Better job prospects, increasing confidence and continued government support are reinforcing spending. The ongoing recovery in domestic and global demand is boosting optimism among businesses, which supports investment. For the first time since the start of the pandemic, the euro area bank lending survey indicates that funding of fixed investment is an important factor driving the demand for loans to firms.
Economic activity is expected to return to its pre-crisis level in the first quarter of next year. But there is still a long way to go before the damage to the economy caused by the pandemic is offset. The number of people in job retention schemes has been declining but remains high. Overall, there are still 3.3 million fewer people employed than before the pandemic, especially among the younger and lower skilled. Significant policy support remains essential. An ambitious and coordinated fiscal policy should continue to complement monetary policy in underpinning confidence and supporting spending. The Next Generation EU programme is also playing a key role, as it should contribute to a stronger and more uniform recovery across the euro area.
Inflation
Euro area inflation was 1.9% in June. Inflation is expected to increase further over the coming months and to decline again next year. The current increase is largely being driven by higher energy prices and by base effects from the sharp fall in oil prices at the start of the pandemic and the impact of the temporary VAT reduction in Germany last year. By early 2022, the impact of these factors should fade out as they fall out of the year-on-year inflation calculation. In the near term, the significant slack in the economy is holding back underlying inflationary pressures. Stronger demand and temporary cost pressures in the supply chain will put some upward pressure on prices. But weak wage growth and the past appreciation of the euro mean that price pressures will likely remain subdued for some time.
There is still some way to go before the fallout from the pandemic on inflation is eliminated. As the economy recovers, supported by the Governing Council’s monetary policy measures, inflation is expected to rise over the medium term, although remaining below the ECB’s target. While measures of longer-term inflation expectations have increased, they remain some distance from the ECB’s 2% target.
Risk assessment
The Governing Council sees the risks to the economic outlook as broadly balanced. Economic activity could outperform the ECB’s expectations if consumers spend more than currently expected and draw more rapidly on the savings they have built up during the pandemic. A faster improvement in the pandemic situation could also lead to a stronger expansion than currently envisaged. But growth could underperform expectations if the pandemic intensifies or if supply shortages turn out to be more persistent and hold back production.
Financial and monetary conditions
The recovery of growth and inflation still depends on favourable financing conditions. Market interest rates have declined since the last monetary policy meeting in June. Financing conditions for most firms and households remain at favourable levels.
Money creation in the euro area continued to normalise in May 2021, standing at 8.4% in annual growth terms, reflecting a moderation of monetary and credit flows amid an improving situation regarding the coronavirus pandemic. While the pace of deposit accumulation by households and firms normalised, Eurosystem asset purchases remained the dominant source of money creation. Growth in loans to the private sector returned to pre‑pandemic levels, at 2.7% annually, driven by a moderation in lending to firms. Moreover, according to the euro area bank lending survey, credit standards on loans to firms and households were broadly unchanged in the second quarter of 2021, while demand for loans by firms and households increased.
Bank lending rates for firms and households remain historically low. In May 2021 the composite bank lending rate for loans to non-financial corporations decreased to 1.46%, while it was broadly unchanged for loans to households at 1.32%. Firms are still well funded as a result of their borrowing in the first wave of the pandemic, which in part explains why lending to firms has slowed. By contrast, lending to households is holding up. The most recent euro area bank lending survey shows that credit conditions for both firms and households have stabilised. Liquidity remains abundant.
At the same time, the cost for firms of issuing equity is still high. Many firms and households have taken on more debt to weather the pandemic. Any worsening of the economy could therefore threaten their financial health, which could trickle through to the quality of banks’ balance sheets. It remains essential to prevent balance sheet strains and tightening financing conditions from reinforcing each other.
Monetary policy statement
Against this background, at its monetary policy meeting in July, the Governing Council focused on two main topics: first, the implications of its strategy review for its forward guidance on the key ECB interest rates; and, second, its assessment of the economy and its pandemic measures.
In the ECB’s recent strategy review, the Governing Council agreed a symmetric inflation target of 2% over the medium term. The ECB’s policy rates have been close to their lower bound for some time and the medium-term outlook for inflation is still well below the ECB’s target. In these conditions, the Governing Council has revised its forward guidance on interest rates. It did so to underline its commitment to maintain a persistently accommodative monetary policy stance to meet its inflation target.
In support of the Governing Council’s symmetric 2% inflation target and in line with its monetary policy strategy, the Governing Council expects the key ECB interest rates to remain at their present or lower levels until it sees inflation reaching 2% well ahead of the end of the projection horizon and durably for the rest of the projection horizon, and it judges that realised progress in underlying inflation is sufficiently advanced to be consistent with inflation stabilising at 2% over the medium term. This may also imply a transitory period in which inflation is moderately above target.
The Governing Council viewed the recovery in the euro area economy as being on track but the pandemic continues to cast a shadow, especially as the Delta variant constitutes a growing source of uncertainty. Inflation has picked up, although this increase is expected to be mostly temporary. The outlook for inflation over the medium term remains subdued.
It is necessary to preserve favourable financing conditions for all sectors of the economy over the pandemic period. This is essential for the current rebound to turn into a lasting expansion and to offset the negative impact of the pandemic on inflation. Therefore, having confirmed the Eurosystem’s June assessment of financing conditions and the inflation outlook, the Governing Council continues to expect purchases under the pandemic emergency purchase programme (PEPP) over the current quarter to be conducted at a significantly higher pace than during the first months of the year.
The Governing Council also confirmed its other measures to support the ECB’s price stability mandate, namely the level of the key ECB interest rates, the Eurosystem purchases under the asset purchase programme (APP), the Governing Council’s reinvestment policies and its longer-term refinancing operations.
The Governing Council stands ready to adjust all of its instruments, as appropriate, to ensure that inflation stabilises at the ECB’s 2% target over the medium term.
1 External environment
At the global level, the recovery momentum remains solid amid supply constraints. The Purchasing Managers’ Index data for June show historically high levels for the second quarter of 2021 as a whole. At the same time, the growth momentum slowed somewhat in June as activity normalised in several key economies. Trade in goods remains robust despite increasing headwinds from supply bottlenecks. With respect to inflation developments, price pressures increased further, partially as a result of base effects and supply constraints, which are assessed to be transitory. Looking ahead, developments in the coronavirus (COVID-19) pandemic continue to be a source of uncertainty for the global economic recovery and may led to an increasingly uneven growth path across countries.
The global economic recovery momentum remains solid amid divergent pandemic developments. Global real GDP growth (excluding the euro area) increased by 0.9% quarter on quarter in the first quarter of 2021. The growth momentum is expected to remain solid in the second quarter as advanced and emerging market economies continue to reopen their economies amid divergent pandemic developments. The new Delta variant of the coronavirus is driving a rise in cases in a number of countries. However, in countries with relatively high rates of vaccinations, pressures on health systems have remained limited despite the increase in COVID-19 cases. Overall, pandemic developments remain one of several factors affecting divergent growth perspectives across countries.
The global recovery is also reflected in strong survey data. The composite output Purchasing Managers’ Index (PMI) – excluding the euro area – rose to a 15-year high in the second quarter of 2021. Economic activity remains solid in manufacturing and is gaining strength in the services sector. The survey data softened somewhat towards the end of the second quarter, as the high PMI readings normalised to some extent in a number of countries, including the United States and China.
At the same time, supply constraints are creating headwinds to global economic activity and trade. Suppliers’ delivery times – excluding the euro area – extended in June beyond the peak observed during the global shutdown in April of last year (Chart 1). The supply constraints imply disruptions in global value chains, in particular computer chip shortages, which are delaying the production and delivery of autos and a range of electric products.
Chart 1
Global composite output PMI (excluding the euro area)
(diffusion indices)

Sources: Markit and ECB calculations.
Notes: The latest observations are for June 2021. A rise in “Suppliers’ delivery times (inverted)” implies longer delivery times of manufactured goods.
Despite supply chain frictions, world trade remained solid in the first half of 2021. Global merchandise imports (excluding the euro area) were stable in April, in three-month-on-three-month terms. Meanwhile, the global PMI for manufacturing new export orders (excluding the euro area) stood at an 11-year high in the second quarter of 2021, despite softening somewhat in June (Chart 2). Trade in services remains depressed, however, primarily owing to ongoing weak tourism flows.
Chart 2
Surveys and global trade in goods (excluding the euro area)
(left-hand scale: three-month-on-three-month percentage changes; right-hand scale: diffusion indices)
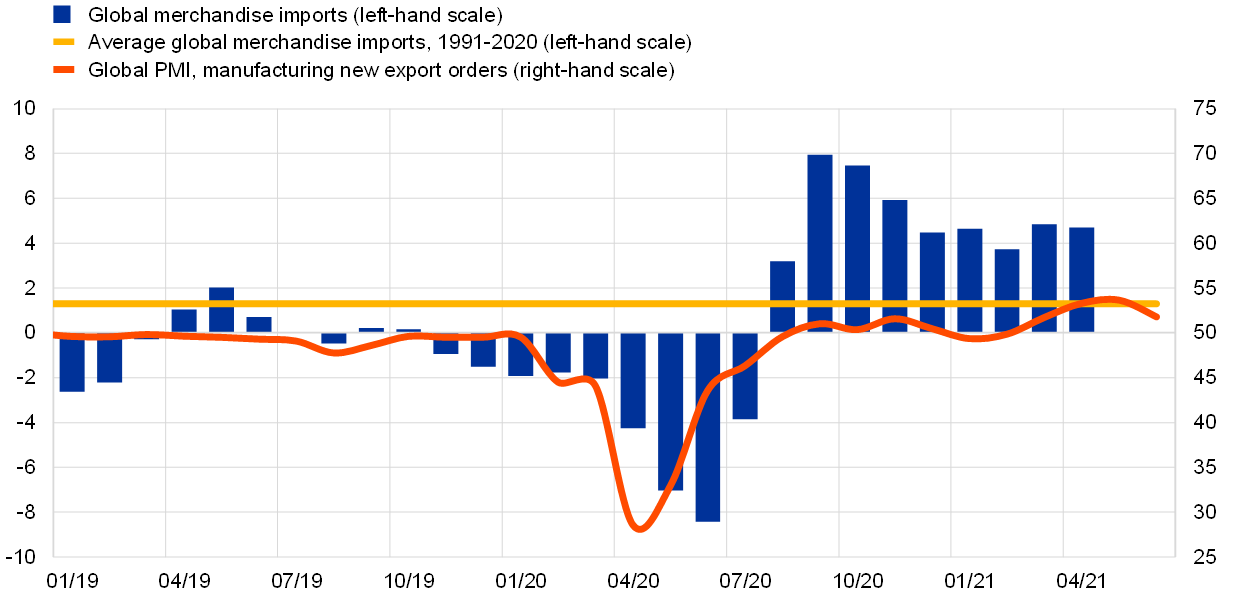
Sources: Markit, CPB Netherlands Bureau for Economic Policy Analysis and ECB calculations.
Note: The latest observations are for April 2021 for global merchandise imports and June 2021 for the PMIs.
Global inflation rose further in May, driven largely by transitory factors. Annual consumer price inflation in the countries of the Organisation for Economic Co-operation and Development (OECD) increased to 3.8% in May, up from 3.3% in April. Higher commodity prices, pushed up further by base year effects, contributed significantly to this development, while supply bottlenecks and fiscal stimulus also supported price pressures. Meanwhile, core inflation (excluding food and energy) rose to 2.9% in May, compared with 2.4% in the previous month. However, the current rates of median core inflation in advanced and emerging market economies remain close to the average levels observed since 2000. Part of the increase in global inflation is driven by temporary factors. The significant impact of the energy component is likely to decline in the months ahead as the base effect from last year’s slump in oil prices falls out from the annual comparison. As global supply chain frictions diminish, price pressures for the associated products (and their substitutes) are also likely to dissipate.
Oil prices continued to climb on the back of demand and supply factors. Supported by the rapid global economic recovery, oil prices have increased further since the Governing Council meeting in June, and now hover around their highest level since October 2018. Oil demand has increased substantially following a pick-up in mobility in recent weeks, particularly air travel, amid the swift reopening in some economies. Although OPEC+ recently reached a deal to expand its production, supply is lagging. The consequence has been a tightening of oil markets, spurring higher prices as consumption recovers. In contrast, metal commodity prices have plateaued since the last Governing Council meeting, while global food prices have fallen.
The US economy continues to recover strongly. Survey data showed that manufacturing and service activity remained at very high levels in June. At the same time, supply constraints are creating headwinds to the recovery, with a growing backlog of work and lengthening supplier delivery times. While the labour market continues to improve, skill mismatches in some sectors are leading to labour market tightness in the near term. Nonetheless, overall, the labour market recovery remains incomplete, with 7 million fewer people employed than before the COVID-19 crisis. Consumer price inflation rose strongly in June to 5.4% year on year, reflecting robust demand and supply constraints. However, this increase in inflation is likely to be largely transitory, as it partly reflects the impact of base effects. Idiosyncratic factors related to the reopening of the economy and supply chain frictions also played an important role, as reflected in significant price increases for air fares, hotel accommodation and used cars.
In the United Kingdom, the economy is rebounding, although rising COVID-19 cases increasingly pose downside risks. Monthly GDP growth in May continues to point to a strong recovery in the second quarter. Similarly, business surveys, consumer confidence and mobility trackers signal a strong rise in activity, particularly in the services sector. At the same time, computer chip shortages have disrupted car production, acting as a drag on manufacturing output. The new Delta variant of the coronavirus has driven a sharp increase in the number of daily new cases, but the impact on the health system is limited given the advanced vaccination progress. As a result, the impact on GDP growth is also expected to remain limited. Meanwhile, consumer price inflation rose sharply in May to 2.1%. While the drivers of inflation are mainly related to transitory factors affecting energy and transportation prices, survey indicators also signal a more broad-based increase in production costs, including wages, and a pass-through to prices charged.
In Japan, the pace of economic activity has slowed in the second quarter, owing in part to supply constraints and pandemic developments. Real GDP growth is expected to remain weak in the second quarter as a renewed rise in COVID-19 cases prompted a tightening of containment measures. Accordingly, service activity continued to be muted. At the same time, industrial production declined in May, affected in part by semiconductor shortages, which were also signalled in the survey data of the June manufacturing PMI. A firmer recovery is expected in the second half of the year, when a significant pick-up in the pace of vaccinations and a more favourable external environment is likely to support growth. Headline inflation edged up in May to -0.1%, supported by higher energy prices, but continues to be dampened by idiosyncratic factors, including marked cuts in mobile phone charges.
The recovery in China is progressing, while producer price pressures remain high. Monthly data point to continuing robust growth during the second quarter of 2021, notwithstanding a dampening in June. Meanwhile, annual producer price inflation stabilised at 8.8% in June, which remains close to the 12-year high of 9.0% recorded in May. As base effects and the impact of raw commodity prices fade, producer prices are expected to normalise. Annual consumer price inflation decreased slightly to 1.1% in June, largely owing to the ongoing normalisation of food price inflation, which outweighed higher fuel prices. Overall, a decline in month-on-month price pressures signals that annual inflation may have peaked in China. The People’s Bank of China cut its reserve requirement ratio by 50 basis points in July but stated that its monetary policy direction remains unchanged. Several key lending rates remained unchanged in July.
2 Financial developments
The long end of the euro overnight index average (EONIA) forward curve and long-term sovereign bond yields declined over the review period against the background of the spread of the Delta variant of the coronavirus (COVID-19) and weaker-than-expected global macroeconomic data releases. However, sovereign spreads remained broadly stable, while corporate bond spreads continued to narrow somewhat. Equity prices declined marginally for non-financial corporations and more significantly for the banking sector. Lastly, the euro depreciated slightly in trade-weighted terms.
The EONIA and the new benchmark euro short-term rate (€STR) averaged at ‑48 and -57 basis points respectively over the review period (10 June to 21 July 2021). Excess liquidity increased by approximately €18 billion to around €4,224 billion, as a result of asset purchases under the pandemic emergency purchase programme and the asset purchase programme, as well as the TLTRO III.8 take-up of €109.83 billion. This excess liquidity growth was substantially constrained by a decline in net other assets of around €234 billion over the review period.
Over the review period, the short end of the EONIA forward curve remained broadly unchanged, while the curve shifted down at longer maturities. The short end of the curve remains broadly flat at the present level of the EONIA. As a result, the forward curve does not currently suggest expectations of an imminent policy rate change in either direction, with the implied lift-off date (EONIA +10 basis points) currently priced in for Q3 2024. EONIA forward rates remain below zero for horizons up to 2027, reflecting continued market expectations for a prolonged period of negative interest rates.[1]
Long-term sovereign bond yields in the euro area decreased, partially reversing the upward trend observed over the past months (Chart 3). The GDP-weighted euro area and German ten-year sovereign bond yields decreased by around 15 basis points to -0.01% and -0.40%, respectively. Despite continuing progress in the COVID-19 vaccine roll-out and the release of overall positive survey indicators, which supported expectations of economic recovery, long-term rates declined against the background of concerning news about the spread of the Delta variant of the coronavirus amid a recent slowdown in the US vaccine roll-out and weaker global macroeconomic data releases relative to prevailing market expectations. This may have led investors to re-assess the risk outlook surrounding the global recovery. Following this re-assessment and the pricing out of an impending tapering of the Federal Reserve’s asset purchases, the ten-year US Treasury yield decreased by 15 basis points over the review period to 1.29%. A similar decline took place in the United Kingdom, where the ten-year sovereign bond yield reached 0.61%. Sovereign yields in the euro area did not show notable reactions to the announcement of the results of the ECB’s strategy review and the reformulation of the ECB’s forward guidance, nor to the recent Next Generation EU issuances, which were smoothly absorbed by sovereign bond markets.
Chart 3
Ten-year sovereign bond yields
(percentages per annum)

Sources: Refinitiv and ECB calculations.
Notes: This chart is based on daily data. The vertical grey line denotes the start of the review period on 10 June 2021. The zoom window shows developments in sovereign yields since 1 January 2021. The latest observation is for 21 July 2021.
Long-term euro area sovereign bond spreads relative to risk-free rates did not change significantly. Specifically, the ten-year Spanish spread increased by 7 basis points to 46 basis points while the Italian spread remained unchanged at 80 basis points. By contrast, the ten-year German and French spreads declined by 3 and 7 basis points, to -28 and 6 basis points, respectively. In consequence, the GDP-weighted euro area ten-year sovereign spread decreased by 3 basis points to 10 basis points, which is below its pre-pandemic level of February 2020.
Equity prices of non-financial corporations declined marginally, while bank equity prices saw prior gains reverse. Euro area non-financial stocks declined by around half a percentage point and overall continue to stand above their pre-pandemic levels. In the United States, where stock market prices have repeatedly posted record highs since mid-2020, non-financial stock market indices rose by 3.3%. In contrast, after having increased at the beginning of the review period, bank equity prices in the euro area and the United States decreased by 7.1% and 5.1%, respectively, amid a flattening of the yield curve. The larger price declines in this segment of the equity market may reflect the relatively larger exposure of these stocks to changes in risk perceptions, as implied equity market volatility rose somewhat through the review period, as well as sensitivity to weaker economic releases relative to the consensus market expectations.
Both financial and non-financial corporate bond spreads edged down further and stand below pre-pandemic levels. Spreads on investment-grade financial and non-financial bonds (relative to the risk-free rate) decreased by around 5 basis points to stand at 42 and 53 basis points, respectively.
In foreign exchange markets, the euro depreciated in trade-weighted terms (see Chart 4). Over the review period, the nominal effective exchange rate of the euro, as measured against the currencies of 42 of the euro area’s most important trading partners, weakened by 0.8%. The euro depreciated against the US dollar (by 3.3%), mainly reflecting the widening of the short-term interest rate expectations differential between the euro area and the United States, due to the perceived change in the timing of US monetary policy normalisation. The euro also weakened against other major currencies, including the Chinese renminbi (by 2.1%), the Japanese yen (by 2.8%) and the Swiss franc (by 0.6%), as well as against the currencies of some major emerging market economies. Over the same period, the euro continued appreciating against the currencies of several non-euro area European Union Member States, including the Hungarian forint (by 4.1%), the Polish zloty (by 2.6%) and the Czech koruna (by 1.2%).
Chart 4
Changes in the exchange rate of the euro vis-à-vis selected currencies
(percentage changes)

Source: ECB.
Notes: EER-42 is the nominal effective exchange rate of the euro against the currencies of 42 of the euro area’s most important trading partners. A positive (negative) change corresponds to an appreciation (depreciation) of the euro. All changes have been calculated using the foreign exchange rates prevailing on 21 July 2021.
3 Economic activity
Real GDP is expected to have rebounded in the second quarter of 2021, having declined by 0.3% in the first quarter.[2] Falling infection rates and the gradual reopening of the most contact-intensive sectors have boosted business and household confidence. However, supply-side bottlenecks are currently limiting the pace of expansion in the manufacturing sector. While the outlook is brightening, uncertainty remains high, particularly in relation to the fast spread of coronavirus mutations in some EU countries, which may tighten containment measures.
The medium-term outlook for economic activity continues to be strictly linked to the steady progress of vaccination campaigns, improving global demand and expansionary domestic policies. Favourable financing conditions, fiscal stimulus and rising confidence should further support the recovery. Significant policy support remains essential. An ambitious, targeted and coordinated fiscal policy should continue to complement monetary policy in underpinning confidence and supporting spending. The Next Generation EU programme is also playing a key role, as it should contribute to a stronger and more uniform recovery across the euro area.
The risks surrounding the growth outlook are broadly balanced. Downside risks are dominated by concerns about the pandemic and the possibility of more persistent supply shortages. At the same time, upside risks to growth stem mainly from the rebound in private consumption being more vigorous than projected as households draw more rapidly on the savings they have built up during the pandemic.
After a moderate decline in output in the first quarter of 2021, real GDP is estimated to have rebounded in the second quarter. In the first quarter of 2021, total economic activity continued to contract, by 0.3% quarter on quarter, leaving it 5.1% below the pre-pandemic peak seen at the end of 2019 (Chart 5). The expenditure breakdown shows that domestic demand contributed negatively to growth in the first quarter, whereas net trade provided a positive contribution. At the same time, changes in inventories contributed strongly to growth in the first quarter. This largely reflected increased stock building, in part due to prevailing low levels of inventories coupled with expectations of rising demand. The strong swings in activity during the pandemic have differed across countries, sectors and income groups (see Box 3).
In the second quarter of this year hard data, survey results and high-frequency indicators point, on balance, to a rebound in GDP growth. This reflects the relaxation of containment measures and declining infection rates thanks to strong progress in the ongoing vaccination campaigns. The return to growth in the second quarter is estimated to be mainly driven by the services sector, while the manufacturing sector has been affected by supply-side bottlenecks. Industrial production fell in May by 1.0%, month on month, after a moderate increase in April. The stagnation in production in the first two months of the second quarter was due to weak capital goods production on the back of supply-side bottlenecks. While production data point to the industrial sector making a relatively muted contribution to output growth in the second quarter, a significant rebound in overall activity is still expected as the services sector is likely to have contributed positively to growth, in line with the easing of containment measures. For instance, the composite output Purchasing Managers’ Index (PMI) rose to 56.8 in the second quarter of 2021, up from 49.9 in the first quarter, reflecting increases for both manufacturing (to 62.7) and services (to 54.7). The European Commission’s economic sentiment indicator (ESI) also increased strongly from the first to the second quarter, ending up well above the pre-pandemic level seen in February last year. This rise was broad-based across its components, with the largest increase recorded for services. Companies operating in the non-financial sector confirm this narrative about the short-term outlook (see Box 5).
Chart 5
Euro area real GDP, composite output PMI and ESI
(left-hand scale: quarter-on-quarter percentage changes; right-hand scale: diffusion index)

Sources: Eurostat, European Commission, Markit and ECB calculations.
Notes: The two lines indicate monthly developments; the bars show quarterly data. The ESI has been standardised and rescaled to have the same mean and standard deviation as the PMI. The latest observations are for the first quarter of 2021 for real GDP and June 2021 for the PMI and ESI.
The unemployment rate in the euro area declined in May, still supported by job retention schemes. The rate stood at 7.9% in May, 0.2 percentage points lower than in April (Chart 6), but still around 0.6 percentage points higher than before the pandemic in February 2020. The number of workers in job retention schemes is declining but remains elevated, at around 5% of the labour force in May. Employment decreased by 0.2% in the first quarter of 2021, following an increase of 0.4% in the fourth quarter of 2020. In the first quarter of 2021, employment was 2.1% lower than in the fourth quarter of 2019. Total hours worked declined again, by 0.6%, in the first quarter of 2021, following a 1.6% decline in the fourth quarter of 2020. These large declines reflect the impact of the pandemic-related restrictions imposed in these periods. Total hours worked remained 6.8% below the level recorded in the fourth quarter of 2019.
Chart 6
Euro area employment, the PMI employment indicator and the unemployment rate
(left-hand scale: quarter-on-quarter percentage changes, diffusion index; right-hand scale: percentages of the labour force)
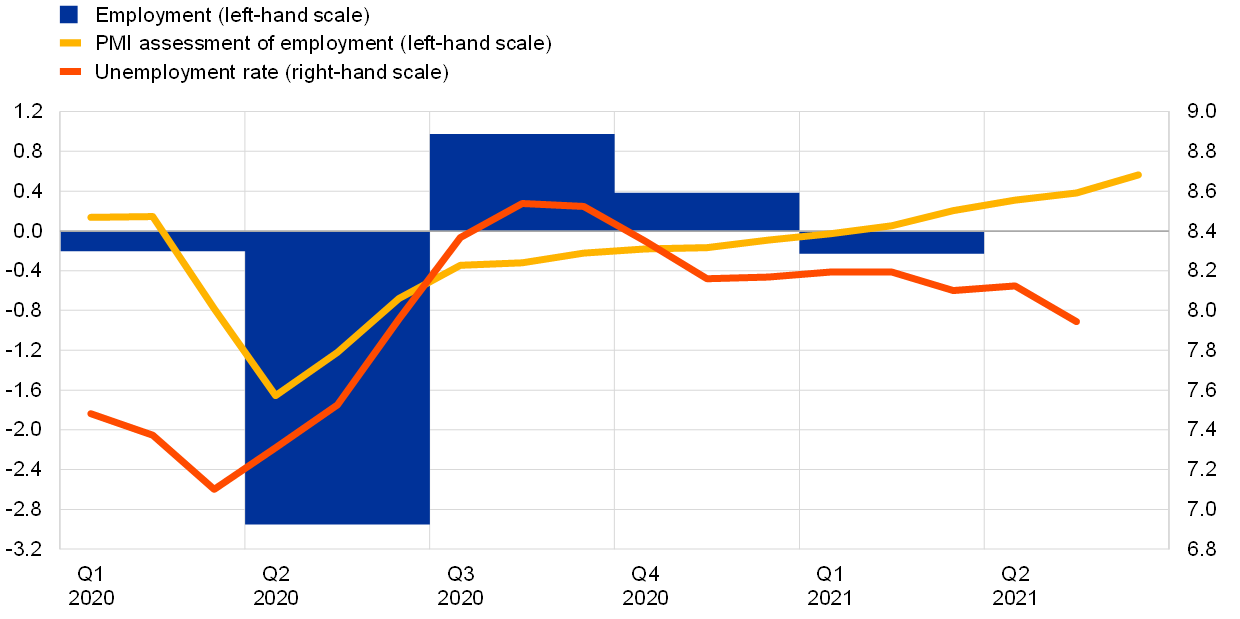
Sources: Eurostat, Markit and ECB calculations.
Notes: The two lines indicate monthly developments; the bars show quarterly data. The PMI is expressed as a deviation from 50 divided by 10. The latest observations are for the first quarter of 2021 for employment, June 2021 for the PMI and May 2021 for the unemployment rate.
Short-term labour market indicators have continued to improve. The monthly composite PMI employment indicator, encompassing industry and services, increased to 55.6 in June from 53.8 in May, thus remaining above the threshold level of 50 that indicates an expansion in employment. The PMI employment index has recovered significantly since its all-time low in April 2020 and is currently at its highest level since January 2018.
Consumers have gradually become more optimistic as containment measures have eased and vaccination campaigns have advanced. After a bleak first quarter of 2021, when private consumption fell by 2.2%, quarter on quarter, consumer spending appears to have strengthened in the second quarter. For instance, the volume of euro area retail sales increased in May by 4.6%, month on month, climbing above the pre-pandemic level seen in February last year. At the same time, new passenger car registrations edged up in the second quarter, by 0.3%, but in June were still 20% below their pre-pandemic level. Consumer confidence rose strongly in the second quarter, slightly surpassing its pre-pandemic level. This increase is largely attributable to households’ improving expectations about the general economic situation. Looking beyond the short term, as the economy recovers labour income should increasingly contribute to total household income, reducing the economy’s dependence on fiscal support. While households’ propensity to save peaked during the coronavirus (COVID-19) pandemic, the spike has been mostly involuntary and held in liquid assets. Overall, the underlying drivers of the recent surge in household saving do not suggest much of an additional boost to the expected rebound in private consumption in the coming year (Box 4 provides an in-depth analysis of household savings since the onset of the pandemic).
The outlook for corporate investment is favourable, driven by expectations of a continued recovery in revenues and the digitalisation trend. Non-construction investment contracted by 0.7%, quarter on quarter, in the first quarter of 2021, largely driven by transport equipment and reflecting supply-chain bottlenecks. Among the largest countries, investment declined in Germany and the Netherlands but showed robust growth in France, Italy and Spain. Industrial production and new orders of capital goods declined in May due to input shortages and lengthening supplier delivery times. At the same time, both the PMI and the European Commission’s survey indicators for the capital goods sector improved further in the second quarter. Moreover, firms’ revenues appear to be recovering, with lending to non-financial corporations slowing further in May, while firms’ bank deposits and debt redemptions increased. Information for listed companies suggests the pandemic continues to have an unequal impact on both sales and capital expenditure across sectors. Cross-sectoral dispersion in corporate earnings expectations has also increased (see Box 2). Although the leverage ratio (non-equity liabilities to total assets at market value) was broadly unchanged in the first quarter of 2021, the debt-to-GDP ratio increased further and cash buffering continued. Thanks to policy support and insolvencies moratoria, insolvencies have so far remained relatively contained below pre-pandemic levels. But, as shown in the Business at OECD (BIAC) 2021 Economic Policy Survey, businesses expect insolvencies to increase in the next two years, particularly in high-contact services sectors. Therefore, as the recovery proceeds care should be exercised when withdrawing policy support to avoid cliff-edge effects (Article 3 provides an overview of government support to the non-financial corporate sector during the COVID-19 crisis).
The recovery in housing investment is expected to continue in the near term, despite significant uncertainty due to supply bottlenecks and pandemic developments. In the first quarter of 2021 euro area housing investment almost returned to its pre-pandemic level (0.3% lower than in the fourth quarter of 2019). However, there was still significant variation across the largest euro area countries, with Germany, Italy and the Netherlands reaching levels of housing investment well above pre-pandemic levels, in contrast to France and Spain. Recent short-term structural and survey indicators point towards continued momentum for euro area housing investment in the second quarter, with the countries that are currently in a relatively stronger position seeing greater momentum. In April and May the euro area index for construction production was, on average, 2.0% above its average level in the first quarter of 2021, reflecting improvements in Germany, Italy and the Netherlands and declines in France and Spain, which were mainly due to tight pandemic-related restrictions in France and demand constraints in both France and Spain. At the same time, the PMI for construction output entered expansionary territory, on average, in the second quarter of 2021, while the European Commission’s construction confidence indicator improved further over the same period. Nevertheless, supply bottlenecks – due to the shortage of raw materials amid buoyant demand for new construction projects in the euro area and elsewhere – have exerted upward pressure on construction prices. Together with a resurgence of the pandemic due to new coronavirus variants, persistent supply constraints may hamper the recovery in housing activity in some euro area countries.
The recovery in euro area trade gained pace again at the end of the first quarter. After sustained growth rates in the second half of 2020, the recovery of euro area exports of goods and services slowed down in the first quarter of 2021 (increasing 0.6% quarter on quarter). Shipping and input-related constraints continued to exert a drag. Positive contributions to the growth of extra-euro area goods export volumes in March came mainly from Asia. From a sectoral perspective, a slowdown is apparent across all categories except capital goods. Long delivery times for final manufacturing products, such as cars, and increasing freight rates, along with a shortage of intermediate inputs (such as chemicals, wood, plastic, metals and semiconductors), put a strain on the growth of euro area goods exports. After the resumption of growth at the end of the first quarter, order-based forward-looking indicators for goods exports signal a slight weakening of momentum during the second quarter. By contrast, the leading indicator for service sector export orders reached its highest level since the start of the pandemic. Tourism forward bookings and cross-border flights point to a recovery in the second quarter to levels above those reached in the same period in 2020. Imports stagnated in the first quarter of 2021 (increasing 0.1% quarter on quarter) and are expected to be sustained by the recovery of domestic demand in the coming quarters.
Looking beyond the short term, the euro area economy is set for a steady recovery that continues to be supported by monetary and fiscal policies. The fast spread of coronavirus mutations is a key source of risk for the reopening of the economy. However, the continued progress of vaccination campaigns and the substantial experience households and firms have gathered on how to respond to targeted lockdowns reduces the likelihood of significantly adverse developments. The recovery is supported by substantial fiscal policy measures – including Next Generation EU funds – and improving foreign demand. In addition, monetary, fiscal and macroprudential policy measures are expected to successfully avert large financial amplification effects and limit the economic scars of the crisis. The results of the latest round of the Survey of Professional Forecasters (conducted in early July) show that GDP growth forecasts have been revised significantly upwards for 2021, 2022 and, albeit to a lesser extent, 2023, relative to the previous round conducted in early April.
4 Prices and costs
According to Eurostat’s release dated 16 July 2021, annual euro area HICP inflation decreased slightly, from 2.0% in May to 1.9% in June. However, inflation is likely to rise again over the coming months, mainly reflecting base effects from the temporary VAT cut in Germany. Underlying price pressures are expected to increase somewhat this year, owing to temporary supply constraints and the recovery in domestic demand. Nevertheless, price pressures are expected to remain subdued overall, partly reflecting low wage pressures, in the context of significant economic slack and the effects of the past appreciation of the euro. At the start of 2022, inflation is expected to decline again as the effect of temporary factors diminishes. When the impact of the pandemic fades, the unwinding of the high levels of slack, supported by accommodative monetary and fiscal policies, should contribute to a gradual increase in underlying inflation over the medium term. Market-based indicators of longer-term inflation compensation remained broadly unchanged, while the latest survey-based indicators rose.
Annual HICP inflation declined slightly in June, after successive increases since the start of the year. This measure eased from 2.0% in May to 1.9% in June (Chart 7). HICP energy inflation remained high at 12.6%, accounting for about 1.2 percentage points of headline inflation in June.[3] HICP inflation excluding energy and food (HICPX) decreased slightly, from 1.0% in May to 0.9% in June. Non-energy industrial goods (NEIG) inflation rose further in May and June, while services inflation declined in June. The share of items for which prices were imputed declined markedly in June, reducing the uncertainty surrounding the signal for underlying price pressures.[4]
Chart 7
Headline inflation and its components
(annual percentage changes; percentage point contributions)

Sources: Eurostat and ECB calculations.
Note: The latest observations are for June 2021.
Headline inflation has continued to be influenced by temporary factors on top of those related to base effects in energy inflation. The change in 2021 HICP weights had an upward effect on inflation in January that faded in February and March and turned negative in April. In June, the weight impact accounted for about -0.2 percentage points of headline inflation (Chart 8). Counterfactual calculations with 2020 weights would have seen both headline inflation and HICPX inflation remain unchanged from May to June. Weight effects are expected to imply some volatility over the coming months. Calendar effects have also had an impact on inflation rates in recent months. For instance, services inflation rose to 1.1% in May before declining to 0.7%, partly on account of the timing of Easter and other public holidays in that period. At the same time, changes in the timing and scope of shop sales periods had a strong upward impact on June NEIG inflation (1.2%, up from 0.7% in May), pushing it firmly above its 0.6% long-term average. About two-thirds of the increase in NEIG inflation from May to June was due to higher prices for footwear and clothing.
Chart 8
Contributions of base effects and other temporary factors to changes in annual HICP inflation since December 2020
(percentage point changes and contributions)

Sources: Eurostat, Deutsche Bundesbank and ECB calculations.
Notes: The contribution made by the temporary VAT cut in Germany is based on estimates provided in the Deutsche Bundesbank’s November 2020 Monthly Report. All effects are cumulated starting as of December 2020, taking the same month as benchmark. The latest observations are for June 2021.
Measures of underlying inflation mostly signalled a slight increase in June. HICPXX inflation, which also excludes clothing, footwear and travel-related services, continued its upward trend observed since February to stand at 1.4% in June. Looking at other measures of underlying inflation, the Supercore measure increased from 0.8% in May to 1.0% in June, while the Persistent and Common Component of Inflation (PCCI) remained roughly stable at 1.4%.
Chart 9
Measures of underlying inflation
(annual percentage changes)
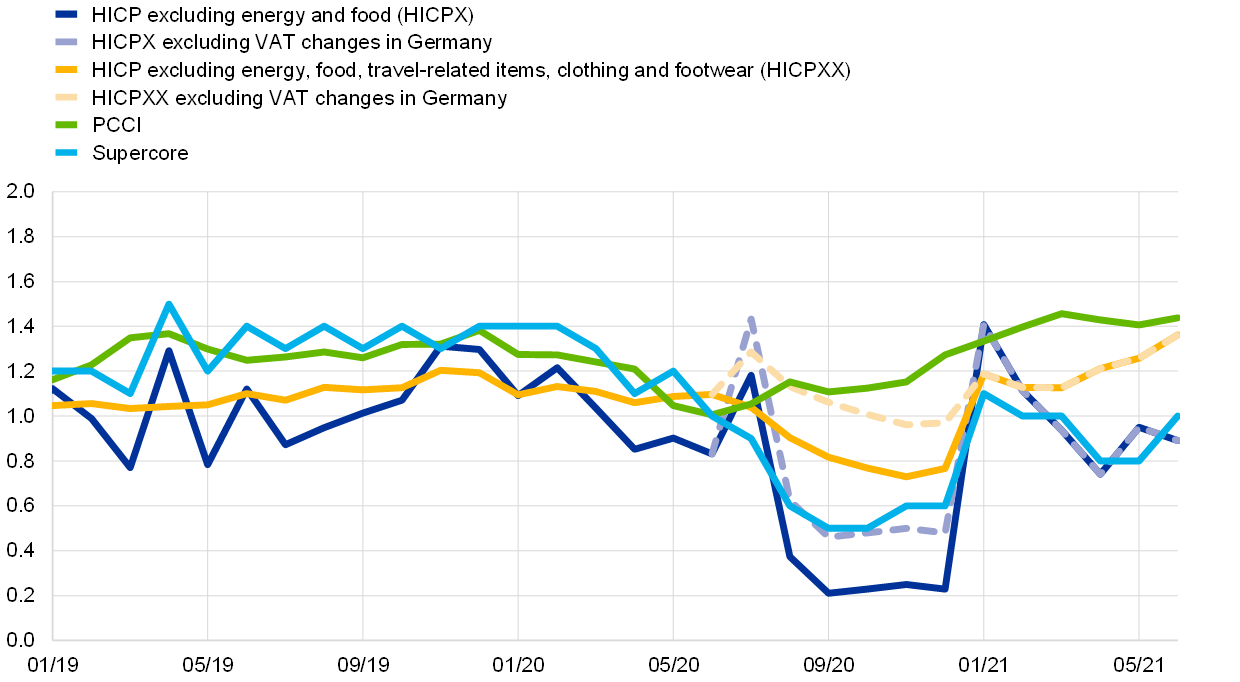
Sources: Eurostat and ECB calculations.
Note: The latest observations are for June 2021.
NEIG pipeline price pressures have increased further over recent months, albeit more so at earlier stages of the pricing chain. Producer price inflation for intermediate goods stood at 9.2% in May, 2.3 percentage points higher than in April and 4.8 percentage points higher than in March. Similarly, import price inflation for intermediate goods has continued to increase substantially to stand at 9.8% in May, up from 7.7% in April and 4.7% in March. These input cost pressures stem from surging commodity price inflation, substantial increases in shipping costs and an insufficient supply of some raw materials and intermediate products. The pressures are less visible at later stages of the pricing chain, but domestic producer price inflation for non-food consumer goods saw a further increase from 1.1% in April to 1.3% in May, reaching levels considerably above its long-term average of 0.6%. The impact that domestic producer prices are having on consumer goods inflation is, in part, being contained by the negative annual growth rates of import prices for non-food consumer goods (-0.8% in May, down from -0.7% in April), which have remained subdued owing to the impact of the past appreciation of the euro. While increases in input costs since autumn 2020 might have already contributed somewhat to higher NEIG inflation, additional upward pressures on NEIG inflation from recent input cost developments are still to be expected in the months ahead.[5] However, the timing and size of a pass-through to NEIG inflation will depend on how persistent the global input cost shocks turn out to be over the coming quarters.
Wage pressures remained low in the euro area. While most wage indicators continue to be affected by the impact of short-time work schemes introduced since the onset of the pandemic, the recent information from wage indicators overall suggests moderate wage growth in the euro area. After 1.0% in the fourth quarter of 2020, compensation per employee (CPE) growth rose to 1.9% in the first quarter of 2021 – close to its long-run average of 2.0% since 1999. The increase was broad-based across sectors – including manufacturing and services – although some care is needed in interpreting this outcome given the impact on CPE of job retention schemes. In fact, annual growth in compensation per hour decreased to 3.2% in the first quarter of 2021 from 5.2% in the previous quarter, mirroring the increase in hours worked as recourse to short-time work schemes lessened. Growth in negotiated wages, which are less affected by the impact of short-time work schemes, declined from 2.0% in the fourth quarter of 2020 to 1.4% in the first quarter of 2021, which suggests that the underlying trend on wage growth remains subdued. This is also in line with the main findings from the ECB’s recent contacts with non-financial companies which reported a moderate wage outlook.[6]
Output price inflation as measured by the GDP deflator increased in the first quarter of 2021. The annual growth rate of the GDP deflator rose to 1.5% in the first quarter of 2021 from 1.3% in the previous quarter. This mainly reflected a shift to positive contributions from profit margins, after negative contributions last year. By contrast, unit labour cost growth weakened as positive labour productivity growth outweighed a strengthening of CPE growth. Since government support measures are in some cases recorded as subsidies, the taxes minus subsidies component (as captured by net indirect taxes in Chart 10) had a dampening impact on the growth rate of the GDP deflator.
Chart 10
Contributions made by components of the GDP deflator
(annual percentage changes; percentage point contributions)

Sources: Eurostat and ECB calculations.
Notes: Profit margins are computed as the difference between the GDP deflator and the sum of unit taxes and unit labour costs. The latest observations are for the first quarter of 2021.
Market-based indicators of inflation compensation stand broadly unchanged, while survey-based indicators for both shorter and longer-term inflation expectations have been revised up. The upward trend in both shorter and longer-term market-based indicators of inflation compensation which could be observed between late 2020 and May this year has recently stalled. This mirrors developments in the United States, where market-based indicators of inflation compensation trended upwards for several months before moving sideways more recently. The most prominent forward inflation-linked swap rate, the five-year inflation-linked swap rate five years ahead, currently stands at 1.59%, 2 basis points higher than at the start of the review period. As for survey-based indicators, Consensus Economics reported an upward revision of inflation expectations to 1.9% for 2021, 1.4% for 2022 and 1.5% for 2023. The outlook for longer-term expectations was estimated at 1.8% for 2026. This is broadly in keeping with the latest ECB Survey of Professional Forecasters (SPF), which also entailed an upward revision of inflation expectations across horizons.
Chart 11
Survey and market-based indicators of inflation expectations
(annual percentage changes)

Sources: Eurostat, Thomson Reuters, Consensus Economics, ECB (SPF) and ECB calculations.
Notes: The market-based indicators of inflation compensation series is based on the one-year spot inflation rate and the one-year forward rate one year ahead, the one-year forward rate two years ahead, the one-year forward rate three years ahead and the one-year forward rate four years ahead. The latest observations relating to market-based indicators of inflation compensation are for 21 July 2021.
Growth in residential property prices has been on an upward trend since 2015 and continued to accelerate in the first quarter of 2021. According to the ECB’s residential property price indicator, prices of houses and flats in the euro area increased by 6.2% on a year-on-year basis – the highest rate since mid-2007 – in the first quarter of 2021, after a 6.0% increase in the last quarter of 2020. House price dynamics continued to remain resilient across countries.[7]
5 Money and credit
In May 2021, money creation in the euro area continued to normalise, reflecting a moderation of monetary and credit flows amid an improving situation regarding the coronavirus (COVID-19) pandemic. While the pace of deposit accumulation by households and firms slowed down, Eurosystem asset purchases remained the dominant source of money creation. Growth in loans to the private sector returned to pre-pandemic levels, driven by a moderation in lending to firms. Moreover, according to the euro area bank lending survey, credit standards on loans to firms and households were broadly unchanged in the second quarter of 2021, while demand for loans by firms and households increased.
In May 2021, broad money growth moderated further. The annual growth rate of M3 declined from its local peak of 12.5% in January 2021 and stood at 8.4% in May, after 9.2% in April (Chart 12). This development reflects a marked negative base effect linked to the exceptionally high liquidity needs of firms and households at the start of the pandemic in early 2020. Shorter-run dynamics of broad money imply a robust pace of money creation on the back of the support provided by monetary, fiscal and prudential policies. The main driver of M3 growth was the narrow aggregate M1, which includes the most liquid components of M3. Its annual growth rate moderated from its peak of 16.5% in January 2021 and stood at 11.6% in May, after 12.3% in April, driven by a further normalisation in the pace of deposit accumulation by firms and households. The contribution of other short-term deposits to M3 growth turned negative in May in line with an incipient recovery in consumer confidence and an increase in consumer spending. Marketable instruments made a small positive contribution to annual M3 growth in an environment of low interest rates and search-for-yield behaviour displayed by investors.
Money creation continued to be driven by Eurosystem asset purchases. As in previous months, the largest contribution to M3 growth came from the Eurosystem’s net purchases of government securities under the asset purchase programme and the pandemic emergency purchase programme (PEPP) (red portion of the bars in Chart 12). Further support for M3 growth came from credit to the private sector (blue portion of the bars in Chart 12). As before the pandemic, the contribution to money creation of bank credit to general government was marginally negative, owing to net sales of government bonds and reduced issuance of government securities (light green portion of the bars in Chart 12). Net external monetary flows had a broadly neutral effect on money creation, reflecting the fact that non-residents on balance sold government securities and euro area residents increased their investments in foreign assets (yellow portion of the bars in Chart 12). Moreover, longer‑term financial liabilities and other counterparts continued to dampen broad money growth (dark green portion of the bars in Chart 12), largely owing to developments in other counterparts. Favourable conditions for targeted longer‑term refinancing operations (TLTROs) continued to support the substitution of bank funding away from longer-term liabilities, thus making a small contribution to M3 growth.
Chart 12
M3 and its counterparts
(annual percentage changes; contributions in percentage points; adjusted for seasonal and calendar effects)

Source: ECB.
Notes: Credit to the private sector includes monetary financial institution (MFI) loans to the private sector and MFI holdings of securities issued by the euro area private non-MFI sector. As such, it also covers the Eurosystem’s purchases of non-MFI debt securities under the corporate sector purchase programme and the PEPP. The latest observations are for May 2021.
Loan growth to the private sector moderated further in May 2021. Loan growth to the private sector fell to 2.7% in May, down from 3.2% in April, driven by lending to firms (Chart 13). The annual growth rate of loans to firms decreased to 1.9% in May, after 3.2% in April, having hovered around 7% in the earlier phases of the pandemic. The weakening in loan growth coincided with an improvement in confidence indicators and economic activity, suggesting that a recovery in revenues could be under way, thus adding to the large liquidity buffers of the corporate sector. Lower loan growth to firms also reflected a base effect as the large credit flows to firms during the early stage of the pandemic dropped out from the annual figures. At the same time, the growth rate of loans to households edged up slightly to 3.9% in May and stabilised above pre-pandemic levels. Household borrowing mainly benefited from increases in mortgage lending, while consumer credit growth remained weak, despite a recovery in consumer confidence likely reflecting the accumulation of savings over the pandemic period.
Chart 13
Loans to the private sector
(annual percentage changes)
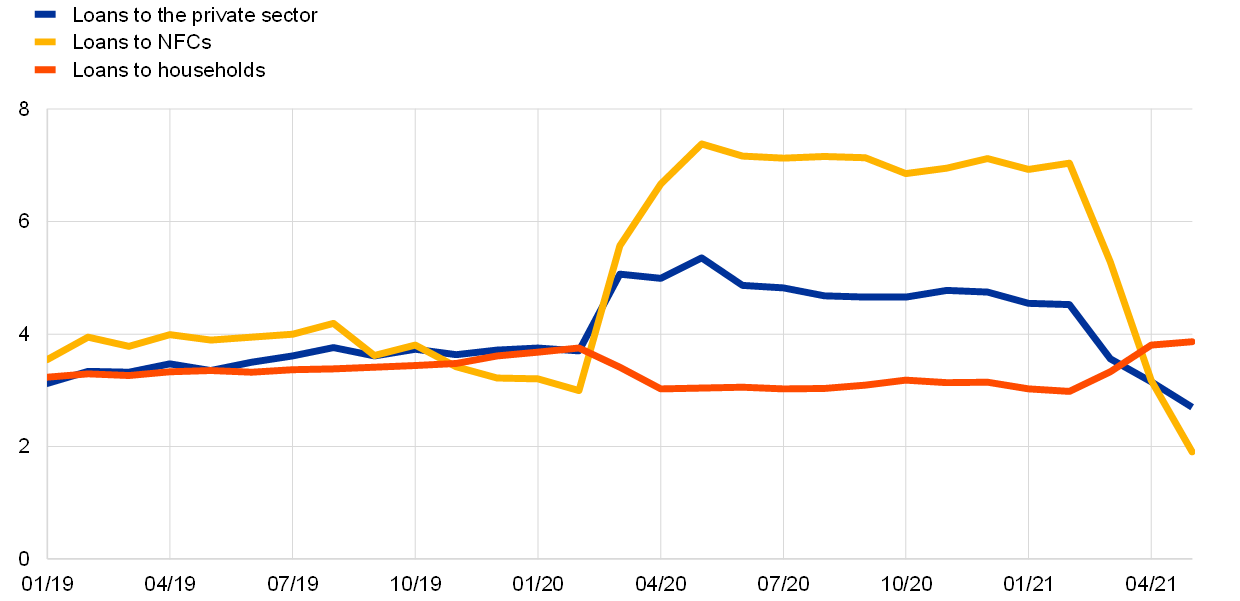
Source: ECB.
Notes: Loans are adjusted for loan sales, securitisation and notional cash pooling. The latest observations are for May 2021.
The July 2021 euro area bank lending survey showed broadly unchanged credit standards on loans to firms and households in the second quarter of 2021 (Chart 14). These developments followed a significant net tightening in the second half of 2020 and a moderate tightening for loans to firms in the first quarter of 2021. They reflect overall improvements in the economic situation of the euro area economy as containment measures are lifted and support continues to be provided by monetary, fiscal and supervisory authorities. In the first half of 2021, banks’ non-performing loan ratios had a moderate tightening impact on their credit standards for loans to enterprises, and a broadly neutral impact for loans to households. Banks indicated that COVID-19-related government guarantees were important in supporting terms and conditions for loans to firms. Banks’ cost of funds and balance sheet situation mostly had a neutral impact on credit standards, reflecting banks’ solid capital ratios and favourable funding costs. The previous significant tightening impact, implied by risk perceptions related to higher credit risks, loosened across loan categories: for firms it became neutral in the second quarter, while it turned into a small net easing impact for housing loans. For the third quarter of 2021, euro area banks expect a slight net tightening of credit standards on loans to firms and broadly unchanged credit standards for loans to households.
According to the survey, demand for loans by firms and households increased in the second quarter of 2021; for the first time since the third quarter of 2019, financing needs for fixed investment had a positive impact on loan demand by firms. These developments were driven by the low general level of interest rates, an improved economic outlook, and policy measures aimed at increasing the flow of credit to firms and households. By contrast, banks also indicated firms’ unchanged financing needs for working capital, in line with firms’ ample liquidity buffers and higher revenues. In addition, loan demand by households benefited from improvements in consumer confidence, housing market prospects, and spending on durables. For the third quarter of 2021, banks expect a further increase in the demand for loans by both firms and households.
Chart 14
Changes in credit standards and net demand for loans (or credit lines) to enterprises and households for house purchase
(net percentages of banks reporting a tightening of credit standards or an increase in loan demand)

Source: ECB (euro area bank lending survey).
Notes: For the bank lending survey questions on credit standards, ”net percentages” are defined as the difference between the sum of the percentages of banks responding “tightened considerably” or “tightened somewhat” and the sum of the percentages of banks responding “eased somewhat” or “eased considerably”. For the survey questions on demand for loans, “net percentages” are defined as the difference between the sum of the percentages of banks responding “increased considerably” or “increased somewhat” and the sum of the percentages of banks responding “decreased somewhat” or “decreased considerably”. The latest observations are for the second quarter of 2021.
Bank lending rates remained close to their historical lows. In May 2021 the composite bank lending rate for loans to non-financial corporations (NFCs) decreased to 1.46%, after a temporary increase in April, while it was broadly unchanged for loans to households at 1.32% (Chart 15). The decline in lending rates to firms was widespread across euro area countries and marks a return to the levels recorded over the preceding 12 months. Moreover, increases in the spread between bank lending rates on very small loans and those on large loans remained contained, mainly reflecting declines in rates for large loans. Despite the considerable uncertainty regarding the pandemic’s longer-term impact on the economy, policy support measures have prevented a broad-based tightening of financing conditions, which would have amplified the adverse economic impact of the pandemic.
Chart 15
Composite bank lending rates for NFCs and households
(percentages per annum)

Source: ECB.
Notes: Composite bank lending rates are calculated by aggregating short and long-term rates using a 24-month moving average of new business volumes. The latest observations are for May 2021.
Boxes
1 The implications of savings accumulated during the pandemic for the global economic outlook
The coronavirus (COVID-19) pandemic has led to the accumulation of a large stock of household savings across advanced economies, significantly above what has historically been observed. Owing to their large size, the savings accumulated since early 2020 have the potential to shape the post-pandemic recovery. The central question is whether households will spend heavily once pandemic-related restrictions are lifted and consumer confidence returns, or whether other motives (e.g. precautionary, deleveraging) will keep households from spending their accumulated excess savings. In this box we consider a set of non-euro area economies and conclude that, on the balance of economic arguments, any reduction in the stock of excess savings as a result of higher consumption is likely to be limited in the medium term. However, given the considerable uncertainty surrounding this central scenario, this box also looks at two alternative savings scenarios and assesses their implications for the global economic outlook using the Oxford Global Economic Model.
See more2 Cross-sectoral dispersion in firms’ earnings expectations during the COVID-19 crisis
While the recovery in equity prices over the last year has been underpinned by improvements in aggregate short-term earnings expectations (Chart A), developments in the latter have varied greatly across sectors (Chart B). Compared with the situation before the pandemic, expected earnings remain persistently subdued in sectors such as travel and tourism, while growing rapidly in the technology, utilities and non-bank financial services sectors. As a result, current earnings expectations are in line with what is called a cross-sectoral K-shaped recovery (where the paths of the best and worst-performing sectors resemble the two arms of the letter “K”). Similar dispersion holds true across countries (see also Box 3 of this issue of the Economic Bulletin and the May 2021 Financial Stability Review), in line with the idea that some countries are economically more dependent on particular sectors than other countries.
See more3 The heterogeneous economic impact of the pandemic across euro area countries
While the coronavirus (COVID-19) pandemic has been a common shock, its economic impact has been heterogenous across countries. This box describes how activity and demand have been affected in the euro area countries since the start of the pandemic and highlights some elements which may help to explain the heterogeneous performance across countries. It also points out the risks of persistent divergences and the important role of the Next Generation EU plans in reducing them. Differences across euro area countries include the degree of containment measures in response to the varying intensity of the health crisis, the different sectoral compositions and economic structures, and the quality of institutional settings. As fiscal support has been proportional to the depth of the health crisis, fiscal positions in euro area countries diverged in 2020.
See more4 COVID-19 and the increase in household savings: an update
This box analyses the increase in euro area household savings since the start of the coronavirus (COVID-19) crisis. It provides an update of an earlier analysis of the drivers of the recent surge in savings and what they imply for the adjustment of savings and the recovery in private consumption as the pandemic is brought under control.[8] Since the pandemic has mainly affected euro area economic activity through restrictions imposed on several types of consumption, the nature of the recovery in this demand component will largely determine how fast overall economic activity recovers.
See more5 Main findings from the ECB’s recent contacts with non-financial companies
This box summarises the results of contacts between ECB staff and representatives of 63 leading non-financial companies operating in the euro area. The exchanges took place between 28 June and 7 July 2021.[9]
See more6 The role of sectoral developments for wage growth in the euro area since the start of the pandemic
The economic consequences of and policy responses to the pandemic pose challenges for interpreting wage developments. Aggregate wage growth is mostly assessed in terms of compensation per employee or compensation per hour worked.[10] The coronavirus (COVID-19) pandemic has led to a substantial divergence between compensation per employee and compensation per hour. The high number of workers on job retention schemes played a decisive role in these developments, especially via the implications for hours worked per person. Such schemes tend to have a downward effect on compensation per employee, as employees usually retain their employment status but, in most countries, face pay cuts when enrolling in these schemes. Moreover, the benefits of such schemes are not included in statistical measures of compensation where they are directly paid to employees.[11] At the same time, such schemes have an upward effect on compensation per hour, as hours worked tend to be reduced far more strongly than pay.
See more7 Recent developments in pipeline pressures for non-energy industrial goods inflation in the euro area
Pronounced rises in input costs on a global level have led to marked increases in import and producer prices for intermediate goods in the euro area (Chart A). Surging commodity price inflation, substantial increases in shipping costs and insufficient supply of some raw materials and intermediate products have led to input cost pressures for the euro area.[12] Such input cost shocks create “pipeline” price pressures at the early stages of the production and distribution chain. Recent developments in input costs have pushed up core producer prices (essentially producer prices in the manufacturing sector), in which intermediate goods have a large weight, with the latter reflecting price increases observed for, especially, basic metals, chemicals and chemical products. How much of these pressures ultimately feeds through to later stages and goods prices at the consumer level depends on many factors, including their duration and firms’ scope and willingness to absorb them by reducing profit margins. In the consumption basket underlying the Harmonised Index of Consumer Prices (HICP) in the euro area, these consumer goods prices are reflected in the category “non-energy industrial goods” (NEIG).
See more8 The structural impact of the shift from defined benefits to defined contributions
Retirement provision in euro area countries typically consists of three pillars: government sponsored pay-as-you-go plans (pillar 1), occupational (funded) pension schemes (pillar 2) and private pensions/life insurance (pillar 3). The latter two receive contributions from either employers or employees, providing an important supplement to pillar 1 in some euro area countries, notably the Netherlands, where occupational pension fund assets exceed 200% of GDP.
See moreArticles
1 An overview of the ECB’s monetary policy strategy
The new monetary policy strategy of the European Central Bank (ECB) was published on 8 July 2021. While the mandate is conferred upon the ECB by the Treaties, the ECB has to devise its monetary policy strategy. This strategy sets out how to achieve the primary objective of maintaining price stability in the euro area, referring to an appropriate set of monetary policy instruments, indicators and intermediate targets, as well as how to take into account other considerations without prejudice to price stability. A monetary policy strategy serves two main purposes: first, it provides policymakers with a coherent analytical framework that maps actual or expected economic developments into policy decisions; second, it serves as a vehicle for communicating with the public. The ECB’s monetary policy strategy was last reviewed in 2003 and the changes that have since occurred to the economic and financial backdrop as well as to the predominant policy challenges warranted an update. This overview details the rationale and thinking behind the strategy and its main elements.
See more2 Using machine learning and big data to analyse the business cycle
Policymakers take decisions in real time based on incomplete information about current economic conditions. Central banks and economic analysts largely rely on official statistics together with soft data and surveys, to assess the state of the economy. Although a wide range of high-quality conventional data is available, the datasets are released with lags ranging from a few days or weeks to several months after the reference period. For these reasons, central banks have been looking at ways to exploit timelier data and employ more sophisticated methods to enhance accuracy when forecasting metrics that are relevant for policymaking.
See more3 The role of government for the non-financial corporate sector during the COVID-19 crisis
The pandemic and the containment adopted entailed economic disruptions worldwide, which induced substantial government interventions to support firms. In anticipation of the negative consequences of the restrictions imposed around the world, governments quickly deployed a set of diverse tools to mitigate the impact of the crisis on the corporate sector.
See moreStatistics
Statistical annex© European Central Bank, 2021
Postal address 60640 Frankfurt am Main, Germany
Telephone +49 69 1344 0
Website www.ecb.europa.eu
All rights reserved. Reproduction for educational and non-commercial purposes is permitted provided that the source is acknowledged.
This Bulletin was produced under the responsibility of the Executive Board of the ECB. Translations are prepared and published by the national central banks.
The cut-off date for the statistics included in this issue was 21 July 2021.
For specific terminology please refer to the ECB glossary (available in English only).
ISSN 2363-3417 (html)
ISSN 2363-3417 (pdf)
QB-BP-21-005-EN-Q (html)
QB-BP-21-005-EN-N (pdf)
- This assessment reflects information from the latest survey results and empirical estimates of “genuine” rate expectations, i.e. forward rates net of term premia.
- According to the flash estimate released by Eurostat on 30 July, euro area real GDP increased by 2% quarter on quarter in the second quarter of 2021. This estimate, which was not available at the time of the July Governing Council meeting, broadly confirms the expected rebound in economic activity, exceeding the Eurosystem staff projections for the second quarter made in June 2021.
- For details, see the box entitled “Recent dynamics in energy inflation: the role of base effects and taxes”, Economic Bulletin, Issue 3, ECB, 2021.
- The share of price imputations for HICP items stands at 4% in June, compared with 13% in January, and price imputations for HICPX fell to 5% in June, compared with 18% in January.
- For a more detailed overview of recent and upcoming developments in pipeline pressures and their impact on HICP non-energy industrial goods, see the box entitled “Recent developments in pipeline pressures for non-energy industrial goods inflation in the euro area” in this issue of the Economic Bulletin.
- For the complete overview of the recent contacts with non-financial companies, see the box entitled “Main findings from the ECB's contacts with non-financial companies” in this issue of the Economic Bulletin.
- For a more detailed overview of house price developments, see the box entitled “Euro area house price developments during the coronavirus pandemic”, Economic Bulletin, Issue 4, ECB, 2021.
- See the box entitled “COVID-19 and the increase in household savings: precautionary or forced?”, Economic Bulletin, Issue 6, ECB, 2020.
- For further information on the nature and purpose of these contacts, see the article entitled “The ECB’s dialogue with non-financial companies”, Economic Bulletin, Issue 1, ECB, 2021.
- See the box entitled “Assessing wage dynamics during the COVID-19 pandemic: can data on negotiated wages help?”, Economic Bulletin, Issue 8, ECB, 2020.
- See also the box entitled “Short-time work schemes and their effects on wages and disposable income”, Economic Bulletin, Issue 4, ECB, 2020.
- See also the boxes entitled “What is driving the recent surge in shipping costs?”, Economic Bulletin, Issue 3, ECB, 2021 and “The semiconductor shortage and its implication for euro area trade, production and prices”, Economic Bulletin, Issue 4, ECB, 2021.