
Euro area international investment position and its geographical breakdown at the end of 2012 and geographical breakdown of the current account up to the second quarter of 2013
The international investment position of the euro area vis-à-vis the rest of the world recorded net liabilities of €1.3 trillion (13% of euro area GDP) at the end of 2012, €193 billion less than at the end of 2011. This change was due mainly to net financial transactions (€141 billion). Other changes in outstanding amounts resulted from other adjustments (€369 billion) that were largely compensated for by negative revaluation effects on account of changes in prices (€322 billion).
At the end of 2012, 22% of the euro area’s stock of direct investment abroad was in the United States, and 20% was in the United Kingdom, while these two countries’ shares in the stock of foreign direct investment in the euro area were somewhat larger (with 26% originating from the United States and 23% from the United Kingdom). The portfolio investment assets of euro area residents mainly reflected holdings of securities issued in the United States (31%) and the United Kingdom (20%).
The international investment position as at end-2012
At the end of 2012, the international investment position of the euro area vis-à-vis the rest of the world recorded net liabilities of €1.3 trillion (13% of euro area GDP), €193 billion less than the revised end-2011 position, which represented 15% of euro area GDP (see Chart 1a).
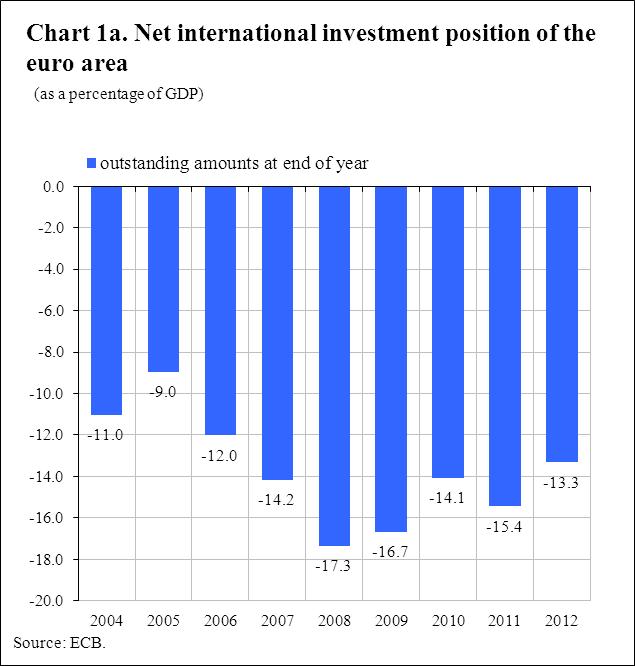
The decrease in the net liability position from end-2011 to end-2012 was due mainly to net transactions (€141 billion; see Chart 1b), as well as to positive other adjustments (€369 billion) that were largely offset by negative price changes (€322 billion), while exchange rate changes had a modest positive impact (€5 billion). Compared with 2011, net financial transactions had a larger impact on the euro area’s net liability position, whereas other adjustments and price changes worked in the opposite direction.
Net financial transactions were driven mainly by net outflows in other investment (€199 billion), due mainly to decreases in the liabilities of MFI’s excluding the Eurosystem (€235 billion). These net outflows were partially compensated for by net inflows in portfolio investment (€72 billion), which were driven by net purchases of euro area equity securities by non-residents (€144 billion).
Changes in outstanding amounts as a result of price changes resulted in a decrease of €322 billion in 2012. These were mainly recorded in portfolio investment (€400 billion), reflecting increases in prices of euro area equity securities (€393 billion) and bonds and notes (€202 billion) held by non-residents that were higher than those in foreign equity securities (€180 billion) and bonds and notes (€15 billion) held by euro area residents.
In 2012, changes in outstanding amounts as a result of exchange rate changes were not very significant (€5 billion). They reflected the euro’s appreciation vis-à-vis other currencies in 2012 (e.g. 2% against the US dollar and 13% against the Japanese yen). The changes in the international investment position that were related to exchange rate variations were due mainly to foreign currency revaluations of other investment (€32 billion), which were partly offset by direct investment (€16 billion), portfolio investment (€4 billion) and reserve assets (€7 billion).
Other adjustments in portfolio investment and direct investment largely reflected improvements in data coverage and compilation methods due to the introduction of new surveys in preparation of the impending change to the sixth edition of the IMF’s Balance of Payments and International Investment Position Manual (BPM6) in 2014.

The geographical breakdown of the international investment position as at end-2012
At the end of 2012, the stock of euro area direct investment abroad totalled €5.9 trillion, of which 22% was invested in the United States, 20% in the United Kingdom, 10% in Switzerland, yet another 10% in offshore financial centres and 6% in other non-euro area EU Member States. The stock of foreign direct investment in the euro area totalled €4.4 trillion, with 26% from the United States, 23% from the United Kingdom, 18% from offshore financial centres and 10% from Switzerland. Only 1% of foreign direct investment in the euro area came from other non-euro area EU Member States (see Table 2a).
Compared with 2011, the shares of the euro area’s main partners remained broadly unchanged. Offshore financial centres continued to be the largest group of net direct investors in the euro area (€223 billion), and other non-euro area EU Member States remained the largest group of net recipients of direct investment from the euro area (€284 billion).
As regards portfolio investment, euro area holdings of foreign securities totalled €5.3 trillion at the end of 2012, largely reflecting holdings of securities issued in the United States (which accounted for 31% of the total), the United Kingdom (20%) and offshore financial centres (8%). Non-residents’ holdings of euro area securities totalled €8.4 trillion at the end of 2012.
Turning to other investment, euro area residents’ outstanding holdings abroad (e.g. loans to non-residents by euro area MFIs or deposits held by euro area residents with non-euro area MFIs) totalled €4.8 trillion at the end of 2012, of which 38% was in the United Kingdom, 14% in the United States and 11% in offshore financial centres. Other investment in the euro area (e.g. deposits held by non-residents with euro area MFIs or loans to euro area residents by non-euro area MFIs) totalled €5.1 trillion at the end of 2012, with the United Kingdom accounting for 37%, the United States for 12% and offshore financial centres for 10%.
The geographical breakdown of the four-quarter cumulated current account up to the second quarter of 2013
The four-quarter cumulated current account of the euro area up to the second quarter of 2013 showed a surplus of €182.8 billion (1.9% of euro area GDP), compared with a surplus of €56.0 billion (0.6% of euro area GDP), a year earlier (see Table 3). This increase resulted mainly from increases in the surpluses for goods (from €44.8 billion to €147.6 billion) and, to a limited extent, for income (from €41.3 billion to €58.4 billion) and services (from €83.8 billion to €93.8 billion), developments which were offset, to a limited extent, by an increase in the deficit for current transfers (from €113.9 billion to €117.0 billion).
The increase in the surplus on the goods account was due predominantly to a decrease in the deficits vis-à-vis “other countries” (from €124.3 billion to €54.6 billion) and Japan (from €9.6 billion to €0.8 billion), and to an increase in the surpluses vis-à-vis the United Kingdom (from €47.1 billion to €58.0 billion) and the United States (from €68.0 billion to €76.5 billion). Similarly, the increase in the surplus for income was due mainly to decreases in the deficits vis-à-vis the United Kingdom (from €20.1 billion to €17.6 billion) and the United States (from €44.9 billion to €31.7 billion).
The four-quarter cumulated data up to the second quarter of 2013 revealed that non-euro area EU Member States (excluding the United Kingdom) represented the euro area’s primary trading partners, accounting for 16% of all goods and services exported and imported by the euro area, followed by the United Kingdom and the United States (see Charts 2a and 2b).

Data revisions
This press release incorporates a revised set of balance of payments and international investment position statistics for the period 2010-12 (see Table 4).
The revisions to the current account in 2011 mainly concerned the goods account, and resulted in the current account surplus (€14.9 billion) decreasing by € 6.7 billion to € 8.2 billion.
The revisions to the capital account in 2012 resulted in a reduction of the surplus by €10.1 billion (to €5.0 billion).
In the financial account of the balance of payments, revisions primarily concerned direct investment in the euro area in 2011 and 2012, portfolio investment liabilities in 2010, 2011 and 2012, as well as net other investment and financial derivatives in 2012.
In the international investment position, the revisions for 2011 caused the euro area’s net liability position to increase by €146 billion to €1.5 trillion. Finally, the euro area’s net liability position at end-2012 (€1.3 trillion) was likewise revised upwards by €23 billion.
Additional information on the euro area balance of payments and international investment position
This press release breaks year-on-year changes in the international investment position down into valuation adjustments that result from price changes, exchange rate changes and other adjustments (e.g. the reclassification of items, write-downs, changes in survey coverage and changes to companies’ places of residence). This breakdown is obtained by modelling non-transaction-related changes in the international investment position using information derived from the geographical breakdown and currency composition of assets and liabilities, as well as price indices for different financial assets.
In addition, this press release breaks direct investment in equity down into investment in listed companies, investment in unlisted companies and investment in real estate. While direct investment in listed companies is valued on the basis of the market prices observed on stock exchanges, investment in unlisted companies is valued on the basis of the books of the companies being financed. For analytical purposes, listed companies’ valuation at book value is provided as a memorandum item, although it is not considered in the calculation of total direct investment.
A geographical breakdown of the euro area’s international investment position at end-2012 and the quarterly balance of payments are not available for portfolio investment liabilities, financial derivatives or reserve assets Moreover, no separate data are provided for investment income payable to China; furthermore, for offshore financial centres and international organisations, data are available only for the financial account.
In this press release, data are not working day or seasonally adjusted.
A complete set of updated euro area balance of payments and international investment position statistics (including debt securities broken down by currency of denomination) is available in the “Statistics” section of the ECB’s website under the headings “Data services”/“Latest monetary, financial markets and balance of payments statistics”. These data, as well as historical time series for the euro area balance of payments and international investment position, can be downloaded from the ECB’s Statistical Data Warehouse (SDW). They will also be published in the November 2013 issues of the ECB’s Monthly Bulletin and Statistics Pocket Book. Detailed methodological notes are available on the ECB’s website. The next press release on the euro area’s monthly balance of payments. will be published on 18 November 2013.
The ECB will start publishing, at the end of 2014, the euro area balance of payments and international investment position statistics in accordance with its Guideline ECB/2011/23, which adheres to the sixth edition of the IMF’s Balance of Payments and International Investment Position Manual (BPM6). More detailed information is available on a dedicated webpage
Annexes
Table 1 – International investment position of the euro area, including a breakdown of changes from end-2011 to end-2012
Table 2a – Geographical breakdown of the euro area’s international investment position at end-2012
Table 2b – Geographical breakdown of the euro area’s international investment position at end-2011
Table 3 – Balance of payments of the euro area with a geographical breakdown
Table 4 – Revisions to the euro area’s balance of payments and international investment position
European Central Bank
Directorate General Communications
- Sonnemannstrasse 20
- 60314 Frankfurt am Main, Germany
- +49 69 1344 7455
- media@ecb.europa.eu
Reproduction is permitted provided that the source is acknowledged.
Media contacts